BTC DAILY PRICE ACTION 16 oct 2024The expectation here is that either BTC needs to hold 69000 which looks tough, why?
I will do a video analysis on it soon.
Retracement should push at the bottom where I have got an alert. There I will add again.
QQQ

SPY/QQQ Plan Your Trade For 10-15 : Gap Breakaway PatternToday's pattern suggests the SPY/QQQ will move into a Gap Breakaway type of price trend. I believe this means price will attempt to Gap higher at the open and attempt to move into a moderate rally phase throughout the day.
Remember, we are just starting to move into Q3 earnings data, which will last well into mid-November. On top of that, we have the US elections and other data (external) that may drive market trends.
Near the beginning of this video, I show you some of my ADL (Adaptive Dynamic Learning AI) predictive modeling system outcomes for various symbols on Daily charts. It is important to understand price is the ultimate indicator and we don't want to fight price. We just let price do what it wants to do and try to time the best trading opportunities on the charts.
Given what I believe it currently taking place, I suspect the SPY/QQQ will melt upward over the next 5-7+ trading days - attempting to reach a peak price level near October 24-25.
Metals appear to be in a consolidation channel (downward) and are struggling to break away from that channel. Move metals do break away from that channel - we are going to see an explosive move to the upside. I suspect that could happen later today or tomorrow.
Bitcoin is playing the Excess Phase Peak Pattern perfectly - moving into consolidation and now setting up the #4 (A or B) setup for traders. The next move is going to be explosive - either setting an ultimate high, or breaking downward and returning to recent lows.
Should be some exciting trends for all of us over the next 10+ days.
Get some.
#trading #research #investing #tradingalgos #tradingsignals #cycles #fibonacci #elliotwave #modelingsystems #stocks #bitcoin #btcusd #cryptos #spy #es #nq #gold

10/14 Bull run if THIS level confirmed as supportOverview:
The U.S. observed Columbus Day on Monday, with most businesses closed, but trading activity was still alive and well. The PYTH:SPY closed its fifth consecutive green day, reaching a new all-time high, while the PYTH:QQQ approaches its own record. Due to the holiday, the Federal Reserve didn't release any data, but tomorrow we'll see the Empire State Manufacturing Survey, and by Thursday, we’ll have jobless claims numbers, retail sales, home builder confidence, and business inventory reports.
Interestingly, the CME Watch Tool is now showing a 16.4% chance of no rate cut in November, up from just 10% last Friday. This shift may be in response to an overheated equities market. Meanwhile, Monday saw a wave of buying activity in crypto ETFs, with big names like BlackRock, Grayscale, and even Fidelity getting involved. ETH also caught BlackRock’s attention.
For a more reliable corporate earnings calendar, try this updated tool: finance.yahoo.com
BTC TA:
W: Last week, BINANCE:BTCUSDT opened at $62,810 and closed at $62,845, forming a large indecisive doji candle but managing to stay above the Bollinger Band middle line (BB MA). Throughout the week, the price showed lower highs and lower lows until Asian bulls stepped in on Monday morning. While U.S. traders were off for the holiday, Asian traders pushed BTC past its previous high, stopping just short of the crucial $66,550 mark. Keep an eye on $62.7k—it’s a key level on the weekly, 3-month, yearly, and current bull run (since October 2023) point of control. Anything above this level suggests a potential breakout toward $70k, while falling below it could indicate a bearish trend. To confirm, we need to see $62.7k act as solid support. We’ve already had two fake breakouts, so the chances of another are slim, but not impossible.
D: Over the last four days, BTC quickly moved from the bottom to the top of its Bollinger Bands. Coinbase reported 13.5k transactions on Monday—a strong volume, but not as high as in January or October 2023, when this bull run began. This suggests that larger institutional players are still waiting on the sidelines, watching closely. Despite the Fed’s rate cut and China’s $25 billion stimulus, global liquidity has been declining for the last 29 days.
4h: The RSI has hit 75, indicating an overbought condition. If you pull a Fibonacci retracement, the 0.618 level aligns with $64 k, which also coincides with previous weekly and daily resistance levels. This also matches the October 7th high, forming a critical level of interest.
1h: On Monday at 11 am Shanghai time, a large green candle kicked off a rally. Ten hours later, New York bulls joined the action, extending the pump. The rally lasted 19 hours, pushing BTC up by 6.23%.
Alts Relative to BTC: Altcoins are moving in tandem with BTC, but this rally isn’t as much about alts as it is about Bitcoin. While BTC gained 5%, ETH, SOL, and NEAR only posted gains of 6.x%, and none have reached their previous highs. SUI, APT, and TAO have even corrected slightly after their substantial gains of 100% or more over the last 30-40 days, leaving them room to consolidate.
Bull Case: We’re on the verge of exiting the bull flag pattern. Once the global liquidity index starts rising again, markets will likely be flooded with cheap money, fueling risk-on assets like crypto. A bounce off the $62.7k level will confirm it as support, pushing the bullish narrative.
Bear Case: If we see a third fake breakout, it could trap all the bulls.
Fear and Greed Index: Currently at 56, still in Neutral territory but just 4 points away from Greed.
Prediction: The outlook remains bullish, provided we don’t see another fake breakout, and $62.7k can be established as a solid support level.

SPY/QQQ Plan Your Trade 10-14 EOD Update - Rally Rally RallyWhat a great day for my followers! I created my Roadmap for all of you, and the markets have started this week doing exactly what I expected regarding the SPY/QQQ and Gold/Silver.
Next, we should see the rally continue in the SPY/QQQ, and Gold/Silver are moving into an Apex Breakaway setup, which could be very explosive to the upside.
Remember, what I do behind the scenes to prepare and understand market conditions is much deeper than what you see in these videos. Every weekend (and most days), I spend quite a bit of time trying to understand what is really taking place beneath the price charts.
That is where I gain a deeper understanding of what to expect and how prices will react to changing market dynamics.
So, if you like what you see in my Plan Your Trade videos - remember there is much more to do this efficiently than what I'm showing you in these Videos.
Also, remember, a Win is a Win. Book it and call it good.
Get some.
#trading #research #investing #tradingalgos #tradingsignals #cycles #fibonacci #elliotwave #modelingsystems #stocks #bitcoin #btcusd #cryptos #spy #es #nq #gold

SPY/QQQ Plan Your Trade For 10-14 : GapUp-Lower In Counter TrendGood morning,
This video highlights what I expect to happen in the SPY/QQQ, Gold/Silver, and Bitcoin over the next 5 to 7+ days.
Remember, I'm using my proprietary modeling systems, SPY/Gold Cycle Patterns, and other research to share a roadmap of expected price action 5- 7+ days into the future.
I don't know anyone else who can do this research accurately and provide such clear trade/entry/exit signals.
This week should be exciting as we'll see multiple opportunities in the SPY/QQQ and Gold/Silver.
Bitcoin is nearing a Phase #4 (consolidation) trigger near recent highs. At this point, traders need to wait for a breakout of the recent range before getting more aggressive with BTCUSD.
Let's get some this week.
#trading #research #investing #tradingalgos #tradingsignals #cycles #fibonacci #elliotwave #modelingsystems #stocks #bitcoin #btcusd #cryptos #spy #es #nq #gold

MU108.50 above trendline breakout possible
SL 10
111/112/113.50/116/119/123/127 TARGET
Gap fill possible


ADI234 Trendline breakout possible
237/240/244 initial target ,
if sustain above 244 then 260 can test

AAPLTrigger for Calls is over 230.
Levels above are 233, 237.
Trade Idea: 232.5C Oct 25
**Earnings are on Thursday Oct 31.

QQQ Weekly Outlook (SPY) for OCT 14, 2024A week ago, I provided a weekly long-term view of QQQ (link below):
I annotated that by looking at the weekly time frame, we can note that QQQ has been bouncing off the weekly trendline (TL) that started back in JAN 2023.
It has touched and bounced off that trendline 3x so far:
-MARCH 2023
-OCTOBER 2023
-AUGUST 2024
We started OCT 7th week around 487 and closed end of week at 493.36
Based on technical analysis, QQQ is in a triangle pattern with the top trendline starting on JULY 17th and then hitting it again several other times:
-SEPT 26
-OCT 9
-OCT 10
-OCT 11
The bottom trendline starts on AUG 5th and touches again on:
-SEPT 6
-SEPT 9
-SEPT 10
-SEPT 11
Another TL was drawn on SEPT 11 up which price has been respecting:
-OCT 2
-OCT 3
-OCT 4
-OCT 7
-OCT 8
-OCT 11
This has cause price to get tighter and tighter against JULY 17th TOP TL.
In addition, price has been making Higher Lows (HL) and Higher Highs (HH) starting from AUG 5th until current date. The following are the HH/HL:
HL: AUG 5/ SEPT 6 - 11 / OCT 1 - 3
HH: AUG 22 / SEPT 26 / OCT 11
The GAP that was created between JULY 16 - 17 was filled on SEPT 26 causing the market to GAP REJECT and push price down.
Price has once again come back to that gap and closed above it.
GAPS can be used in several ways. One being the initial rejection. As price is back above it again, what was once resistance / supply can now be potentially turned into support / demand. The second method can be the INVERSION of a GAP.
Utilizing my longer thesis from last week along with the new / current data, a bullish sentiment is formed going into this week for the following reason:
-Two bottom TLs have been respected and acted as support
-Higher Lows/Higher Highs are being made
-Price closed above the GAP that that acted initially as resistance and now turned into support (inversion)
-No economic catalyst for bearish scenario 'yet'
-Price had a strong close above the 5 and 8 EMA on the daily time frame.
Price Targets:
PT1: $498.44
PT2: $500
PT3: $501.01
PT4: $503.07
PT5: $503.52
PT6: $505
This is NOT financial advice but my opinion on the market.
NASDAQ:AAPL NASDAQ:AMZN NASDAQ:QQQ NYSE:ES SP:SPX #thestrat SEED_ALEXDRAYM_SHORTINTEREST2:NQ AMEX:SPY SEED_ALEXDRAYM_SHORTINTEREST2:NQ NASDAQ:MSFT NASDAQ:TSLA NASDAQ:NVDA NASDAQ:AMD
SaD

Stock Market | TSLA NVDA AAPL AMZN META GOOG MSFT AnalysisQQQ Forecast
SPY forecast
TSLA NVDA AAPL AMZN META GOOG MSFT Analysis

10/11 Can positive earnings season secure BTC Pumpctober?Overview:
The AMEX:SPY continues its bullish streak, hitting a new all-time high and marking the fourth consecutive day of gains. But what’s fueling all this excitement? Just a few weeks ago, concerns about World War III and a looming recession were dominating the headlines. Now, it seems like the market is brushing off those fears. Pumping the AMEX:SPY means pushing up the stocks that make up the index, which suggests an improvement in their earnings, particularly net margins.
Conveniently, earnings season typically starts in mid-October and runs through late October and early November. This past week, giants like PepsiCo, Delta Air Lines, BlackRock, JPMorgan Chase, and Wells Fargo all reported earnings—and they all beat analysts' expectations. What’s notable about this group is its diversity: from consumer staples like food and beverages to airlines, signaling strong consumer purchasing power, to investment and banking companies, which are more dependent on macroeconomic factors and the Federal Reserve’s decisions. These companies, often beneficiaries of quantitative easing, could be the early indicators of a trend. With such a strong start, we might expect more companies to continue beating estimates, setting the stage for what we’re calling "Pumpctober."
In the coming week, we’ll hear from other banking giants like Bank of America, Citigroup, and Goldman Sachs. Healthcare heavyweights like Johnson & Johnson and UnitedHealth Group are also on the docket, along with Netflix. You can find the full list and earnings calendar here: www.ii.co.uk
So, let’s sum it up: the market is surging, consumer spending seems robust, and on Friday, Jerome Powell reported higher-than-expected CPI and core CPI. It feels like the economy is running hot, but that also means no immediate need for an interest rate cut. What clouds the picture slightly is a higher-than-expected number of jobless claims—258k compared to the expected 230k, and higher than the previous 225k. If unemployment continues to rise, it could impact company earnings by Q1 and Q2 of 2025. For now, though, we’re all in on Pumpctober, with a 90% chance of an interest rate cut in November, up from 82%.
ETF Flow: The big players aren’t buying BINANCE:BTCUSD or BINANCE:ETHUSDT . Retail investors are. BlackRock and Grayscale are still sitting on the sidelines.
BTC TA:
W: Bitcoin is barely holding onto the Bollinger Band MA and remains below the weekly and daily levels of $64 k. It’s also under the 2024 yearly point of control (Volume Profile indicator) level of $63.2k. However, we noticed that the current price is very close to the closing levels of the last two quarterly candles—June and September both closed at $62.6k. Until it breaks below $61.4k, we can’t call it bearish just yet.
D: Thursday’s close below the key $60.5k level appeared to signal a breakout, but BTC quickly retraced, turning that breakdown into a fake-out. If the stock market keeps rallying, some of that liquidity and optimism could spill over into crypto, completing a bullish flag pattern. Saturday is showing some bullish momentum, but we need today’s candle to close above $62.8k to confirm a higher high.
4h: On this time frame, Bitcoin is battling strong resistance at $63k. It’s unlikely we’ll see significant movement on a Saturday, as market makers tend to be less active, but if BTC fails to break out from $63k, it would confirm a bearish trend, and shorting from here could offer a good entry point.
1h: On Friday, we saw 7 consecutive hours of aggressive buying starting at 9 am NYC time, with volume doubling the average and pushing BTC from $61.1k to $63k, a 3.19% jump.
Alts Relative to BTC: What was a lower low for BTC was a higher low for ETH, SOL, NEAR, and BNB, which is a bullish sign. However, none of these alts have established a higher high, which cancels out the bullish sentiment. The best move for now is to avoid taking positions until there’s a major breakout with confirmation.
Bull Case: We could be on the verge of a trend reversal, breaking the bullish flag pattern. Both the US and Chinese economies are about to be flooded with cheaper money, which could flow into speculative assets like crypto.
Bear Case: This is an ideal moment to short BTC if it fails to reclaim resistance and turn it into support. The deadline for confirmation is Sunday evening.
Fear and Greed Index: 43, back to Neutral.
Prediction: All eyes are on Sunday, 9 pm EST and 6 pm PST, when Asian traders will return to their desks. Expect increased volatility as bulls and bears clash.
Mistakes: Both SUI and TAO have continued to pump higher despite lower volumes and volatile price swings of around 15%. If it establishes a higher high, stalls and you short - at least you can trade the range while BTC decides its direction.

SPY/QQQ Plan Your Trade For 10-11 EOD UpdateOverall, this week has been rock solid. Even though the markets moved downward after the US Treasury auction early this week, the recovery and rally on Thursday and Friday were right on schedule.
Remember, I've highlighted my SPY Cycle Patterns more than three weeks into the future before the beginning of October. Mapping Daily price action like this is impossible for almost anyone.
The idea that I can identify price patterns weeks and months in advance and attempt to identify where and when trade opportunities may exist based on these advanced patterns is of real value.
I'm not waiting for price to move in some formation or setup, I know where price will likely base/bottom, or peak/top, and I know where opportunities should exist for profitable trades days or weeks in advance.
Now, you've seen how these patterns work and how I use other advanced TA techniques to identify real opportunities.
What are you waiting for...
Get Some.
#trading #research #investing #tradingalgos #tradingsignals #cycles #fibonacci #elliotwave #modelingsystems #stocks #bitcoin #btcusd #cryptos #spy #es #nq #gold

SPY/QQQ Plan Your Trade For 10-11 : Inside Breakaway PatternHappy Friday.
Today's Inside Breakaway pattern for the SPY should prompt a solid rally attempt - where the SPY/QQQ should rally higher to close out the week. I'm targeting the 580+ level for the SPY over the next 5+ trading days.
Gold and Silver are moving into a Top-Resistance pattern. This suggests Gold and Silver will rally, form a peak, then roll slightly downward today. I'm still targeting the 2670-2680+ level for Gold as a peak today. Silver will lag, but will likely setup a peak near 32.00.
Bitcoin collapsed, then recovered overnight - forming a very large Deep-V base. Now, this recent recovery is setting up as a Bearish Excess Phase Peak pattern and may likely roll into the Downward Flagging phase.
Be aware, this type fo deep low was the result of a Bullish Excess Phase Peak pattern completing the full 5 phases - ultimately reaching the "ultimate low" with the Deep-V bottom.
This current setup in BTCUSD suggests price will attempt to recover as long as the Deep-V low price is not breached.
Volatility is here. Price ranges will continue to be volatile through and after the US elections.
So be aware that news, data, or other items may cause price to react very violently over the next 2+ months.
Get Some.
#trading #research #investing #tradingalgos #tradingsignals #cycles #fibonacci #elliotwave #modelingsystems #stocks #bitcoin #btcusd #cryptos #spy #es #nq #gold

75% gains BUY/HOLD IWM/RUS2K C*H trade setup🔸Hello traders, today let's review 2daily chart for IWM . Entering re-accumulation stage now, expecting range bound trading during next fer months. We've hit heavy overhead resistace / limited upside currently.
🔸The speculative chart pattern is bullish C*H in progress, expect more range locked price action for a few months as we re-accumulate and get ready to clear the ATH. Measured move price projectiong for the C*H structure is 350 USD, 75% upside from the recommended BUY ZONE.
🔸Recommended strategy bulls: wait for IWM to re-accumulate in the sliding
bull flag formation and get ready to BUY/HOLD low near 200 USD, target
based on measured move projection is 350 USD. good luck traders!
🎁Please hit the like button and
🎁Leave a comment to support our team!
RISK DISCLAIMER:
Trading Futures , Forex, CFDs and Stocks involves a risk of loss.
Please consider carefully if such trading is appropriate for you.
Past performance is not indicative of future results.
Always limit your leverage and use tight stop loss.

Semis may be ready to surge.NASDAQ:NVDA has reclaimed most daily supply and may trade into the earnings high if it can reclaim this week's range. NASDAQ:SMH has similarly reclaimed the daily 50 SMA and will go higher upon confirmation of the daily 100 SMA supply. Higher prices in semiconductors, such NASDAQ:AVGO as well, may help NASDAQ:QQQ follow AMEX:SPY to a new all-time high.

SPY/QQQ Plan Your Trade For 10-10 : Carryover in Carryover ModeToday's cycle pattern suggests the SPY/QQQ price action will be very similar to yesterday's price action. I believe the markets are starting to move away from the basing/bottoming phase and moving back into trending phase.
Thus, I believe the SPY & QQQ will begin a rally up to highs reached before October 20-21, then form a top, and toll downward just before the US elections.
Gold needs to find some support and move higher - away from the 2625 price level. It is critical that Gold stay above 2620 at this stage. if Gold falls below 2620 - there is a very strong chance Gold will move into deeper consolidation and fail to rally above the 2750++ level I expect.
BTCUSD has already reached my lower support zone. I do expect Bitcoin to consolidate a bit near this lower price channel, but the next move is to either revert higher, or breakdown even further. Currently, I suggest waiting 20 to 48 hours with Bitcoin to let price settle on a new trend.
Get some.
#trading #research #investing #tradingalgos #tradingsignals #cycles #fibonacci #elliotwave #modelingsystems #stocks #bitcoin #btcusd #cryptos #spy #es #nq #gold

80% gains AMD/NVDA Pairs Trade: Best Level to BUY/HOLD AMD🔸Hello traders, today let's review 4hour price chart for AMD.
Price structure is bullish inverted H*S setup with reload zone bulls
near 150 usd, currently expecting rejection near overhead resistance.
🔸AMD is trailing behind NVDA so far this year, YTD gains of 17%, NVDA
YTD gains at 167%. AMD is trailing behind NVDA massively and expecting
mean reversion / catch up trade later in 2025. AMD market cap sits
at 250 bln USD so it's an easy double from here. Fair value for AMD
is 500 bln USD, NVDA is valued at 3 T right now, which is massive.
🔸Recommended strategy bulls: Bulls wait for rejection from overhead resistance to confirm IHS setup / near 175 usd and wait for pullback/correction into mirror S/R level at 150/155 USD. BUY/HOLD setup, SL fixed at 125 USD TP1 is 250 USD TP2 is 300 USD in 2025. This is a swing trade setup with 80%+ upside potential, naturally more patience required to hit targets.
🎁Please hit the like button and
🎁Leave a comment to support our team!
RISK DISCLAIMER:
Trading Futures , Forex, CFDs and Stocks involves a risk of loss.
Please consider carefully if such trading is appropriate for you.
Past performance is not indicative of future results.
Always limit your leverage and use tight stop loss.

10/9 Good news and bad news...Overview:
Which would you prefer to hear first? Let’s start with the good news: the AMEX:SPY has updated its all-time high. If you have a 401k or any other pension fund, you’re likely seeing gains. Also, it's hard to argue that a recession is looming when the stock market is booming.
Now for the bad news: crypto is down. Normally, this wouldn’t be alarming, as all markets fluctuate. But it's concerning when we see a divergence between the stock market and crypto. Even riskier tech stocks, like those in the NASDAQ:QQQ index, climbed 0.79%. If traders are eager to buy equities, why not crypto, or at least BINANCE:BTCUSD ?
Tomorrow, all eyes will be on Jerome Powell as he delivers the CPI and Core CPI data along with initial jobless claims. Given that recent job reports nearly doubled expectations, we predict fewer jobless claims. The question is: will positive macroeconomic data help? On one hand, it means people have money to spend, which could benefit crypto. On the other hand, it could reduce the chances of aggressive rate cuts, keeping liquidity constrained, and preventing speculative assets from soaring.
BlackRock continues dollar-cost averaging into Bitcoin but hasn’t touched its ETH ETF. When did ETH become so hated?
CME fedwatch tool shows an increase in the probability of no rate cut in November, up to 17.2%, while the chances of a one-base-point cut sit at 82.2%.
BTC TA:
W: BTC needs to close above $61.4k to keep bulls in the game. Unfortunately, after today's drop, BTC fell below this crucial level, breaking the bullish structure it had been building since September 7th. Another important level is $62.7k, the point of control for the entire 2024 bull run, which was rejected yesterday. This week is shaping up to print another red candle, following the previous week.
D: While the weekly levels are invalidated, the daily levels still offer hope. BTC bounced from the $60.6k support level, and we haven’t seen four consecutive red days since August. If tomorrow's CPI data hints at a bullish sentiment, we might see a small rally back to $62.1k.
4h: Price is currently closer to the lowest Bollinger Band, indicating it needs to catch up with its moving average.
1h: BTC has reached the Bollinger Bands' moving average, but for a stronger recovery, it needs to break beyond this level on the 4h chart to confirm a bounce.
Alts Relative to BTC:
TAO, SUI, and APT have reached higher highs, but with lower volumes, suggesting that the bullish trend is losing steam. These gains were likely driven by retail investors, FOMOing into the rally. Meanwhile, FTM is showing bearish MACD divergence on the 4-hour chart and was rejected at its weekly resistance of $0.69.
Bull Case:
At $60k, BTC is relatively cheap, considering how much adoption and recognition crypto has gained in 2024. Since we didn’t experience a massive sell-off in September and have held up into October, this might be your last chance to buy BTC at a sub-$100k price. Additionally, we’re in the Fear territory on the Fear and Greed Index, which historically offers an 83% chance of profitability if bought during this phase.
Bear Case:
From a technical perspective, things look bearish. Many key support levels have been invalidated, and the likelihood of the Fed not cutting rates in November continues to rise.
Fear and Greed Index: 37 (Fear).
Prediction: BTC may rebound to $62.1k before resuming its decline. Expect TAO, SUI, and APT to follow BTC's movements, with a potential drop back to pre-BTC ETF levels, which could see declines of 55-60%.
Opportunities:
Short TAO, SUI, APT, FTM.

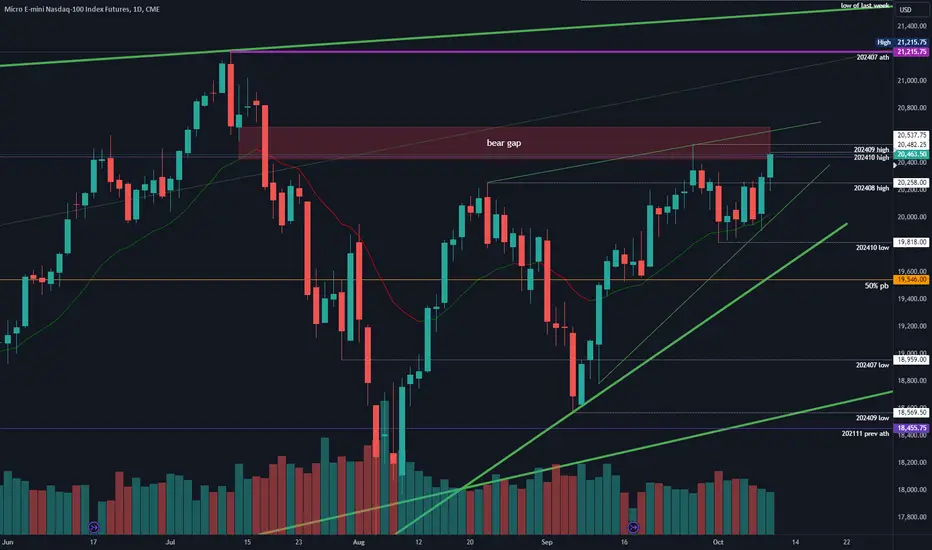
2024-10-09 - priceactiontds - daily update - nasdaqGood evening and I hope you are well.
tl;dr
nasdaq - Same as dax for me. Strong breakout and I do think we will retest 21000. September high is 20537 and there is a possibility, this continues to be resistance ut given the current context, the bulls are favored for higher prices.
comment : Nested bull wedges on the daily chart and the bear gap to 20650 is getting very small. Only resistance left is the September high 20537 and the current breakout looks strong enough to expect higher highs above it and likely a retest of 21000.
current market cycle: Bull trend (nested bull wedges)
key levels: 19800 - 21000
bull case: Bulls prevented the market to close below the daily 20ema for 6 days and today bears gave up. Market refuses to go down and now we will test higher again. Bulls have all the arguments on their side if they stay above 20200. Below their case gets shaky again.
Invalidation is below 20260.
bear case: Bears see the open bear gap to 20650 and the upper bull wedge line around that same price. They will likely try to fight the bulls around that area again but I don’t think they want to risk much at that level. Market refuses to go down and their next best level for good shorts is 21000. If you are looking hard for more bear arguments… Maybe that the current volume is utterly trash and on the 1h tf you have another bull wedge and we are at the high of it. Pullback could go as deep as 20300. Can bears hope for some hot CPI and jobless claims tomorrow? I doubt it but you should not be in positions when the news is released or have really wide stops for your swings.
Invalidation is above 20520.
short term: Max bullish if the pullback stays above 20300. Neutral below.
medium-long term: Very likely a retest of the ath before I expect a correction 10% or more, before another year end rally. Embrace the volatility.
current swing trade : Nope
trade of the day: Long the opening reversal. Was too strong to now long it, no ifs or buts.
SPY/QQQ Plan Your Trade For 10-9 : Breakaway In Counter TrendToday's video goes over why I believe today will be somewhat quiet in terms of trending and expectations. As I suggested in the video, today is a good day to trade with only 20-30% position sizes - or to take a day off and go golfing.
I don't expect any big moves today - even though today's pattern is a Breakaway in Counter-trend mode.
I believe the markets will pause today - seeking support/resistance and trying to establish a range for a bigger move on Thursday/Friday.
I hope you guys are learning how to use the Excess Phase Peak patterns more efficiently. They are not easy to learn - especially now that I'm showing both the Ying & Yang side of these patterns.
They happen everywhere and can be very important when making decisions.
Remember, price only does two things: Trends or Flags.
That's it. There is no other type of price action you have to prepare for.
Get Some.
#trading #research #investing #tradingalgos #tradingsignals #cycles #fibonacci #elliotwave #modelingsystems #stocks #bitcoin #btcusd #cryptos #spy #es #nq #gold

10/8 Market Tensions as S&P500 Wobbles Ahead of CPI, BTC Holds.Overview:
The AMEX:SPY is hovering around its all-time highs, showing limited movement as investors await Thursday’s CPI report. Anticipation is building, but it seems the U.S. market may not make any significant moves until inflation data provides clearer direction.
BTC TA:
W: When examining the volume profile of this year's entire bull phase, the point of control—where the most trading volume occurred—stands at $63 K. This explains why BINANCE:BTCUSDT might consolidate at the current price range for longer than expected. Despite a second false breakout attempt, Bitcoin remains trapped between the crucial monthly support level of $61.4K and resistance at $64 K. On one hand, geopolitical tensions are escalating in the Middle East, while on the other, China's government has announced a $28 billion investment package. The SSE Composite Index surged 30%, though it recently corrected by 11% over the last two days. Notably, some of the significant green candles can be attributed to Asian market open times.
D: The daily chart paints a clear picture of the price struggling to escape bearish pressure. It’s hovering just below the Bollinger Bands’ moving average. Monday presented a bearish hammer, and Tuesday ended with an indecisive doji.
4h: No divergences are evident on the MACD or CVD. The RSI sits around 45, indicating balanced buying and selling pressure.
1h: Price is oscillating around the $62.2K point of control level without any strong signals for bullish or bearish momentum.
Alts relative to BTC: Major altcoins are moving in line with Bitcoin, with little divergence. However, SUI and TAO, after their impressive runs to all-time highs, have begun to correct.
Bull case: If Trump is re-elected, accompanied by more interest rate cuts, this could boost the bullish narrative. The bull flag on the weekly chart is becoming more apparent and, if it breaks out, could signal a further upward trend. The formation of a reverse head and shoulders at the beginning of July, August, and September also supports a bullish outlook.
Bear case: However, bears point out that we’re still in a pattern of lower highs and lower lows. The double fake bull breakouts in recent upticks further signal caution. The market lacks new narratives, and regulatory crackdowns continue. Major CEXs now require strict KYC compliance, cutting off trading access for users in China, the UK, the U.S., and other key markets. While VPNs offer a workaround, the risks of locked accounts on exchanges registered in jurisdictions like the Cayman Islands add significant risk for traders.
Fear and Greed Index: 41.71 - Neutral.

Analyzing BTCUSD Using Excess Phase Peak PatternsI've been getting lots of emails and comments about the Excess Phase Peak patterns I use on my charts.
They are really quite simple to understand once you learn their structure/process.
But, the hardest part of using them is they work as a YING/YANG type of price structure. While the bullish Excess Phase Peak patterns are operating, the other side of price action, the bearish Excess Phase Peak patterns, are also operating in price.
So, you have to be able to see what's in front of you from both sides.
In this example with BTCUSD, I try to highlight both the bullish and bearish Excess Phase Peak patterns for traders to learn to use them more efficiently.
Get some.
#trading #research #investing #tradingalgos #tradingsignals #cycles #fibonacci #elliotwave #modelingsystems #stocks #bitcoin #btcusd #cryptos #spy #es #nq #gold
