Nvidia & Nasdaq History - What you need to know!Record-high share price: NVDA hit a new all-time high as U.S. stock markets rallied and Wall Street analysts forecast continued upside
Nvidia is pushing towards the first ever $4 Trillion market cap.
Today it surpassed MSFT as the largest company in the world closing up over 4% on the session.
Micron earnings are adding extra fuel to the fire for semi conductors.
Short term picture for semis - they're very extended and need some consolidation.
Micron earnings: Revenue: $8.05 billion, up ~38% YoY, beating the ~$7.89 billion consensus
Data‑center revenue: Tripled YoY, powered by surging demand for high‑bandwidth memory (HBM)
HBM sales: Exceeded $1 billion, growing over 50% sequentially
Strong margin and revenue beat; robust cash flow (~$857 million free cash flow) with a solid balance sheet ($9.6 billion in liquidity)
QQQ

Nasdaq All-Time Highs, S&P Close, Blast Off or Breakdown?What an incredible melt-up since April 7 lows in the US markets.
Trump vs Musk - ignored
Iran vs Israel - ignored
High Valuations - ignored
FED Pausing - ignored
The US economy is resilient and it's a good thing because the world is performing really well (EX-US). Europe/China/India/Emerging Markets are outperforming the US by 15-16% YTD
The USD is having one its worst years ever in 2025
Gold, Silver, Bitcoin are great diversifiers in my opinion for 2025
Oil prices are incredibly volatile and energy stocks and commodities in turn are showing
volatility and big swings
As we near end of month and end of Q2, I have to believe the market is due for a small pause or pullback sooner rather than later - but we'll see
Thanks for watching!!!

SPY/QQQ Plan Your Trade for 6-25 : Breakaway PatternToday's Breakaway pattern suggests the SPY/QQQ may attempt to move into another breakaway price move - very similar to yesterday's price move.
I will add that I believe the SPY cycle patterns have already moved through a breakaway phase with the ceasefire news early this week. I believe the gap and breakaway move yesterday may be the breakaway trend we are expecting today.
That would suggest the markets could pause and pullback a bit over the next few days.
Gold and Silver are trying to find a bottom after the brief selling that took place over the past few days. I really do believe Gold and Silver are poised to make a big move higher.
Bitcoin is on a terror to the upside. But be cautious of the downward cycle channel that may prompt a rollover in BTCUSD near the $107,500 level.
I spend a little time near the end of this video highlighting my work on the Tesla 3-6-9 price theory and going over a few examples for my new book on trading.
Enjoy the quick look at some of the more advanced techniques I'm working to unlock for all of you.
Get some.
#trading #research #investing #tradingalgos #tradingsignals #cycles #fibonacci #elliotwave #modelingsystems #stocks #bitcoin #btcusd #cryptos #spy #gold #nq #investing #trading #spytrading #spymarket #tradingmarket #stockmarket #silver

SPY/QQQ Plan Your Trade For 6-24 : Post Market UpdateThis post-market update highlights the weakening volume while my primary proprietary modeling system continues to stay BULLISH.
The markets are really quite interesting right now. Weakening volume in this Gapping uptrend, today, suggests traders are not buying into the ceasefire between Iran and Israel.
Additionally, the move in metals suggests a PANIC phase has setup in the US markets.
This type of panic phase typically leads to selling of assets and moving capital into CASH.
I suggest traders continue to prepare for a moderate melt upward trend over the next few days - but be prepared for any potential breakdown (possibly trying to FILL THE GAP).
This market appears to be running on fumes.
While I believe Trump's policies will lead to a stronger bullish price trend over the next few years, these disruptions and the potential for consumers to pull away from spending/economic activity over the second half of 2025 is still very real.
Buckle up.
At this point, hedge your trades, move some capital into CASH and prepare for bigger price volatility as we move into July 2025.
Get some.
#trading #research #investing #tradingalgos #tradingsignals #cycles #fibonacci #elliotwave #modelingsystems #stocks #bitcoin #btcusd #cryptos #spy #gold #nq #investing #trading #spytrading #spymarket #tradingmarket #stockmarket #silver

Nasdaq Surges on Ceasefire Hopes – New All-Time Highs Ahead?By analyzing the #Nasdaq chart on the weekly timeframe, we can see that the index experienced a strong rally following the ceasefire announcement between Iran and Israel, climbing as high as 22,200 so far. If the ceasefire holds and tensions continue to ease, we could see a new all-time high for the Nasdaq.
Potential bullish targets for this move are 22,400, 23,200, and 24,000.
Please support me with your likes and comments to motivate me to share more analysis with you and share your opinion about the possible trend of this chart with me !
Best Regards , Arman Shaban

MAOR HEAD N SHOULDER TOP FORMATION I AM 100 % SHORT NOW The chart posted is that on the NDX 100 .This is my view of what has formed . best of trades WAVETIMER

SPY/QQQ Plan Your Trade For 6-23 : Afternoon UpdateWhat happened to the CRUSH pattern?
Everyone wants to know why the CRUSH pattern didn't show up today. Well, I keep telling all of you these SPY Cycle Patterns are based on GANN, Tesla and Fibonacci price structures. They do not take into consideration news, global events, or anything outside of PRICE.
They are predictive - meaning they attempt to predict potential price shapes/patterns weeks, months, and years in advance.
The markets, obviously, are seeking some normalcy after the Iran conflict. I thought the CRUSH pattern would have been a perfect fit for today - but obviously the markets didn't agree.
If you have been following my videos, you know I keep saying the US stock market is acting as a global hedge for risks. Traders are pouring capital into the US stock market as a way to avoid global risk factors.
Traders are also pouring capital into Gold/Silver. Demand for physical metals is through the roof right now.
Time will tell if my Excess Phase Peak pattern plays out as I expect or if we rally to new ATHs.
Obviously, this sideways rollover topping pattern could present a breakaway in either direction.
Again, my patterns are not correlated based on news or other events. They are strictly price-based.
Get some...
#trading #research #investing #tradingalgos #tradingsignals #cycles #fibonacci #elliotwave #modelingsystems #stocks #bitcoin #btcusd #cryptos #spy #gold #nq #investing #trading #spytrading #spymarket #tradingmarket #stockmarket #silver

SPY/QQQ Plan Your Trade For 6-23 : CRUSH PatternToday's CRUSH pattern suggests the markets will struggle to find any support for a rally. A CRUSH pattern is usually a large breakdown type of price bar that moves aggressively against the dominant trend.
Som, today I'm expecting some fairly large price action and I believe the markets may start a breakdown move this week as we continue to get more news related to the Israel/Iran/US conflict.
This week will be a "resettling" week in my opinion. Buyers will start to actively liquidate and reposition assets as we move deeper into this conflict. When buyers turn into sellers (to get out), the markets usually react very aggressively in trend.
Metals continue to hold up without making any big moves. I believe the increased FEAR level could play out as a moderate rally for metals over the next 15-30+ days.
BTCUSD broke down very hard (more than 6%) over the past 3-4+ days. This is a big move downward for Bitcoin and could suggest US technology stocks/sectors could also collapse on fear of a "rollover top" in the US stock market.
Smart traders will hedge and pull capital away from this potential top - just like I've been suggesting for the past 2-3+ weeks.
Oddly enough, if we do get a rollover/top this week because of the Iran conflict, it plays right into my Excess Phase Peak pattern and the predictions I've been making over the past 4+ months.
No, I don't foresee events like this Israel/US/Iran conflict. I can't see into the future.
What I can do, and continue to try to deliver, is the best analysis I can offer without becoming BIASED by indicators, comments, or other inputs.
I just read the chart and will tell you what I see as the most likely outcome.
Get some..
#trading #research #investing #tradingalgos #tradingsignals #cycles #fibonacci #elliotwave #modelingsystems #stocks #bitcoin #btcusd #cryptos #spy #gold #nq #investing #trading #spytrading #spymarket #tradingmarket #stockmarket #silver

Stock Market Forecast | TSLA NVDA AAPL AMZN META MSFTStock Market Forecast | !nq1! !es1! SPY QQQ
Mag 7 Forecast | NASDAQ:TSLA NASDAQ:NVDA AAPL AMZN META MSFT GOOG


TESLA PRICE ACTION 20JUNE 2025This is the price action of Tesla . I have discussed everything deeply and if you have any doubts then feel free to message or leave a comment.
I am bullish on Tesla.
NOTE:DO NOT SHORT TESLA

MAJOR TOP IS NOW IN PLACE 5th wave up from 4835 has ended 6059The chart posted is that of the sp 500 and I now have counted 5 waves up as ending based on this wave structure I will look for two things to happen a rather deep ABC if there is a bull market intact and it should decline in 3 waves back to .236/382 area from 6059 - 4835 The 4th wave or A low This MUST HOLD at .382 or The cycle has ended the 5 wave sup from march 23 low 2020 I sold longs this morning based on NAAII exposure and Now have moved to a 100 % long VERY DEEP IN THE MONEY PUTS 2027 Best of trades The WAVETIMER

SPY/QQQ Plan Your Trade For 6-20 : Pause Bar PatternToday's Pause Bar pattern suggests the SPY/QQQ will slide into a sideways type of PAUSE in price action today. I'm not expecting much to happen and if we do see any breakaway or breakdown trending it will likely be related to news.
While we have options expiration today and a host of other things that could drive the markets, I believe the markets are struggling to find direction right now. Thus, a pause in trading would be somewhat normal after a holiday-shortened trading week.
Gold and Silver are struggling after a brief rally last week. I believe this is fear related to the Israel/Iran conflict. Metals should continue to move higher.
BTCUSD is slightly higher (forgot to cover BTCUSD in the video), but not moving into a breakaway phase.
Overall, everything is very flat in early trading today. It may stay that way with my PAUSE BAR pattern.
Get some.
#trading #research #investing #tradingalgos #tradingsignals #cycles #fibonacci #elliotwave #modelingsystems #stocks #bitcoin #btcusd #cryptos #spy #gold #nq #investing #trading #spytrading #spymarket #tradingmarket #stockmarket #silver

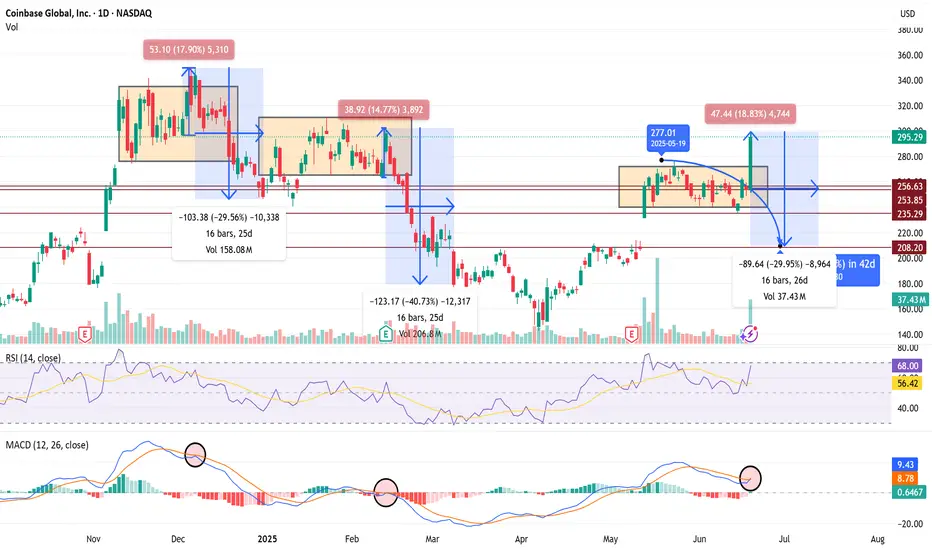
$COIN 30% Pullback Confirms if we Fakeout Recent 15%+ Rally 🧨 COIN SHORT TRADE IDEA — FAKEOUT TRAP IN PLAY
Ticker: NASDAQ:COIN
Date: June 20, 2025
Thesis: Breakout trap setup — expecting a rug pull / red reversal tomorrow to confirm.
🔍 Context
Price broke above range today with a big +18.8% candle to $295 — but...
Volume spike may signal exhaustion, not strength.
RSI = 68 → near overbought
MACD curling into a bearish cross — same signal preceded the last -30% and -40% drawdowns.
History: Same range-break setups in Dec and Feb collapsed hard (-30 to -40%) over 16–25 days.
💣 Trade Plan (Short Setup)
Entry Trigger:
🔻 Enter short if price closes below $277 tomorrow — confirms breakout trap.
Targets:
🎯 Target 1: $253 (top of old range)
🎯 Target 2: $235 (mid-range support)
🎯 Target 3: $208 (full breakdown move, matches last 2 cycles)
Stop Loss:
🛑 Above $297 (breakout highs)
Timeframe:
1–3 weeks (16–26 bars historically)
🧠 Bias
Bearish unless bulls hold $280+. If we get a big red daily candle tomorrow, fakeout confirmed — high-probability follow-through expected.
SPY/QQQ Plan Your Trade For 6-19: GAP Reversal Counter TrendToday's pattern is a GAP Reversal in Counter Trend mode. I believe this could represent a breakdown in the ES/NQ as the US stock market is closed for the Juneteenth holiday.
Obviously, after the Fed comments yesterday (stating "uncertainty") and with the continued Israel/Iran conflict playing out, it makes sense to me that the US markets would move into a pre-weekend consolidation phase.
Even though the US stock market will be closed, the futures market will likely stay open and will carry some general market sentiment and reactions to news.
Watching Gold/Silver and Bitcoin should be very interesting today. I suspect the markets will continue to consolidate downward today - leading to a potential breakdown seeking support day on Friday.
Buckle up. We'll likely have 3-5+ days of news related to the Israel/Iran conflict and other issues over this weekend. It could be very interesting to see how the global markets move through this news.
Get some.
Happy Juneteenth
#trading #research #investing #tradingalgos #tradingsignals #cycles #fibonacci #elliotwave #modelingsystems #stocks #bitcoin #btcusd #cryptos #spy #gold #nq #investing #trading #spytrading #spymarket #tradingmarket #stockmarket #silver

$FTNT In a Wedging PatternI bought a ½ size position on June 2nd after it had tremendous volume and institutions protected it from slipping below the 50 DMA the day before. It has been nothing but sideways since and I am slightly underwater. My stop is a decisive close under the 50 DMA. I did not feel the Wed June 18th qualified as decisive.
Mark Minervini may call this a VCP (Volatility Contraction Pattern). In any event it is clearly in consolidation mode and could break either way. I will either be selling if it does not recover the 50 DMA or will be adding if / when it closes above the downward sloping upper trendline.
I thought this would be a good one for your watchlist. If you like the idea, please make it your own and follow “your” trading rules. Remember, it is your money at risk.

PUT CALL GAVE A BUY SIGNAL TODAY I am looking for 6177/6183 The put/call model has given a buy signal that gives me a New record highsp500 and qqq how it has formed I am long calls at 50 % and 75 short OIL today best of trades WAVETIMER

SPY/QQQ Plan Your Trade For 6-18 : GAP Potential PatternToday's GAP Potential pattern suggests the SPY/QQQ may GAP a bit higher at the open, then move into a melt-up phase, trying to identify resistance, then roll into a topping pattern and move downward.
I believe the recent "rollover" of the markets (initiating last Friday with the Israel/Iran conflict) is still dominating the markets and news related to the ongoing conflict could drive a moderate pullback in US assets.
Headed into the Juneteenth holiday (Thursday, June 19), I suggest traders prepare for the US markets to move into somewhat of a SETTLEMENT mode today - where traders don't want to hold too many open positions into Friday's trading.
Additionally, Gold and Silver could move into a very strong upward price move over the next 4-5+ days. So be prepared for metals to hedge risks when the US stock market is closed.
BTCUSD seems to be struggling into the FLAG APEX. I'm waiting to see if my FLAG count is correct and if we get the breakdown in BTCUSD as I expect.
Get some.
#trading #research #investing #tradingalgos #tradingsignals #cycles #fibonacci #elliotwave #modelingsystems #stocks #bitcoin #btcusd #cryptos #spy #gold #nq #investing #trading #spytrading #spymarket #tradingmarket #stockmarket #silver

$TLT Rising Channel or Bear Flag?Is it time to invest in NASDAQ:TLT ? It looks positive to me. With inflation cooling down it looks like bond prices could increase, which means rates are lower. We do have a Fed Meeting coming up so there could be more volatility depending on the “Feds” messaging.
I am taking this long today with a ½ size position. I will place my stop just “below” yesterdays low of $85.46. I am going long because I see a series of higher lows and higher highs. And I have a well-defined risk level of about 1% to know if I am wrong.
If you like this idea, please make it your own. Make sure you follow your trading plan.

SPY/QQQ Plan Your Trade for 6-17: Top Resistance PatternToday's pattern suggests the SPY/QQQ will move into a type of topping pattern, attempting to identify resistance, then roll away from that resistance level and trend downward.
I suggest the news related to the conflict between Israel & Iran may continue to drive market trends with traders moving away from uncertainty near these recent highs.
Silver makes a big move higher. Gold will likely follow later this week or early next week.
BTCUSD moves into a sideways FLAGGING pattern - possibly attempting a BIG BREAKDOWN event over the next few weeks.
Overall, the markets look like they are poised for a very big move - just waiting for the GREEN LINK (GO).
Stay safe. Protect capital and HEDGE.
Get some.
#trading #research #investing #tradingalgos #tradingsignals #cycles #fibonacci #elliotwave #modelingsystems #stocks #bitcoin #btcusd #cryptos #spy #gold #nq #investing #trading #spytrading #spymarket #tradingmarket #stockmarket #silver

QQQ - NASDAQ Has Never Been This ExpensiveQQQ relative to the money supply reveals that markets have never been this expensive in history. Despite the significant amount of money pumped in during the COVID-19 pandemic, the economy has not kept pace with all the zeros added to Gov debt.
If we can't lower deficits now at max employment, when will we?
Tulips!
Caution is in order despite what "experts" may tell you.
Click like Follow Subscribe, let's get to 5,000 followers.

QQQ On The Rise! BUY!
My dear friends,
My technical analysis for QQQ is below:
The market is trading on 526.92 pivot level.
Bias - Bullish
Technical Indicators: Both Super Trend & Pivot HL indicate a highly probable Bullish continuation.
Target - 530.98
About Used Indicators:
A pivot point is a technical analysis indicator, or calculations, used to determine the overall trend of the market over different time frames.
Disclosure: I am part of Trade Nation's Influencer program and receive a monthly fee for using their TradingView charts in my analysis.
———————————
WISH YOU ALL LUCK
