Stock Market | TSLA NVDA AAPL AMZN META GOOG MSFT AnalysisQQQ Forecast
Sp500 ETF analysis
Nvidia Stock NVDA Forecast Technical Analysis
Apple Stock AAPL Forecast Technical Analysis
Microsoft Stock MSFT Forecast Technical Analysis
Google Stock GOOGL Forecast Technical Analysis
Amazon Stock AMZN Forecast Technical Analysis
Meta Forecast Technical Analysis
Tesla Stock TSLA Forecast Technical Analysis
QQQ

QQQ gives more strength to its bullish turn aroundToday QQQ started with another gap up breakout for the 2cd day in a row. Stock retraced then rallied again in the late day.
Stock gapped up again doing another breakout weakening the week long sell off trend.
Retracement that was expected sold off less and at slower pass than the day before
Late day smart money jumped in and pushed the stock to higher highs
Volume experienced a massive spike in last moments of trading which can be indication of price exhaustion. This should cause a temporary pull back next trading day
Overall the bull thesis for QQQ is getting stronger each day.

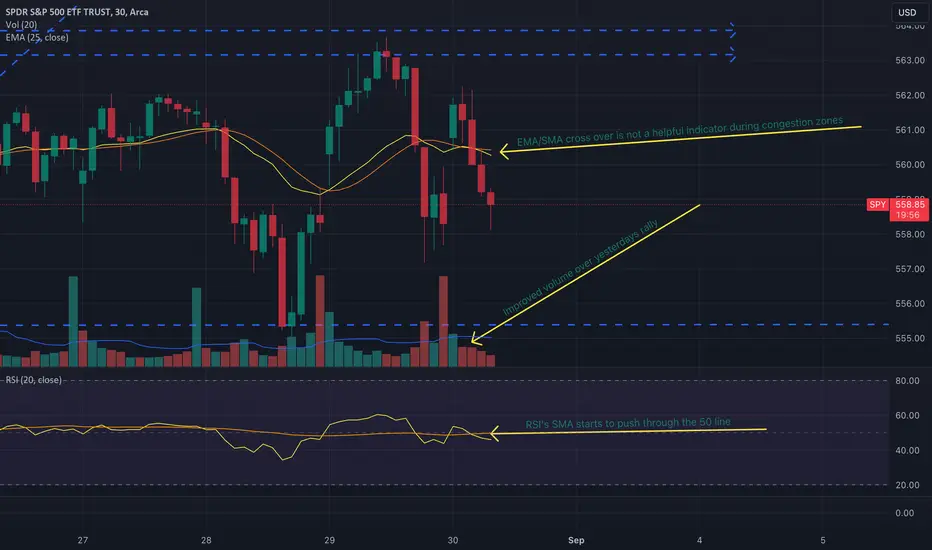
SPY shows more interest in rallying than beforeSPY is starting to show more signs that a breakout above the flat trading its in is coming
We see increased volume over peaks of previous rallies indicating agreement with pushing up prices
RSI's SMA starts to break through the 50 line
comparing to the QQQ, its experiences another false breakout above for the second day in a row. Showing the tech sector is attempting to turn around to the upside
SPY continues to still trade flat but show more confidence in its small rallies than previously
QQQ looks to break into bullish territoryQQQ again breaks out above the longer resistance line to test new more bullish grounds
For the second day in a row QQQ breaks above the long term downward resistance line
This breakout is accompanied with increased volume over yesterday while trading in the higher zone
RSI breaks above SMA during this time
RSI's SMA been flat to trending slightly updward
The bulls are looking to be taking over in the near future showing further weakness in this sell off.

US Markets Cleared For A 13% to 24% Rally - Get SomeThis video highlights why I believe the US markets are ready to make a big move higher over the next 12 to 24+ months.
Many people suggest the markets will crack or crash, or we will experience some black/grey swan event. I'm afraid I have to disagree with this belief.
Yes, there is always a chance we will see some market event. However, to disrupt the US/global economy, there would have to be some event that disrupts the world, not just one or two smaller countries.
I do believe the US is making a broad transition into the 21st century, and new leadership (Govt) is required to make that happen.
But I also believe the seeds have been planted for exponential growth over the next 10-20+ years - and many traders are too focused on the crash dummies to see the real potential.
Watch this video. Share your comments if you like.
I believe we will see pullbacks and rotations on the way up - but I don't think we'll see any big crash event until after 2031 (or later).
Get some. This is going to be BIG.
#trading #research #investing #tradingalgos #tradingsignals #cycles #fibonacci #elliotwave #modelingsystems #stocks #bitcoin #btcusd #cryptos #spy #es #nq #gold

SPY/QQQ Plan Your Trade For 8-30 : Carryover In Counter TrendToday's SPY Cycle Pattern suggests the SPY will attempt to trend moderately strongly to the upside (if my research is correct).
The counter-trend mode of the carryover pattern suggests the price trend will be opposite of the last 2-3 bars - so a potential upward price trend today.
The carryover pattern suggests that price will behave very similarly to what we've seen over the past 2-3 days—moderately trending.
So, I expect the SPY to attempt to rally the 563-564 level and hold above recent lows.
The QQQ should be similar—attempting to break away from the downward price channel, then consolidating into early/mid-next week before attempting to move higher again.
Gold is within my breakout range (over the next 2~5 days), and I believe the 2564 level needs to be broken (upward) for the 2593 level to become the next target. We are still seeing active support near 2511.
Bitcoin should move back to the upside, trying to target the $62.8k level over the next 5+ days. The Flag formation in BTCUSD is holding up well.
Happy Friday everyone.
Let's make today a great day and prepare for next week.
Get some.
#trading #research #investing #tradingalgos #tradingsignals #cycles #fibonacci #elliotwave #modelingsystems #stocks #bitcoin #btcusd #cryptos #spy #es #nq #gold

QQQ shows a reversal is nearQQQ experienced a number of turning points showing increased weakness in the sell off we have been seeing over the past week.
False breakout to the upside
Strong growth in volume confirming the breakout direction
Hammer candle on close indicating reversal maybe coming after later day retracement
RSI breaks above SMA line for first time
This change in direction we have seen today with a new interest from the bulls shows that ever selling we experience going forward will likely be tested by the bulls again.
For trend traders I would recommend sitting on the side lines until we see a stronger trend form either to the up or down side. This current down trend is showing weakness.

How I used Volume Spread Analysis to avoid FOMO trading!As a trader, I often battle with the fear of missing out (FOMO), a common pitfall among traders that can lead to impulsive, unprofitable trades. After reviewing my journal, I determined that chasing breakouts was costing me a significant portion of my account, so I studied Volume Spread Analysis (VSA) to help me reduce my urges. Here is how is used VSA to avoid FOMOing a trade.
Before we get started, let's clarify two definitions:
Volume: Measures the number of times buyers and sellers exchange 1 unit of an asset at an agreed-upon price. It doesn't inherently indicate whether a trend is bullish or bearish, but rather that a trade has occurred. Low volume suggests that few transactions have taken place because buyers and sellers couldn't agree on price. High volume suggests that buyers OR sellers felt they were getting a bargain at the current price, leading to many transactions.
Spread/Range: The difference between the high and low of a candlestick. A narrow spread indicates little variance between what someone is willing to buy for and what someone is willing to sell for. A wide spread suggests that buyers and sellers have significantly different ideas of what the fair price is.
In short, Volume Spread Analysis (VSA) interprets the relationship between trading volume and candle spread. When volume and spread agree, they are considered harmonious, and the trend will probably continue. If volume and spread disagree, there is a divergence, and the trend may be weak or could even reverse. In general, there are three main harmonious conditions:
Narrowing spread should have narrowing volume.
Average spread should have average volume.
Widening spread should have widening volume.
I spotted a bear flag consolidation on QQQ and decided I would trade the breakout to the downside. I took a break and came back to the chart just after the breakdown had occurred, missing my ideal entry. The candle spread was widening and my first thought was "I have to get in! This thing is free falling!" PAUSE! I reminded myself that I cant make every dollar in the market. If I miss this trade, there will always be another. "Be patient and wait for the market to come back to you."
This is the chart after the initial break. What can we observe? QQQ broke the low of day with high volume and a widening red candle. Based on our definitions from earlier, we know that high volume means that buyers or sellers think they are getting a bargain so they are willing to transact as much as they can at current price. Given that price is falling, we can assume that the volume is due to aggressive selling. We remain patient and continue to watch for something to trade against.
Next, we see a narrower range candle with a long lower shadow and above average volume. By definition, strong volume with a narrow range is a possible divergence. We know that narrow range candles mean that buyers and sellers generally agree on current price, but why would it close near the highs if the selling was so aggressive? Given that there is a long lower shadow and then a bullish candle close, we can infer that sellers were not willing to sell below $467.89. The buyers absorbed the selling at those prices.
Fast forwarding, we notice that the volume and candle size has shrunk back to the average meaning buyers and sellers are in agreeance. The number of people willing to transact is decreasing. We also notice that a small range has formed. Buyers have not stepped in to buy above the previous low of day at $469.35 and the sellers have shown no effort to get back below $467.89. Now we have something to trade against instead of FOMOing in! We will look for a break of this range with increased volume.
On the next candle we see bulls break out of the range with aggressive volume and a wide spread candle. Something of note is that the volume on this bull candle is less that the volume of our initial sell candle. If those sellers were still present, wouldn't they be selling at these higher prices and forcing the candle range to be narrow? This shows us that bulls are now in control and the selling from earlier was just a hoax.
As we can see, the rest is history. If I FOMOed into the short as I had planned, this trade would have resulted in a loss. Being patient allowed me to realize that there was nothing to miss out on and actually allowed me to find a better trade.
Key Notes
Always journal your trades and review them
Never FOMO into a trade. Be patient and wait for the trade to come to you!
You dont need to take every trade to make money in the market. It is okay to miss a trade if it means protecting your account.
Volume spread analysis is not 100%, but it can be useful in determining the strength of a trend.

SPY/QQQ Plan Your Trade For 8-29 - Breakaway in Carryover ModeToday's pattern should play out as a reversion to yesterday's selling pressure.
I did not expect to see the markets sell downward as hard as they did yesterday, but my systems were able to catch the downward trend well.
As a trader and a researcher, I try to base my expectations on what I believe to be the highest probable outcome. Yet, sometimes I'm wrong.
I've mentioned this before, and I'll probably say it again and again...
Traders must be capable of adapting to the charts. Play what is in front of you. My SPY Cycle Patterns offer assistance in what may happen based on Fibonacci/Gann price characteristics. Yet, news items (or positioning ahead of NVDA earnings) can drive market trends in unique directions.
We must understand that big news events/earnings/data can alter price trends away from the SPY Cycle Pattern triggers, and we have to be able to play the chart in front of us.
So we adapt to what the chart is telling us - always.
Remember, Fibonacci Price Theory was very clear yesterday after the first breakdown in price - this trend is BEARISH.
Watch this video. Gold is getting ready to make a move up to 2593+ and Silver wants to follow up to about $31. But Silver will lag Gold a bit - so position yourself correctly.
Bitcoin will stay range-bound over the next 5-7+ trading days - trying to run out time on the Flag Apex. Then, it should make a bigger move to the upside.
Get some.
#trading #research #investing #tradingalgos #tradingsignals #cycles #fibonacci #elliotwave #modelingsystems #stocks #bitcoin #btcusd #cryptos #spy #es #nq #gold

QQQ showing more selling to comeQQQ throws signals that bears are still firmly in control and the downward trend should continue
QQQ tests major resistance line, fails to breakthrough
During recovery in late day trading volume steadily decreases showing disagreement in recovery
After hours shows a significant sell off which has recovered some since.
RSI falls in step with price showing no signs of reversal coming
Next major support line is around 463
Today marked the first day of strong downward trading breaking through support and holding. We are looking at more selling to come

Aug 27Overview:
The FRED:SP500 gave us another red candle on Thursday, erasing Wednesday's gains. It has been accumulating in this zone for a week, unfortunately drawing a longer lower wick. The effects of the September sell-off are starting to become more evident. NASDAQ:QQQ confirms our concerns, as its recent high failed to reach the previous high and is now curving downward, closing outside the accumulation zone.
Not much has changed since yesterday’s correction; we're back in the familiar 58.4k-60k range. Bulls are now trapped and licking their wounds, while U.S. tech stocks begin to slip lower. For the second day in a row, selling volume from ETFs suggests that the public might be unloading positions after the bull trap.
W: This week’s candle cancels out the previous week's run to 64k, aiming to close below the BB MA. However, there's nothing particularly noteworthy on the weekly time frame, as we still have four more trading days. Closing below 58.4k would be a bear's dream, while bulls would be content with staying in the current range, waiting for the rate cut and hoping for a pump. As we approach the 58.4k level, it transitions from a daily (D) level into a weekly (W) level, with bulls determined to keep it above that mark.
D: Back to trading in the old daily range.
4h: Significant volatility occurred after re-entering the daily range. The next move, whether up or down, is likely to be substantial. This is a key area to analyze and make decisions. Before heading down, it might need to rally to 60.2k to offset the previous crash. If you want to join the bears, set your stop-limit order at 57.8k (1% below the 58.4k daily level), with a take profit target at the 55.9k weekly level. This strategy could yield a 3.29% return on a non-leveraged, pure spot BTC trade. Alternatively, for the more adventurous, consider leveraging a major Solana meme coin and applying the same strategy.
1h: Nothing significant is happening on the 1-hour chart.
Alts relative to BTC: No divergence observed.
Bull case: Same as yesterday.
Bear case: Same as yesterday. Bulls are hurting after the trap, and QQQ is curving down.
Fear and Greed Index: 45.88. The downward acceleration has stopped, but the index remains in neutral territory.
Prediction: Small correction upward, followed by a continued decline.
Opportunities at W and 4h divergences of major alts:
BINANCE:SUIUSD shows a MACD divergence on the daily chart.
As for other assets, a clearer picture will emerge tomorrow.

NVDA TSLA QQQ AAPL AMZN META GOOG MSFT AnalysisQQQ Forecast
Sp500 ETF analysis
Nvidia Stock NVDA Forecast Technical Analysis
Apple Stock AAPL Forecast Technical Analysis
Microsoft Stock MSFT Forecast Technical Analysis
Google Stock GOOGL Forecast Technical Analysis
Amazon Stock AMZN Forecast Technical Analysis
Meta Forecast Technical Analysis
Tesla Stock TSLA Forecast Technical Analysis

QQQ sold off today and plummeted in after hoursQQQ started to finally show selling with momentum for first day in nearly a week of slowly selling.
It looks as though distribution phase has passed and selling with momentum has begun.
After hours etf continues to slide dramatically
Bulls have lost with bears firmly in control at the moment
The after hours sell we are experiencing now could possibly cause it to gap down on open then get filled in the morning before selling continues.

2024-08-28 - priceactiontds - daily update - nasdaqGood Evening and I hope you are well.
tl;dr
Indexes - Some decent selling today but tis just a dent compared to the bull rally from the previous 3 weeks. Nvidia numbers were in line but the buyback should have been good enough for more euphoria and instead nasdaq puked for 200 points. I do think bears are favored tomorrow but will need follow through below 19200 on nasdaq.
nasdaq e-mini futures
comment: Market continues inside the bull flag and the longer it goes on the more neutral market becomes. Nvidia numbers were in line but market puked 200 points, despite the 50b buyback. Since it recovered most of it as of now, I think we have to wait for tomorrow’s US session for a clear direction but I do think bears chances are very good that we have seen the lower high at 20025 and we go lower from here. I want confirmation below 19200 tomorrow. If bulls can get above 19500 again, they are favored for 19600 or higher again.
current market cycle: Bull flag inside the bigger trading range
key levels: 19000 - 20000
bull case : Bulls want a new ath but Nvidia earnings did not help their case. Still a bull flag after the insane reversal. I wait for tomorrow’s price action. Bulls need to get above 19500 for more upside.
Invalidation is below 19000.
bear case: Bears hope for armageddon. They need to keep this below 19500 to keep their chances of more downside decent. Getting short between 19350 - 19500 is risky but can work. Validation for more downside is a 1h close below 19200. If bears manage that, we could have a bloody day tomorrow.
Invalidation is above 19500.
short term: Neutral.
medium-long term: This climactic blow off top is/was the grand finale of this bull trend. Perfect break above multiple patterns which I expect is a bull trap and we will test the various support lines next before the new bear trend will unfold over the next 3-9 months. —unchanged since 2024-06
current swing trade: Nope.
trade of the day: Selling the open was pretty decent I guess. There was no reason to exit until we hit 19400 and after that, market just went sideways.

SPY/QQQ Plan Your Trade 8-27 - Inside Breakaway PatternThe SPY continues to slide into a sideways melt-up type of trend. Today's Inside Breakaway pattern suggests the SPY will attempt to move away from this consolidation range.
Although I don't expect a huge breakaway today, I do expect the SPY to attempt to move up into the 563+ area, setting up for a bigger move on Thursday and a pullback on Friday.
Gold is pulling back reasonably hard. The 2530-2535 level would be an excellent area to consider buying or adding to any open position. The 2510-2515 level is the Make-Or-Break level for Gold (that would also be our stop level).
I still believe Gold will make another move higher - but I don't think Gold will build enough momentum to rally out of the current range until next week.
Bitcoin has pulled back into the APEX range (see the chart). We need to see it hold up near this Apex range - or it could risk falling below $57k again.
Overall, I see all of these charts (SPY/QQQ/Gold/Bitcoin) stalling and attempting to base ahead of next week. Next week, I believe prices will be more volatile and try to trend upward.
As I've been warning, this week, the markets needed to pause a bit. Now is the perfect time to position yourself for the next big move.
Get some.
#trading #research #investing #tradingalgos #tradingsignals #cycles #fibonacci #elliotwave #modelingsystems #stocks #bitcoin #btcusd #cryptos #spy #es #nq #gold

QQQ has day of consolidation testing resistanceQQQ increased slightly testing outer boundary of resistance line.
The day ended with a doji candle showing indecision in the direction
RSI remains slightly below SMA
EMA remains slightly below SMA
Stock breaks normal resistance to outer boundary during consolidation
Tomorrow will be important day defining the new direction. I anticipate tomorrow being a down day, but it may go in the other direction
