$META Short Swing - Fractal Repeat Play - Sub $600 Target@everyone 🔻 META Short Swing – Fractal Repeat Play 🔁
Entry Trigger: Week of June 10, 2025
Ticker: NASDAQ:META
Current Price: $697.71
Target Price: $593.66
Estimated Duration: ~3–4 weeks
Conviction: ★★★★★
🧠 Thesis:
This is a nearly perfect fractal repeat of META’s July 2024 top:
Identical weekly candle structure: topping wick into fib + supply zone
Weekly gap fill target lines up exactly again — same 15.5% drop
Wick gap fill = $593.66 (same confluence from 2024)
Bearish fib roadmap from 0.786 → 0.618 → 0.382
Volume and momentum exhausted on the run into $702
📉 Trade Plan:
Entry Range: $690–702 rejection zone
Stop Loss: Weekly close above $705
Primary Target: $593.66
This level completes the wick gap fill and matches 2024’s exact structure
Secondary Target (optional): $580.84 (full fib gap + demand retest)
🛠️ Options to Consider:
6/28 $650P or $640P – standard swing
7/5 $620P – for deeper move toward 0.382 and beyond
🔍 Setup Snapshot:
July 2024: -15.56% in 28 days
June 2025: Targeting -15.53% in 28 days
Same gap, same wick rejection, same fade roadmap
QQQ

#202523 - priceactiontds - weekly update - nasdaq e-mini futuresGood Day and I hope you are well.
comment: Same as last week, markets are all very similar. Nq is also in a wedge right under the big round number. I doubt bears can prevent the bulls from printing 22000 but bulls have certainly tried long enough now. Either they get it next week, or it won’t happen for couple of weeks/months.
current market cycle: trading range on the weekly tf, bull wedge on the daily tf
key levels for next week: 20700 - 22000
bull case: Can bulls find enough buyers above 21900 next week to push for 22000 or even a new ath above 22656? Right now bulls are still favored for everything but that does not mean buying above 21500 is a good trade. If you were to buy right now at 21789, your stop has to be 21720 or better 21655. You would be buying at the very top of an ascending triangle we have been in since Thursday. It’s certainly not a good short but I wouldn’t buy it either.
Invalidation is below 21300
bear case: Bears need to close the gap down to 21300 and then we can talk about the highs being in, maybe. For now they fail at making lower lows and letting the bulls make higher highs. They are selling new highs but market is still grinding higher. For couple of weeks now I have been writing that for bears to change the character of the market, they would need a strong gap down or sell spike and leave an open gap. I do think it’s not bad by the bears that we have still not printed 22000, which everyone expected on Thursday but instead bulls had to give up again and we sold for 700 points. Long story short, bears have nothing and no one would be surprised if we print 23000 next week.
Invalidation is above 22100
short term: Neutral around 21800. Longs closer to the wedge trend line 21600 are likely decent. I expect at least 22000 to get hit before we could maybe turn. Most insane thing would be to see a giant melt-up next week and continuing for 23000 over the next 2-3 weeks. Certainly much higher possibility of that happening than a weekly close below 21000.
medium-long term - Update from 2024-06-07: Market is refusing to go down but I can not see this going much more up. Maybe we hit 22000 maybe we don’t. My assumption is still that latest around mid/end of July we begin to decline over the summer.

QQQ: Expecting Bearish Continuation! Here is Why:
Looking at the chart of QQQ right now we are seeing some interesting price action on the lower timeframes. Thus a local move down seems to be quite likely.
Disclosure: I am part of Trade Nation's Influencer program and receive a monthly fee for using their TradingView charts in my analysis.
❤️ Please, support our work with like & comment! ❤️

Stock Market Forecast | TSLA NVDA AAPL AMZN META MSFTStock Market Forecast | CME_MINI:NQ1! CME_MINI:ES1! QQQ AMEX:SPY
Mag 7 Forecast | NASDAQ:TSLA NASDAQ:NVDA AAPL AMZN META MSFT GOOG

QQQ Will Collapse! SELL!
My dear friends,
QQQ looks like it will make a good move, and here are the details:
The market is trading on 529.85 pivot level.
Bias - Bearish
Technical Indicators: Supper Trend generates a clear short signal while Pivot Point HL is currently determining the overall Bearish trend of the market.
Goal - 521.53
About Used Indicators:
Pivot points are a great way to identify areas of support and resistance, but they work best when combined with other kinds of technical analysis
Disclosure: I am part of Trade Nation's Influencer program and receive a monthly fee for using their TradingView charts in my analysis.
———————————
WISH YOU ALL LUCK

SPY/QQQ Plan Your Trade For 6-6 : Inside-Breakaway Counter-TrendToday's pattern suggests the markets may attempt a Counter-trend type of Inside Breakaway pattern.
I read this as a downward price trend (counter to the current upward price trend).
The markets seem to have bounced overnight - prompting a potentially strong opening price level.
If my Inside-Breakaway shows up today, things could get very interesting if a breakdown in price sets up.
Many of you know I've been expecting a broader market breakdown to take place - sending the SPY/QQQ down about 7% to 13% or more.
It hasn't happened yet and the SPY/QQQ continue to try to push a bit higher - but, until we break to new highs, the breakdown event is still possible.
Let's see how things play out today. Platinum is showing that the global markets are entering an extreme speculative phase (very similar to 2000-2008). Transports are stalling, showing the US economy is expected to weaken over the next 3+ months.
Imagine that. Speculation is ramping up while the US market may move into a recession in H2:2025. Wow.
We certainly live in interesting times.
Get some.
#trading #research #investing #tradingalgos #tradingsignals #cycles #fibonacci #elliotwave #modelingsystems #stocks #bitcoin #btcusd #cryptos #spy #gold #nq #investing #trading #spytrading #spymarket #tradingmarket #stockmarket #silver

Elon Musk vs Trump: Who you betting on?Elon Musk and Donald Trump have recently had a public falling-out, with their feud playing out on social media and in political circles.
The dispute seems to have started over Trump's new budget bill, which Musk has criticized for increasing the national debt. Trump, in turn, accused Musk of being upset because the bill removes electric vehicle subsidies that benefit Tesla.
The tension escalated when Trump suggested that Musk had known about the bill beforehand and had no issue with it until after leaving his government role. Musk denied this, claiming he was never shown the bill and that it was passed too quickly for proper review. Trump then took things further by threatening to cut Musk’s government contracts and subsidies, which amount to billions of dollars. Musk responded defiantly on social media, calling Trump "ungrateful" and claiming that without his financial support, Trump would have lost the election.
TSLA violated key levels and will be looking for a sharp technical bounce off the $260-$257 zone


QQQ new lows incoming?QQQ has been consolidating in a massive rising wedge and looks set to break down from it.
Unless price can get back above previous highs, then new lows is the most likely outcome here.
I've marked off support levels on the downside that might be good opportunities to scale in on the long side.
Let's see how low we go.

TSLA Backtest: A robo-taxi launchpad? TBD ... 𝗧𝗲𝘀𝗹𝗮 𝗕𝗮𝗰𝗸𝘁𝗲𝘀𝘁: A robo-taxi launchpad? 🤖🚗
After a 20%+ breakout, NASDAQ:TSLA is retesting its 200dma with $295–300 now key support. Hold that — and bulls have room to run to $400+.
𝘉𝘶𝘭𝘭𝘪𝘴𝘩 𝘴𝘦𝘵𝘶𝘱 𝘸𝘪𝘵𝘩 𝘢 𝘥𝘢𝘵𝘦: June 12 robo-taxi reveal in Austin could mark Tesla’s first real step toward autonomous ride-hailing at scale.
𝘏𝘪𝘨𝘩 𝘱𝘳𝘪𝘤𝘦, 𝘩𝘪𝘨𝘩 𝘩𝘰𝘱𝘦𝘴: Tesla's valuation has always priced in the future. This time, the future might show up in a self-driving Model Y.
$NQ_F NASDAQ:NDX NASDAQ:QQQ NASDAQ:NVDA NASDAQ:AAPL AMEX:SPY NASDAQ:SOX CBOE:ARKK #Tesla #Robotaxi #FSD #ElonMusk #Stocks

SPY/QQQ Plan Your Trade For 6-5 : Inside BreakawayToday's SPY Cycle Pattern is an Inside Breakaway pattern - which indicates the markets want to try to break away from the sideways range I've been sharing with you.
Gold and Silver are making a very big move higher this morning - which may be indicative of some crisis or military conflict move throughout the world.
I see this move in Metals as a bit of a warning to the global markets. Metals hedge global risk levels. A rise in metals suggests traders fear some crisis event and are banking on Silver/Gold as an efficient hedge.
BTCUSD is still trading within the sideways channel as well. I see BTCUSD less as a hedge and more as a technology/Block-chain asset. No matter how you slice it, BTCUSD is not really an alternate currency, it is a Technology asset.
We could see some big moves over the next 2-5+ days because of how the markets are setting up and how Gold/Silver are reacting.
Buckle Up.
Get Some.
#trading #research #investing #tradingalgos #tradingsignals #cycles #fibonacci #elliotwave #modelingsystems #stocks #bitcoin #btcusd #cryptos #spy #gold #nq #investing #trading #spytrading #spymarket #tradingmarket #stockmarket #silver

All-Time Highs (3% Up) or US/China Trade Gap (4-5% Down)?It's summer time (1st week of June)
Brutally slow price action thus far, Non-Farm Payroll hits this Friday
Next week will be more US Inflation Date (CPI, PPI)
S&P and Nasdaq are only 3% (or slightly less) away from all-time highs
Melt-up momentum says it's the path of least resistance
US/China Trade Agreement Gap (that silly little Monday announcement) is 4-5% lower
Whatever we hit, there will be disappointed traders and investors - the ultimate pain trade :)
I'm not bearish, I'm ridiculously cautious as a bull and wanting to see a pullback. I can tell
because it's actually annoying watching the market grind so slow to the upside shrugging
off every bad news bite and sense of reality
The big beautiful tax bill is losing support (see Elon Musk's latest comments)
The Trump Administration has pivoted so hard the other way the market is virtually
ignoring tariff news now
Let price be your guide. I'm connecting the April 7 lows forward and if the bears cross it and price sweeps some lows, there might be some pullback potential in the cards
Plenty to watch - be patient - opportunities await. Not forcing anything for now and I'm
doing the "boring" stuff for income trading.
Thanks for watching!!!

SPY/QQQ Plan Your Trade For 6-3 : Carryover in Carryover modeToday's pattern suggests we may see more upward price consolidation/trending.
As many of you already know, I've been tracking the Excess Phase Peak pattern all the way up this incredible rally from the $480 lows on the SPY. In my opinion, we have moved into the "island" topping phase where price is struggling to break either upward or downward right now.
Currently, price seems to be attempting to break to the upside after yesterday's meltup. Today should be interesting because we could see solid REJECTION of yesterday's move with a big breakdown move. We'll see how things play out.
The SPY trend is still BULLISH based on my research. Thus, until and IF we get a breakdown, traders should continue to expect a MELT UP type of trend in the SPY/QQQ.
Hedging trades is a good idea right now.
Gold and Silver had a big move early this week and have not stalled into a sideways FLAGGING trend. By my estimates, the APEX of the flag will come near 1900-2100 today (Wednesday 6-3). That is when I think Gold/Silver will attempt to move into extreme volatility and attempt to make another big move.
I hope it is to continue the upside price trend, as this breakout move needs to push higher (breaking recent highs) for metals to move into a new dominant upward price trend.
BTCUSD is trading sideways - possibly setting up that DOUBLE-TOP pattern I suggested was going to take place on 5-20-25. Now, with Bitcoin leading the US markets by about 3-5 days (on average), we'll see if BTCUSD can attempt to move into another rally phase or if BTCUSD breaks below the $103k level and moves into a new downward price phase.
In my opinion, look out below.
Get some.
#trading #research #investing #tradingalgos #tradingsignals #cycles #fibonacci #elliotwave #modelingsystems #stocks #bitcoin #btcusd #cryptos #spy #gold #nq #investing #trading #spytrading #spymarket #tradingmarket #stockmarket #silver

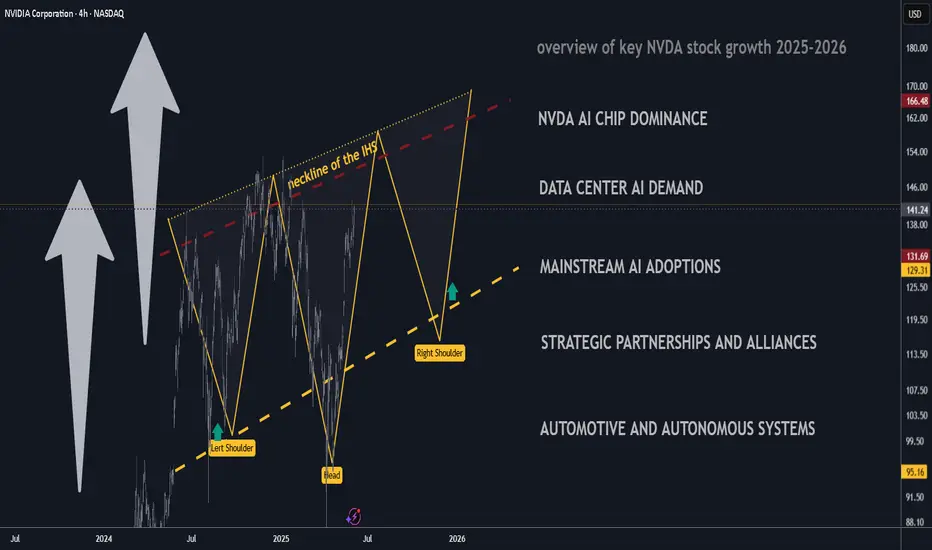
Key Catalysts Driving Nvidia’s Stock Growth 2025 and BeyondKey Catalysts Driving Nvidia’s Stock Growth (Mid-2025 Onward)
Nvidia (NVDA) has solidified its position at the center of the AI computing boom, with record fiscal 2025 revenue of $130.5 billion (114% year-over-year growth) driven by surging demand for its AI chips. Looking ahead from mid-2025, multiple fundamental catalysts are expected to power further stock price growth. Below, we identify 10 primary forward-looking growth drivers for Nvidia, each ranked by expected impact (0 to 10) and analyzed with recent data, forecasts, and developments.
1. AI Chip Dominance – Strength: 10/10
Nvidia is the undisputed leader in accelerated AI hardware, commanding a dominant market share in data-center GPUs and AI chips. Its GPUs have become the backbone of modern AI – Nvidia “holds the pole position” in the AI ecosystem, with industry estimates showing it controls over 90% of the data-center AI processor market. This chip supremacy gives Nvidia tremendous pricing power and a virtuous cycle: more developers adopt its CUDA platform and hardware, further reinforcing its lead. As advanced AI models grow ever more complex, Nvidia’s top-of-the-line silicon (from the current Blackwell GPUs to upcoming architectures) remains the default choice for training and deploying cutting-edge AI, positioning the company to capture the lion’s share of the AI revolution.
2. Explosive Data Center AI Demand – Strength: 10/10
Skyrocketing demand from cloud giants and enterprise data centers for AI compute is a core growth engine for Nvidia. The company’s data-center segment has experienced exponential growth – in calendar 2023, Nvidia’s data center revenue surged by 409%– as hyperscalers raced to build out AI infrastructure for large-scale training and inference. This upward trend is expected to continue into 2025 as companies pour capital into AI-driven services. Notably, tech titans like Meta, Microsoft, Amazon, and Google have collectively pledged over $300 billion in 2025 AI-related capex, reflecting no slowdown in spending on AI servers.
Nvidia directly benefits, as its high-end GPUs (e.g. H100 and Blackwell) are heavily deployed for these AI workloads. In its latest quarter, Nvidia reported data center revenue of $39.1 billion (up 73% year-on-year – an astonishing run-rate driven by relentless orders from cloud providers. With customers reportedly maintaining or increasing their 2025 AI infrastructure plans, data-center demand remains an unparalleled catalyst for Nvidia’s growth over the next several years.
3. Mainstream AI Adoption Across Industries – Strength: 9/10
AI is rapidly becoming ubiquitous in business processes and consumer applications, translating to broad-based demand for Nvidia’s technology beyond the hyperscalers. “AI has gone mainstream and it’s being integrated into every application,” CEO Jensen Huang noted – from logistics and e-commerce to healthcare and finance, organizations are embedding AI to gain efficiency and insights. This everyday AI usage sustains high growth for Nvidia as enterprises large and small invest in AI capabilities, often via cloud services powered by Nvidia GPUs. The company is banking on this pervasive adoption (“AI…in delivery services everywhere, shopping services everywhere”) to drive continued revenue expansion.
Crucially, as AI moves into normal operations – such as automated customer service, supply chain optimization, and data analytics – demand shifts from one-off experimental projects to ongoing, scaled deployments. This creates a steady, secular tailwind for Nvidia’s AI platforms (both hardware and software) across virtually every industry. Analysts expect Nvidia’s revenue to keep rising at a healthy clip (UBS projects ~$147 billion by 2026, up from ~$27 billion in 2023f) precisely because AI adoption is broadening into a long-term, multi-industry growth cycle. In short, the “AI everywhere” era means sustained demand for Nvidia’s solutions well beyond the tech sector.
4. Strategic Partnerships & Alliances – Strength: 8/10
Nvidia has forged high-impact partnerships across tech, industry, and even nations, which amplify its market reach and create new revenue streams. Robust alliances with virtually all major technology players are central to Nvidia’s strategy, enabling it to deliver solutions at massive scale. For example, Nvidia expanded collaborations with cloud providers and enterprise software firms: Snowflake now integrates Nvidia’s full-stack AI platform to help customers build AI applications in the Data Cloud, and ServiceNow is co-developing enterprise AI agents with Nvidia’s tools to transform business workflows.
These deals embed Nvidia’s AI technology into popular platforms, driving indirect adoption of its chips and software. On the global stage, Nvidia is also partnering with governments and sovereign investment funds to supply AI infrastructure. In May 2025, Nvidia announced a major partnership with Saudi Arabia’s AI firm Humain (backed by the Saudi Public Investment Fund) to build out national AI infrastructure. In the first phase, Humain will purchase 18,000 of Nvidia’s advanced Grace Blackwell AI superchips for new Saudi data centers. Such large-scale deals not only yield immediate chip sales but also cement Nvidia’s position as the go-to provider for strategic AI projects. Overall, by teaming up with influential cloud vendors, software companies, automakers, and governments, Nvidia is seeding long-term growth opportunities far beyond what it could achieve alone.
5. Automotive & Autonomous Systems – Strength: 8/10
Nvidia’s push into automotive AI is expected to become a significant growth driver as the auto industry evolves toward self-driving, electrification, and software-defined vehicles. Nvidia’s automotive segment – which provides AI chips and software (Drive platform) for driver assistance and autonomous driving – grew 27% year-over-year recently and is considered the company’s next billion-dollar business line. The pipeline is robust: more than 25 vehicle makers (including EV leaders BYD, NIO, Lucid and stalwarts like Mercedes-Benz, Volvo, Jaguar Land Rover) have adopted the NVIDIA DRIVE system-on-chip for their next-generation cars. Starting in 2025, all new Jaguar Land Rover models will be built on Nvidia’s Drive AI platform (from cloud training to in-car chips), and Mercedes is rolling out Nvidia-powered “Hyperion” AI computers in its 2024 models.
These design wins translate to multi-year revenue streams in hardware and software (through NVIDIA’s DRIVE OS and AI cockpit software). As vehicles become “computers on wheels” requiring sophisticated AI for perception and decision-making, Nvidia is uniquely positioned with its automotive-grade Orin/Atlan chips and full software stack. Additionally, Nvidia’s technology is expanding into robotaxis, trucking, and autonomous industrial machines, tapping markets beyond passenger cars. While automotive AI revenue is smaller today than data center, its growth trajectory (with a design-win pipeline exceeding $11 billion over 6 years makes it a strong catalyst moving forward – effectively adding a new vertical to Nvidia’s growth profile as self-driving capabilities proliferate.
6. Expanding Software Ecosystem & Platforms – Strength: 9/10
A critical (and often underappreciated) driver of Nvidia’s success is its full-stack software ecosystem, which greatly extends its reach and creates a sticky moat around its hardware. Nvidia has spent years developing software frameworks, libraries, and tools (from the CUDA programming platform to AI frameworks like TensorRT and NVIDIA AI Enterprise) that are custom-built for its chipsets. This tight integration means anyone building AI, HPC, or graphics applications can leverage Nvidia’s optimized software to get superior performance – but in doing so, they become tied into Nvidia’s platform. For example, CUDA has become the de facto standard for GPU computing, with countless applications and machine learning models written for Nvidia GPUs.
The result is a virtuous ecosystem: over 4 million developers now work with Nvidia’s SDKs, and the company continually updates its software (e.g. CUDA Toolkit, cuDNN, Triton inference server) to support new AI breakthroughs. Beyond enabling hardware sales, software is becoming a direct revenue stream. The NVIDIA AI Enterprise suite – a cloud-native AI software platform dubbed the “operating system for enterprise AI”– is sold via licenses and subscriptions to corporations deploying AI. Likewise, Nvidia’s DGX Cloud offering provides its AI infrastructure “as-a-service” via cloud partners, contributing to nearly $1 billion in annual recurring revenue already. By expanding its software stack and services, Nvidia not only locks in customers, but also moves up the value chain. This software-centric strategy is a powerful catalyst: it boosts margins, fosters customer loyalty, and opens Nvidia to growth beyond chip sales – for instance, through AI cloud services, enterprise support contracts, and developer platform fees – all of which support a higher long-term valuation.
7. Omniverse and Digital Twin Leadership – Strength: 7/10
Nvidia is spearheading the use of AI and graphics in simulation, positioning its Omniverse platform as the standard for industrial metaverse applications and digital twins. Omniverse is a real-time 3D simulation and collaboration platform that enables companies to create virtual worlds – “digital twins” of products, factories, cities, and even data centers – with physical accuracy. This initiative is forward-looking and strategic: it drives demand for Nvidia’s professional GPUs and AI software as more industries embrace simulation for design, engineering, and operations. Recent developments underscore Omniverse’s momentum: at GTC 2025, Nvidia announced an expansion of Omniverse with major partners like Ansys, Siemens, SAP, and Schneider Electric integrating it into their solutions to build smarter factories, robots and AI-driven facilities.
In other words, leading industrial software providers are embedding Nvidia’s metaverse platform to help enterprise customers digitize their operations. The Omniverse allows engineers to visualize complex systems and test scenarios virtually – for example, designing a gigawatt-scale AI data center in simulation (including cooling and electrical systems) before building it in reality. Automakers use Omniverse to simulate autonomous driving; architects create virtual building models; manufacturers test production line changes in a risk-free virtual space. As this “industrial metaverse” trend grows, Nvidia’s early lead could yield a new ecosystem (and revenue source) of Omniverse software subscriptions, cloud services, and associated hardware sales. While still emerging, the platform’s potential is significant – it extends Nvidia’s reach into every field that uses simulation or 3D design, leveraging its core strengths in graphics and AI. In the coming years, Omniverse-driven demand for GPUs (for rendering and physics simulation) and software could become a notable catalyst augmenting Nvidia’s more mature segments.
8. Continuous Innovation and Product Roadmap – Strength: 9/10
Nvidia’s planned GPU hardware roadmap through 2027 (Ampere/Hopper to Blackwell to Rubin architectures) demonstrates its aggressive cycle of innovation, with each generation delivering major leaps in AI performance.
A key reason Nvidia maintains its edge is relentless R&D yielding regular leaps in performance – a pipeline of new GPUs and systems that keep customers upgrading. The company’s roadmap beyond mid-2025 is packed with heavyweight launches. Its current flagship data-center GPU family, Blackwell, only ramped production in early 2025, yet Nvidia is already preparing the next architecture, codenamed “Rubin,” for 2026. CEO Jensen Huang has affirmed that Blackwell Ultra GPUs (a mid-cycle upgrade with faster memory and networking) will debut in late 2025, followed by the next-generation Rubin GPU platform shortly thereafter. Partners are “getting up to speed” on Rubin, which is expected to provide a “huge step up” in AI capability. In fact, Nvidia has outlined a cadence of major launches every even year (2024 Hopper → 2026 Rubin → 2028 Feynman, etc.), with incremental updates on odd years. This rapid pace matters for the stock: each new generation spurs a replacement cycle as cloud firms, enterprises, and supercomputing centers upgrade to unlock higher efficiency.
For instance, the Blackwell-based systems offer up to 1.5× the performance of the prior Hopper chips, and Rubin is expected to jump even further, enabling more advanced AI models (critical as the industry chases artificial general intelligence). Nvidia’s ability to consistently deliver order-of-magnitude improvements – e.g. through more memory (HBM4E), faster interconnects, and specialized AI cores – encourages customers to expand their Nvidia-powered infrastructure. In turn, it deters competitors who struggle to match Nvidia’s R&D breadth. This continuous innovation cycle ensures that as AI workloads grow, Nvidia will have the cutting-edge products ready – keeping demand (and revenue growth) on an upward trajectory.
9. Full-Stack Expansion (CPUs, DPUs & Networking) – Strength: 8/10
Nvidia is evolving from a pure GPU vendor into a full-stack data center platform provider, expanding into CPUs, networking, and data processing units (DPUs). This strategic broadening of its product portfolio substantially increases Nvidia’s addressable market and lets it capture more value per system. Notably, Nvidia’s homegrown CPU (central processor), codenamed Grace, began shipping to customers in 2024–2025. Grace is a high-performance Arm-based CPU designed to pair tightly with Nvidia GPUs, capable of handling enormous data flows between chips – a crucial advantage for AI and HPC workloads. By offering its own CPU, Nvidia can sell complete server platforms (CPU+GPU) and optimize the whole system for AI. Jensen Huang highlighted that integrating GPUs with CPUs can boost computing speeds by 100× while only tripling power usage, underscoring the efficiency gains of Nvidia’s full-stack approach.
Alongside CPUs, Nvidia has invested in networking and interconnects (acquiring Mellanox in 2020) and now leads in ultra-fast data center networks. Its latest Spectrum-X switches and ConnectX/BlueField SmartNICs (DPUs) are built to alleviate data bottlenecks in AI supercomputers. Industry analysts predict rapid growth in this DPU/SmartNIC space (a ~$5.5 billion market by 2031), and Nvidia is well positioned to dominate it with BlueField. By selling DPUs and switches alongside GPUs, Nvidia ensures that AI clusters can scale out efficiently, which is a key selling point for cloud providers. Importantly, these moves encroach on traditional CPU and networking incumbents – every Nvidia Grace CPU or BlueField DPU sold potentially displaces a competitor’s chip, consolidating more of the data center stack under Nvidia. The full-stack strategy thus acts as a force-multiplier for growth: Nvidia can address virtually every component of AI infrastructure, from processing to networking to storage acceleration. As customers increasingly prefer integrated solutions, Nvidia’s ability to provide the “entire package” drives incremental revenue and strengthens its competitive moat in the AI infrastructure market.
10. Global AI Infrastructure & New Markets – Strength: 8/10
Nvidia’s growth is set to benefit from international expansion and a wave of government-driven AI infrastructure investments. Around mid-2025, export policies began to favor Nvidia’s business, widening its reachable market. The U.S. Commerce Department’s rollback of certain AI chip export rules in May 2025 removed restrictions on which countries Nvidia can sell advanced AI chips to, easing a headwind that had weighed on the stock earlier. This policy shift, coupled with surging interest in AI globally, has unlocked huge orders from new regions. For instance, the Middle East is emerging as a major AI hub: the United Arab Emirates reached a preliminary agreement with the U.S. to import up to 500,000 of Nvidia’s high-end AI chips per year starting in 2025 – a massive volume aimed at making the Gulf a “third AI power center” alongside the US and China. Similarly, Saudi Arabia has announced plans to invest hundreds of billions in tech and is buying a TON of Nvidia chips for its own “AI factories” as part of a $600 billion investment pledge in U.S. and AI infrastructure.
These moves reflect a broader “sovereign AI” trend: governments and enterprises worldwide are building domestic AI supercomputers (for national security, research, or competitive advantage) – and Nvidia is the go-to supplier for the requisite hardware. Additionally, markets like India, Southeast Asia, and Latin America are ramping up cloud data center builds and AI initiatives, representing new growth frontiers for Nvidia’s datacenter GPUs. Even in China – despite ongoing export controls – Nvidia has navigated restrictions by offering modified chips (like the A800/H800) to continue serving demand. Altogether, the global arms race in AI computing acts as a tailwind for Nvidia: it guarantees a steady stream of orders from across the world. With geopolitical allies now explicitly allowed (and eager) to procure Nvidia’s top chips, the company stands to fill the AI compute gap globally, driving revenue growth beyond the traditional U.S. customer base. In summary, expanding international markets and large-scale AI infrastructure projects are a catalyst that could propel Nvidia’s next phase of growth.
Sources: The analysis above incorporates information from recent Nvidia financial reports, press releases, and expert commentary, including Nvidia’s FY2025 earnings, CEO Jensen Huang’s statements on AI demand, analyst insights on spending and growth forecasts, and news of key deals and policy changes affecting Nvidia. These catalysts underscore Nvidia’s unique positioning at the intersection of AI hardware, software, and global adoption, suggesting that from mid-2025 onward, the company has multiple powerful growth drivers supporting its stock’s long-term trajectory.
SPY Major Confluence ZoneSPY has a major upside confluence zone around 625
Looking for a test of this area in the coming weeks.
The level is about 5% away.
Let the melt up begin.

SPY New All Time Highs IncomingThe #SPY weekly chart is so bullish but don't take my word for it.
Simply look at the weekly bullish crossover that occurred between the 7 week & the 20 Week MA.
The last time this occurred was in Nov 2023 and the markets ripped 19% before having a major 3 week pullback and then another soaring continuation higher.

SPY/QQQ Plan Your Trade For 6-3 : BreakAway In Trend ModeToday's pattern suggests the SPY/QQQ will attempt to move into a Breakaway type of pattern. I believe that Breakaway may be to the downside, but I could be wrong.
Price has been struggling in a sideways consolidated range over the past 2+ weeks. I believe this range sets up an "Island" type of price formation that is indicative of a topping type of pattern.
Currently, I'm tracking layers of different TA techniques to try to see how price may react in the future. Right now, price appears to be trapped within a range, has recently broken below the STDDEV channel, and may be moving into a very volatile FAILURE/REJECTION phase.
This is where price may attempt to resume trending (up or down) and I believe the move logical move is to the downside at this point.
Gold/Silver had a HUGE MOVE yesterday and are not contracting a bit. I still believe Metals will rally higher and attempt to break to new ATH levels.
BTCUSD is trapped in a sideways price range after reaching new ATH levels recently. Many of you are aware I'm expecting a rollover-top pattern to setup in BTCUSD (and the US markets) and I believe it is just a matter of time to see how the markets react to policies, news, and economic function/data.
Should be an interesting (possibly sideways) day today.
Get some.
#trading #research #investing #tradingalgos #tradingsignals #cycles #fibonacci #elliotwave #modelingsystems #stocks #bitcoin #btcusd #cryptos #spy #gold #nq #investing #trading #spytrading #spymarket #tradingmarket #stockmarket #silver

SPY: Bullish Outlook Based on Market StructureETF Strategy: Still Buying for 2025 Growth
I'm continuing to buy SPY and adding other strong ETFs like VEA, QQQ, and TQQQ. The market structure looks solid after the recent bounce, and I’m positioning for continued growth through the rest of 2025. My goal is to close the year with a strong percentage gain.

SPY/QQQ Plan Your Trade For 6-2 : Post Market UpdateHuge move for metals today. Absolutely incredible.
Hope you GOT SOME.
BTCUSD and the SPY/QQQ stalled somewhat flat today. SPY was up 0.50% - nothing huge.
Going to be interesting to see how things play out in the Asian/European markets tonight.
Buckle up. Could be some very big moves hitting this week.
GET SOME.
#trading #research #investing #tradingalgos #tradingsignals #cycles #fibonacci #elliotwave #modelingsystems #stocks #bitcoin #btcusd #cryptos #spy #gold #nq #investing #trading #spytrading #spymarket #tradingmarket #stockmarket #silver

YEN/$USA topped in the target 144/146 and now supported into fibThe chart posted is the USA $/YEN chart it is key to all things as to the sp 500 and debt markets A few weeks back I posted The chart of a MASSIVE HEAD N SHOULDER TOP formation !!! we are still forming the Right shoulder in a rather complex wave STRUCTURE This is the hourly model and forecast so far spot on . best of trades WAVETIMER

SPY/QQQ Plan Your Trade For 6-2 : Gap Breakaway PatternToday's pattern suggests the SPY may attempt a GAP Breakaway in Trend mode (likely BULLISH). But, the Russia/Ukraine war is overshadowing that potential pattern as big news this morning.
From what I can tell, Russia is mounting a large-scale attack after Ukraine launched a big drone attack targeting Russian aircraft.
No matter how you slide and dice this news, it means this conflict is entering a new phase. A possibly much more destructive phase for all involved.
Gold and Silver are reacting to this news by skyrocketing higher. I believe this upward move in metals could continue for many days/weeks as long as this conflict continues to grow.
BTCUSD is trading slightly downward right now, but not as much as I would have expected based on the news. We'll see how BTCUSD plays out this week and if we get a bigger breakdown over time.
Currently, if you had actively hedged your positions, I believe you will be OK this week as Metals seem to be the big movers right now. The SPY/QQQ should react to this war news, but being somewhat isolated from this conflict economically, we may not see any huge moves in the US markets today.
Overall, hedge your positions to protect against surprise news/risks and try to prepare for the longer-term swings. Volatility will stay elevated over the next few weeks..
So, GET SOME.
#trading #research #investing #tradingalgos #tradingsignals #cycles #fibonacci #elliotwave #modelingsystems #stocks #bitcoin #btcusd #cryptos #spy #gold #nq #investing #trading #spytrading #spymarket #tradingmarket #stockmarket #silver

TSLA PRICE ACTION 1ST JUNE 2025This is the updated price action of Tesla. I have explained why I exited long positions. If you have any doubts, then feel free to leave a comment below.
NOTE: STAY AWAY FROM TSLA LONGS

#202522 - priceactiontds - weekly update - nasdaqGood Day and I hope you are well.
comment: Not much difference to the dax or sp500, so you can skip the text and just watch the chart. Should look similar to you and you should trade it the same. If you have not read my dax update, please go read it.
current market cycle: trading range
key levels for next week: 20700 - 22000
bull case: Bulls are trapping bears into decent looking shorts just to reverse them strongly. Bulls are still hopeful af and until we have a daily close below 20700, the bull wedge is alive and can lead to higher prices. Bulls are heavily favored to continue until then. Target is obviously 22000.
Invalidation is below 20600.
bear case: Bears need a daily close below 22700 and close the giant gap down to 20200. Until then they have been making money shorting new highs but only for scalps. If we get another good move down next week, you should take big profits before they vanish again. Daily 20ema held for 6 weeks now, expect the next touch to get bought as well.
Invalidation is above 22100.
short term: Bullish that we stay above 20700 and hit 22000 next week. The buying on Friday was so strong, that we can expect higher prices. I will need strong signals though since we had bad news after hours Friday and Friday was also end of month, which can always distort the market bias somewhat.
medium-long term - Update from 2024-06-01: Market is refusing to go down but I can not see this going much more up. Maybe we hit 22000 maybe we don’t. My assumption is still that latest around end of June we begin to decline over the summer. If EU tariffs go through next week or there is no really good news before end of day Friday, expect a blood bath if they come into effect. It’s a trade embargo. No one will ship anything with 50% on top of it and markets are trading like everything is literally perfect.
