QQQ Nasdaq 100 ETF PredictionIf you haven`t bought the last dip on QQQ:
Historically, the QQQ Nasdaq 100 ETF has demonstrated a consistent pattern where a Relative Strength Index (RSI) at or below 30 triggers buying activity.
This technical indicator, typically viewed as signaling an oversold condition, has reliably attracted investors looking to capitalize on perceived undervaluation.
As a result, these dips have been quickly bought up, suggesting a strong market tendency to rebound from such low RSI levels.
I expect the recovery to be V-shaped or W-shaped, ending the year higher.
Qqqforecast

QQQ Put & Call case for 8/1/24QQQ along with the rest of big tech has/is looking weak. This has been going on the the last month at least. Weakness to all of these levels. I am trying to stay neutral , but the price action & volume delta/CVD doesn't lie.

Elliot Wave Analysis/Prediction of QQQ Chart (Monthly Timeframe)Overview
The Invesco QQQ Trust (QQQ) chart presents a well-defined Elliott Wave structure over the long term, suggesting a robust bullish trend. Additionally, the RSI is indicating interesting channel movements that reflect changes in market momentum.
Key Points:
Elliott Wave Analysis:
The chart displays a clear Elliott Wave pattern:
Wave I started the initial uptrend ($168-$407)
Wave II was a corrective phase, resetting the trend. ($407-$254)
Wave III marked a significant bullish run, reaching new highs. ($254-$550expected)
Wave IV will be a minor corrective phase with support around $450-410 before the anticipated Wave V.
The potential for Wave V suggests further upward movement, continuing the long-term bullish trend. From the lows of Wave IV, we expect to see 80% appreciation before May 2027
RSI Trend:
The RSI is currently around 72.00, which is in the overbought territory, indicating strong bullish momentum.
The RSI has been moving within a rising channel, suggesting increasing momentum over the recent months.
Historical RSI movements show that the QQQ tends to pull back slightly when RSI reaches these levels before continuing the upward trend.
Support and Resistance:
Immediate support can be found around the $450-$410 level, aligning with the previous consolidation zone and the potential Wave IV corrective phase.
Resistance is projected at the current all-time high around $483, with further potential to reach higher levels if Wave V unfolds as expected.

Sine Curves and NasdaqSharing a quick chart art analysis of sine curves over the Nasdaq.
If this kind of pattern continues, we should see the start of a sideways move over to the second half of the sine curve after which, the move to the top continues. If the pattern holds true, we can expect a retracement in the 40% to 30% range sometime in an 18 month timeline.
Short and BTFD on the transition across during the Summer
Long in the Autumn for the final leg up
Note that the first two sine curves complete on a 2 year schedule and are part of a similar inflation regime. This current sine curve looks set to extend to 4 years with significant inflationary attributes.
I think this is interesting because it is not a click bate doom scenario nor is it a full guns blazing BTFD scenario.
Anyhoo... it's chart art. Take it for what it is.

spy weekly 27th MAY 2024This is my analysis for SPY for this coming week. I have clearly explained the levels and my intentions. Let me know if you have nay doubts.
NOTE:WE ARE BULLISH

QQQ BULL FLAG | Possible New ATH'ssimple price action here, 4h macro structure broke to the upside with the 1h flagging at highs. Don't let it fool you though... this play could Boom OR Bust. Size accordingly.

spy weekly 13th May 2024Welcome to Spy weekly. I have discussed the levels and my expectation of the market. If you have any doubts feel free to msg me.

CQQQ May 7th TTR UpdateTheTradersRoom is very long #CQQQ from much lower levels and looking to hold this one till at least we see 2-3x gains on it.
We have entered it first days of Feb and very happy with the result.
China is recovering and Im expecting a perfect inversion alignment to QQQ here into the end of the next year.
It was a clear breakout from the downtrend channel last week. If the broken channel gets tested from above, it will be a perfect opportunity to add into our long position.

TOP IN SPY 513 area I can now count the move up from 4954 two ways a simple abc rally into .618 or the chart posted 5 wave up for a wave A I lead towards the ABC both had the math into the same targets . I have moved out of the longs 75 % to zero and moved into 35 to 40 % long PUTS best of trades WAVETIMER trade # 23 for 23

SPY WEEKLY APRIL 8,2024Welcome to SPY weekly. I have clearly discussed the levels where we can trade and what is my expectation.
If you have any doubts feel free to DM me .
NOTE:DO NOT SHORT THE MARKET

SPY WEEKLY CONTINUATION APRIL 1 2024This is the continuation of SPY weekly. Hope you will have a better understanding of market after this analysis.
NOTE: DO NOT SHORT THE MARKET

🌟📈 Weekly Chart Technical Analysis for QQQ! 📊💼Let's dive into the exciting world of QQQ and explore its weekly chart. Get ready for valuable insights and potential trading opportunities. 🚀📈
🔄 Cycle Analysis:
With a cycle period of 20 weeks, QQQ has just embarked on a new cycle. This fresh cycle opens up intriguing possibilities and potential shifts in market dynamics. Let's unravel the future of QQQ! 🔄📆
📈 Key Level Breakout and Retest:
In December 2023, QQQ successfully broke out of the key resistance level at 190.8, and we've witnessed a subsequent retest of this important level. This validates its significance and sets the stage for potential movements. Based on this, we anticipate QQQ to remain above the support level of 395.34 for the next 20 weeks. 💪📈🔐
💡📉 Retracement and Consolidation:
Our analysis reveals the presence of MACD divergence on the weekly chart, along with a prolonged extension. Consequently, we expect a normal retracement back to the support level of 395.34, followed by a consolidation above this level for the majority of the next 20 weeks. This retracement and subsequent consolidation present interesting opportunities for traders to navigate. 💡🔄📉
🔄📊 Potential Impact on Strong Stocks:
During the retracement phase of QQQ, it's worth noting that certain robust stocks with higher Beta values than QQQ may experience a noticeable drop, potentially retracing back to their respective support levels. This phenomenon can provide unique trading opportunities for those closely monitoring these stocks. Keep a watchful eye! 👀📈📉
Embrace the insights, seize the potential within QQQ's weekly chart, and consider the captivating opportunities it presents. Remember, trading carries risks, so always exercise caution and diligence. Let's make the most of these chances and aim for profitable investments! 💪💼💹
#QQQ #WeeklyChartAnalysis #SupportLevelRetracement #ConsolidationPhase #StrongStockOpportunities 📈🔍💱

QQQ TRUST FOR DISTRIBUTION!This idea made from breakout since it reaccumulate, My analysis would be 125% of its reaccumulated zone to its expansions, Were waiting for distributions to form, The highs of this might 444-450$ .
This is only my, Follow for more!
This is not a financial advice, Stocks traders were waiting!
Goodluck. Happy New Year

SPY WEEKLY 4th MARCH 2024This is my analysis for SPY. I have clearly explained the strong levels. If you have any doubts feel free to txt me.
NOTE:I WILL BE AVOIDING TRADING SPŶ

QQQ to $392Trading Pattern
QQQ has formed an ascending channel which may prove to be very lucrative for derivative trading. Utilizing Elliott Impulse and Correction Waves within the support and resistance lines, Wave 4 may dip as low as $392 which is a few dollars shy of a 61.8% Fibonacci retracement level.
Technical Indicators
A bearish RSI divergence has been present since the share price surpassed $400; the RSI highs retain a negative slope while the share price highs have a positive slope (both reflected in yellow). This supports the Elliott Wave Theory and ascending channel pattern as the share price is currently at, or soon approaching, the crest of Wave 3 as well as the ascending channel resistance line.
QQQ may experience a slight bump upwards indicated by the RSI line (green) which appears to be close to crossing the MA line (red) from beneath. However, due to its close proximity to overbought territory, I believe selling pressure will begin soon after as might be indicated by the MACD.
The MACD technical indicator shows a tightly wound MACD line (green) and Signal line (red). The MACD line is within dangerous territory of crossing its Signal line from above which is a bearish indicator and suggests an increase in selling pressure followed by a correction in share value.

QQQ confirmed daily lower highOn Friday QQQ set daily lower high, marking potential trend reversal. Now bears must lead price all the way down (below 425.3) to start weekly consolidation. If this doesn't happen fast and bulls manage to set daily higher low then uptrend continuation is still an option.
Also notable that bulls were able to close price gap from Tuesday, and bull wave retracement is over 50%. This talks in favor of bulls strength and increases probability of daily higher low.
Hourly price action is currently in downtrend but given the context I would be looking for hourly trend reversal signals
Disclaimer
I don't give trading or investing advices, just sharing my thoughts

Nas100 HTF Analysis I expect Nas to reach 17k in the next few weeks. Nas has been pushing up relentlessly last few weeks so expecting ATLEAST a nice pullback. Once we hit 17k tho we could see all time highs again!

QQQ Jan 26th, after the close updateSharing my usual QQQ chart with weekly and daily levels (they get updated every Monday for Weekly and every day for Daily)
#QQQ is in an ending diagonal, bull flagging, so early next week price action is important.
Should break above or fail on a grand scale!
Below 420.50 will trigger a strong selloff down to 412!

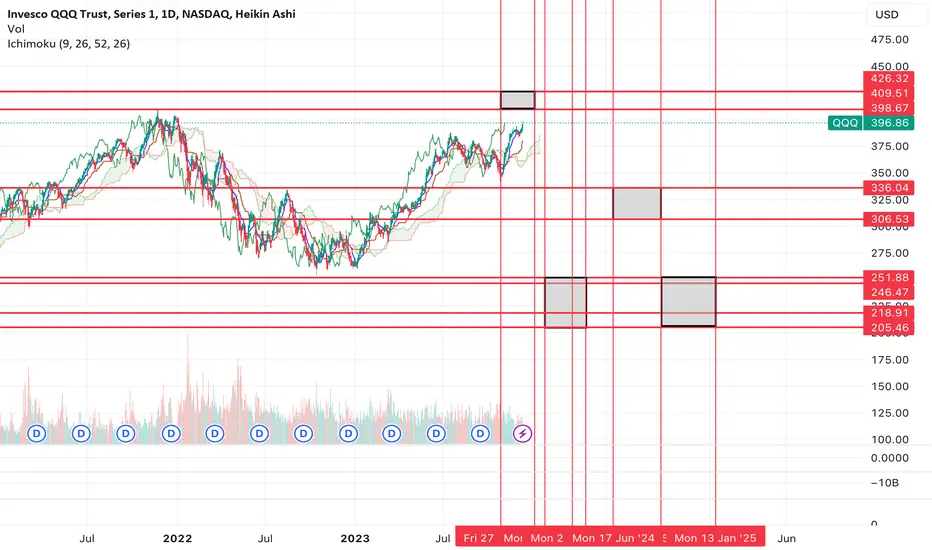
$QQQ 2024 downside price targets + timingIt's very tough to forecast price + time and get the exact timing and price targets correct. However, I'm going to attempt to do so.
Over the next year, I expect NASDAQ:QQQ to fall somewhere between 35-50%. If the move that I'm expecting plays out, we'll be right around a 50% drawdown from the current levels.
The chart attempts to forecast time and price levels that are important over the coming year (2024). Each grey box represents a price level that should get hit within that timeframe.
Again, this is extremely hard to do accurately. Often I do these for myself just to try to anticipate large changes in trends, but I thought I'd share this publicly as it would be fun to follow along over the next year.
Essentially what I'm forecasting is one more move up before the end of the year. It should happen before Christmas, but I'm allowing myself some extra time.
Then Q1 should be extremely bearish for the markets with the largest leg down during that time. There are two scenarios that I'm looking at. Either we hit the lower targets all in one move $205-218, then bounce afterwards (this scenario would be the bottom), and we'd retest that lower range in Q4. Or, we hit $246-255 and then bounce into Q2 and fall further in Q4 marking the final bottom.
Regardless of which one plays out, you'll want to buy equities in March/April and then again in October/November.
Q2 and Q3 we should see a bounce where you'll likely want to take profits on the way up.
Let's see if it plays out as anticipated.
QQQ Bye Bye Bye Miss America Pie QQQ BYE BYE 2024 waves 1 is equal to wave 5 from OCT 2022 low and have Now seen a clean 5 wave within 5 waves up from oct 2022 Wave B top from 2021 peak has ended the alt is 5 waves up of a super cycle last 5 in an extension But the market would have to drop to a .236 high to low oct 2022 to the high into the cycle and must last now more tha3.8 weeks otherwise BYE BYE BYE long term

SP cash why I shorted 90 % a x 1.618 = C 4568/4570 = trendline NEXT WEEK TURN I stated that if the sp 500 fails to break above 4569 by nov 27th I would move to a 90 % short . I moved to 90 % long puts in spy qqq the qqq target was 393.1 high 393.07 I am 90 % short I have now placed a stop just below the highs by only 10 ticks monday I will be out all day best of trades WAVETIMER 5 day p/c and VIX gave a SELL

New All Time Highs On Nasdaq😈Hello Traders,
My name is Philip and I am just an average stock and indices trader with over 4 years of trading experience💻
-------------------------------------------------------------------
➡️In today's video, I will analyse the Nasdaq for you🫡
-------------------------------------------------------------------
➡️Let me know your opinion about today's analysis in the comments below👇
➡️I will only enter a trading position if ALL of my trading/entry criterias are met!
Keep your long term vision!
P.S. Trading is risky and most beginner traders lose money!

QQQ NEW LOWS INCOMING!Hello, fellow traders and investors! There has recently been a leg up in our bearish channel creating what we anticipate to be a lower high. There is plenty of uncertainty in the economy at the moment whether it be the wars in Russia/Ukraine or Israel/Palestine, upcoming interest rate decisions, the fed's approach to their balance sheet and applying quantitative tightening, etc...
All that to say Rise Capital believes we are at overbought levels and are actively pursuing strategies to take advantage of the bearish movement that is soon to come. We will be taking different approaches like shorting qqq, getting put contracts on qqq and buying shares of sqqq.
SHORT QQQ
Entry: 367.71
Take Profit: 342.20 (Partial profits can be taking off depending on price action)
Stop loss: 373.75
Risk/Reward: 4.3
