BUY INVESTO QQQ TRUSTafter the strength downward in the last days, today is a good day to buy because of the big strength of buyers today and after 4 red volumes today there is a green volume today and there is a big chance that the candles will return to resistance and the VWAP and it will break down another time due to the big strength :
+ 80 % if it rebounds on the VWAP it will break down with big strength.
+60% if it breaks up the vwap and the resistance line it will eat the stop losses and there will be an upward trend
GOOD LUCK
open your wallets it's a good chance for you.
Qqqforecast

$QQQ is Ready for Correction NASDAQ:QQQ
Since tech leads the rest of the market and the rest of the market looks clearly ripe for correction, it's obvious to short $QQQ. As a chaos theory enthusiast, it is of my belief we do an analog of the correction and run-up of 2020, in 2021. It's that simple and shouldn't be over complicated.
With that said, history only repeats itself until it doesn't. Barring any major black swan or trend changing event we should see $401 to the pip by September 5th. Book it.
- PennyBags

Nasdaq Analysis 16.02.2022Hello Traders,
welcome to this free and educational analysis.
I am going to explain where I think this asset is going to go over the next few days and weeks and where I would look for trading opportunities.
If you have any questions or suggestions which asset I should analyse tomorrow, please leave a comment below.
I will personally reply to every single comment!
If you enjoyed this analysis, I would definitely appreciate it, if you smash that like button and maybe consider following my channel.
Thank you for watching and I will see you tomorrow!

QQQ: MAX PAIN!Q's looking weak going into this week and max pain presenting itself. Ideally would like to create a higher low on the macro level to find a generational buy and bounce back to last weeks highs. Traders gonna trade and levels are in the video! Good Luck!

2022 | The Year Of Wild Swings but a BIG Payoff? QQQ/SPYHey Everyone, in this video we discuss the large swings we expect for 2022 and what might be setting up for the next few quarters on the stock market.

QQQ; in make it or break it zone!! Crucial zoneThe purple zone is a top or bottom zone, so we have to wait for confirmation!
What is your thought ?

QQQ has bounced back but will be tested at around 352
This post is an update of the Jan 16 forecast
QQQ has bounced just above the precalculated level at around 334 and will be tested at 352
The Major levels to watch are around 342, 334, and 352.
QQQ needs to clear the resistance line at 352 to continue up.
The charts' estimates are automated through a system that predicts critical levels of future price movements.

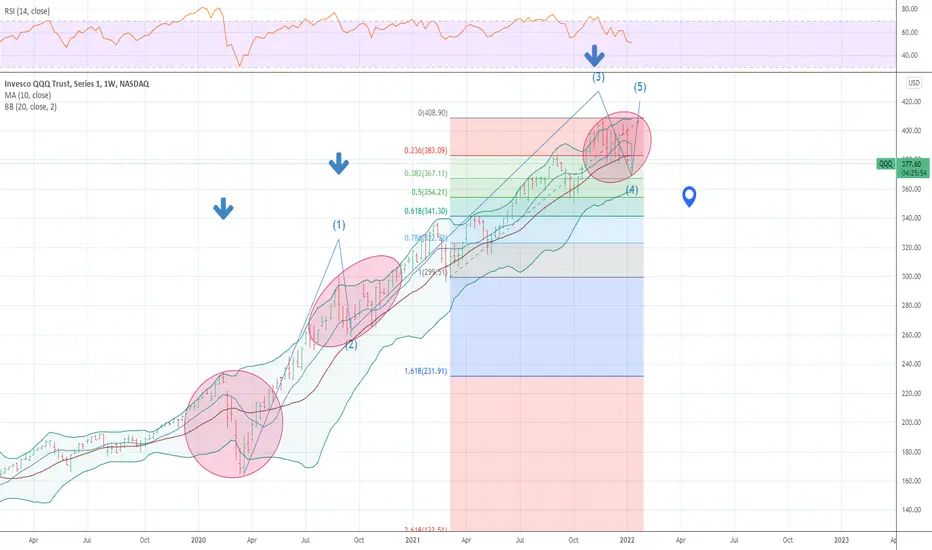
QQQ / Nasdaq / NQ - Interesting Perspective w/ Parallel ChannelsHere is an interesting perspective - if you're familiar with pitchforks and parallel channels and how to appropriately use them, here I'm using the similar knowledge of that mixed with parallel channels to create this. Pay close attention to the circles and how many times it entered that channel and broke out.
A trading channel is drawn using parallel lines that follow the price floor (support) and price ceiling (resistance). With a trading channel, smart traders sell stocks at the upper resistance line, hold stocks within the parallel trend lines, and buy stocks at the lower support lines.
NASDAQ:NDAQ NASDAQ:QQQ

Bullish Bat harmonic on QQQI'm new to harmonics so posting this more for my research to see if it plays out. It meets the rules to be a bat if it hits the PCZ which also would be the 50MA on the weekly with hidden bullish div on MacD. Idk, I think this has a high probability of playing out boys. Lmk what you think down below please!

QQQ Next LevelsNext levels of technical support for the Nasdaq. Lower blue line of channel correlates with the COVID bottom.

Major support around 370
370 is an important support to watch in next week's session. We have seen prices bounce off around 370 but came back down and closed Friday's session at 380. If it's going to slide, it might retest 370 or the 200 MA line around 362

Correction in QQQ IS NEARING AN END MOVE BACK INTO LONG SIDE The chart posted is the QQQ of which topped now 23 time cycle peak we are now at the tail end of the correction it time and nearing the end of price I do not see more than a 360 print in fact I an long at 50 % and now have added options for july and sept best of trades WAVETIMER
First attempt at a QQQ chart NQ moves very sporadically in my opinion but I believe we are past all the news to destroy tech stocks until the fed speaks again about tapering. I believe also institutions are trying to make us leave our technical so we enter shorts.

Nasdaq Analysis 03.01.2022Hello Traders,
welcome to this free and educational analysis.
I am going to explain where I think this asset is going to go over the next few days and weeks and where I would look for trading opportunities.
If you have any questions or suggestions which asset I should analyse tomorrow, please leave a comment below.
I will personally reply to every single comment!
If you enjoyed this analysis, I would definitely appreciate it, if you smash that like button and maybe consider following my channel.
Thank you for watching and I will see you tomorrow!

QQQ forecast for the daily price chart
QQQ fails to break at 403 resistance/support line on its second attempt, as indicated on the chart. We could be looking at a pullback to the bottom of the current trading zone at 385 if it fails to hold at 392.

Major support at 397.80; resistance at 405
The current price pattern points to an important trend around the major level at 397.80; Bulls needs to defend the 397.80 line, or Bears will drag prices further down. Support/resistance estimates are precalculated and marked on the chart.

$NDQ #QQQ $QQQ pulling a Wu-Tang patternlooking at the 1hr chart, there is a classic W pattern formation going on here. December was a tough month for tech, and looks to be finally recovering. This weeks moves show a break above the prior down channel, with tightly wound consolidation. TBH I see this going in either direction, but with the tax loss harvesting done for 2021, my money is on volume buy-ins this month, with a beginning of a reversal in March when tapering is ending and rates are set to go up.
NFA

we did buy some $QQQ vs todays lowwe like the 2b setup in QQQ we did get our intraday long signal from day trading algo, lets see if this low can hold

Nasdaq Analysis 14.12.2021Hello Traders,
welcome to this free and educational analysis.
I am going to explain where I think this asset is going to go over the next few days and weeks and where I would look for trading opportunities.
If you have any questions or suggestions which asset I should analyse tomorrow, please leave a comment below.
I will personally reply to every single comment!
If you enjoyed this analysis, I would definitely appreciate it, if you smash that like button and maybe consider following my channel.
Thank you for watching and I will see you tomorrow!

Short-term head and shouldersStill in an up-trend but could see price action lower. Positions in the QQQ are incredibly overcrowded.
Support at 392, 380, 370
*not financial advice*

QQQ - Nasdaq heading to find support on 100 MAHi All, my main 3 take-outs from this analysis are the following:
1- Price might be trying to find support at around 15400 where the 100 MA stands
2- In case the 100 MA will be broken, we always have a static ascending trendline at around 15100 which might reject the price as it happened several times in the past
3- Last support might be the dynamic support of the 200 MA, at around 14500, which I personally do not believe we'll be reaching
Not a financial advice, just personal opinion. Do your own due diligence and good luck!

QQQ slipped below the 200 MA after a volatile week
QQQ closed Friday's session within the 383 and 378 trading zone below the 200 MA line. We a likely to see a test of 383 line in Monday's session. If 383 is taken out, 385 would be the next resistance. 380 and 378 are support levels to look out for if it fails at 383

QQQ Thoughts about a big price dropThese are my thoughts for QQQ
In yellow is the structure that is common in two places
In green is the extension from that structure
Both are very similar in length (time wise)
Using this we can apply it to the second "structure"
If we apply a big price drop (bars pattern) it shows a large wedge structure with three bottoms along the wedge.
Short / medium term this would be very Bearish. However, long term a formation like this is setting up price for big times.
The ultimate entry point if this plays out is along the bottom of the wedge (dotted line)
