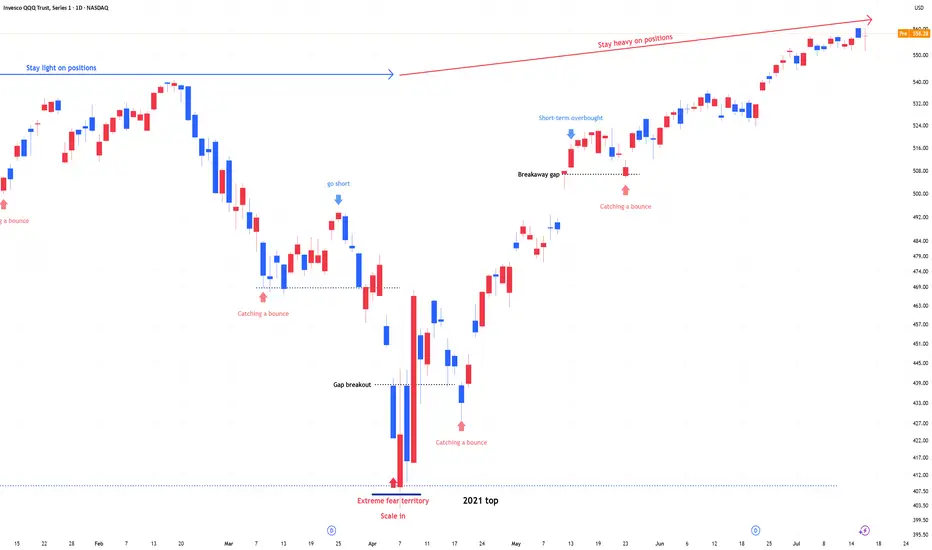
QQQ : Stay Heavy on Positions1) April Fear & Buy Signals
In early April, the Nasdaq 100 experienced a sharp sell-off, triggering extreme fear sentiment across the market.
At that point, scale-in buy signals appeared—classic "buy the fear" conditions.
2) Current Market State: No More Fear, but Watching
Since then, the market has stabilized.
The fear has disappeared, but we are still in a wait-and-see mode as traders assess the next move.
Momentum is holding, but participation remains cautious.
3) Stay Heavy on Positions
Despite short-term uncertainty, I’m maintaining an overweight position on the Nasdaq 100.
As long as we don’t see a major breakdown, the bias remains bullish.
Qqqlong
$QQQ WARNING! 6-7% Downside Possible🚨 NASDAQ:QQQ WARNING! 🚨
Holding steady... for now.
But if we break down out of the Daily WCB and through this wedge, it’s game over—GAP FILL incoming!
💥 MM: $493.31 MT: 16 July 💥
If that happens, I’m cutting all swings FAST. Stay sharp!

THIS TIME IT'S DIFFERENT!🔥 THIS TIME IT'S DIFFERENT! 🔥
Can you see the shift?! VOLUME IS HERE—AND IT'S MASSIVE. 💪💰
Unlike those weak, fleeting rallies that got crushed under waves of red, this one is packed with bullish buyers and offside hedge funds READY TO SEND IT HIGHER. 🚀📈
Not to mention the last time we had this level of above average volume for this long was in October 2023 when we were coming out of a bear market and it was only the beginning of our ascent higher!
I'm not saying we can't have a pullback soon...I'm just simply saying the volume is here and it looks like dips will indeed be shallow.
ATH retest INBOUND!
Are you positioned for the move? 👀
AMEX:SPY NASDAQ:QQQ

$QQQ Inverse H&S ready to GO!NASDAQ:QQQ
We’ve spotted an Inverse Head & Shoulders breakout on the 1-hour chart, and we’re currently in the retest phase.
- Measured Move (MM): $483.55
- Measured Timeframe (MT): May 1st @ 7 PM
Let’s see if we can maintain momentum tomorrow and steer clear of any unexpected news or market shocks tonight.
Not financial advice

Nasdaq: Higher Low or Lower High?NASDAQ:QQQ
Are we making a lower low or a higher low?
This $438-$444 previous resistance needs to hold and be flipped into support to continue this rally.
If not then we are going to break the lows!
Not financial advice

Island Bottom CONFIRMED on $QQQ IF we GAP up tomorrow!Island Bottom CONFIRMED on NASDAQ:QQQ IF we GAP up tomorrow!
I only believe we GAP up tomorrow IF there is news of China coming to the negotiation table with the U.S after they have raised the Reciprocal Tariffs to 104%.
If this doesn't happen then this isn't confirmed and we see a retest of $400 IMO!
I'm not playing this as a trade until we get confirmation! Too dangerous!
Not financial advice

I'll be honest here friends it's not looking good...I'll be honest here friends it's not looking good...
This may have been a Dead Cat Bounce on the NASDAQ:QQQ and AMEX:SPY friends.
GAP fills in both names lead to Bear Flag Breakdowns which in my mind leads to the next leg down.
Rejecting 200DMA on the NASDAQ:QQQ and losing control on the AMEX:SPY
Markets are hanging on slightly, lets see what happens the rest of the week.
Not financial advice

MASSIVE $QQQ BOUNCE INCOMING!MASSIVE NASDAQ:QQQ BOUNCE INCOMING!🚀
I believe we are setting up for a run to the 200DMA around $494ish🎯
- Wr% is uptrending after breaking out of Bearish WCB
- MACD is uptrending with the histogram rising
- RSI uptrending and broke out of bearish box
- Stochastic uptrending into the sweet spot after
breaking out of bearish box
We keep rejecting off the H5_S by wicking off it, which is bearish, but all other indicator show bullishness...
I could be wrong, but it's what the probabilities of everything and my GUT tell me.
Not financial advice

QQQ - Nasdaq has reached it's firstPrice reached the Warning Line 1.
This is a natural support, because it's a standard deviation stretch. From here, price has a high tendency of mean-reversion.
How far?
Most of the time it shoots back to the Lower-Medianline-Parallel.
Beware of the potential resistnace zone.
This level is a good one to take partial profits.
As for a stop, I would put it below the last swing-long. I may play it with Options (for example a Risk-Reversal), giving me more leeway to the downside if it's not playing out immediately.

NASDAQ: Correction or Crash?!If this Monthly Chart for March holds then the NASDAQ:QQQ is COOKED!
Next Level: $450
Crash level: $370-$400 🥶
- Breaking out of WCB Trend
- Volume is WAY less than 202 Market Crash (Can get worse)
- Breaking out of Bullish Channel
- Topping tail wicks
Not financial advice

$QQQ - Where are we going now?NASDAQ:QQQ
A drop to $517 looks in the cards here and would be a good spot to bounce to keep the Symmetrical Pattern alive.
Further weakness would take us down to previous support at $510-$515.
Not financial advice

QQQ vs S&P500Today we are looking at a ratio chart from TradFi. We are plotting the ratio of Nasdaq100 vs S&P 500. Even if both charts observed separately tell us the same story. That we are in a bullish uptrend on the daily chart for the past 1 year. But the ratio chart clearly shows Nasdaq100 peaked out relative to S&P 500 on Aug 2024 just prior to the unravelling of Yen carry trade. Since then, the ratio has not broken to the upside and registered an ATH even if the tech stocks have been doing exceptionally well recently. The ratio of QQQ vs SPX is within a local uptrend but still within the upward sloping Fib Retracement level between 0 and 0.618. The tech heavy QQQ can and will claim leadership once we break out of the range in the upward sloping Fib retracement level and break above the 0.618 levels.

QQQ ending wave 4 wave 5 561.8to 563 max min 553I am now in a 100 % to 110 % long calls position We are only a few hours away from the start of the final 5th wave to mark the HIGH for the YEAR 2025 .I am now working on the spiral date and I am looking for a 3.5 to 6 week rally from this Low Best of trades WAVETIMER

We already bottomed, you just don't know it yet! NASDAQ:QQQ
We already bottomed, you just don't know it yet!
Daily Chart analysis:
A look back at 2024 shows us that every time we have come down to the Green support line on the Wr% we've bounced hard all the way back up to the red barrier.
It coincides with every time we've went below the 9ema that this occurs then we rocket back up. This time could be different but what I'm seeing on the weekly chart as well it doesn't look like it to me as we've already rebound back above the 9ema to this point.
I'm just a nerd who loves all things stock market, I'm no oracle but from my TA and my GUT we should bounce hard heading into the new year and back up to ATH's in January friends!
Not financial advice.

QQQ | Pullback Opportunity with Continued Growth PotentialWelcome back! Let me know your thoughts in the comments!
** QQQ Analysis - Listen to video!
We recommend that you keep this pair on your watchlist and enter when the entry criteria of your strategy is met.
Please support this idea with a LIKE and COMMENT if you find it useful and Click "Follow" on our profile if you'd like these trade ideas delivered straight to your email in the future.
Thanks for your continued support!Welcome back! Let me know your thoughts in the comments!

Nasdaq100 ETF - $QQQ - LET ME TALK TO YA!Nasdaq100 ETF - NASDAQ:QQQ - LET ME TALK TO YA! 🗣️
The charts know better than any FUD FURU just using whatever data to get their point across (metrics, valuation data, economic data, and valuation formulas). Unless you can get everyone on this planet to align to include the charts you or me don't know what this market will do at the end of the day/week/month/year!
Now that we got that out of the way as a follow up to all the fear spreading top callers, lets talk about the charts!
Just like with NASDAQ:AMZN we need to give room for retests, we had an ascending triangle, our H5 Indicator stayed green and so we gave the candlestick and ascending triangle pattern retest some wiggle room! Thus allowing for the bounce off the H5/ 9Ema and breaking back out over top of the pattern which is HIGHLY BULLISH as we have a successful retest now. I expect to claw back to ATH's now very soon!
Williams R% is also respecting the consolidation box and uptrend at the same time as seen on the chart. No bullet points just a lot of words and thoughts! Here's a chart too:
🎯$560
🎯$580
NFA

QQQ - Bullish up to 2026 (Projected: 8% - 35%) Continue to be bullish up to 2026, but short pullback is expected in the coming weeks.

QQQ I Continued growth within the ascending channelWelcome back! Let me know your thoughts in the comments!
** QQQ Analysis - Listen to video!
We recommend that you keep this pair on your watchlist and enter when the entry criteria of your strategy is met.
Please support this idea with a LIKE and COMMENT if you find it useful and Click "Follow" on our profile if you'd like these trade ideas delivered straight to your email in the future.
Thanks for your continued support!Welcome back! Let me know your thoughts in the comments!

QQQ - short pullback, to continue higher based on technicalsQQQ - short pullback, to continue higher based on technicals

$QQQ: The election is over, here is where the markets are going NASDAQ:QQQ NASDAQ:NDX
The charts say we are in a FULL on BULL RUN!
Cup n Handle Measure Move hasn't hit yet at $560, the measure time is out until Feb2026.
Ascending Triangle Breakout is happening now with a measure move to $580 by March2025.
Also, a #HIGHFIVESETUP and why I pointed out that we would bounce on Halloween and hit ATH's this week.
Like and Follow for more setups, we are just getting started.
NFA
#trading

IGV THE BULL MARKET IS ENDING NOWThe chart posted is The IGV index aka the strong leader in the over all market I am now counting a ending 5 wave up I had hoped to see 96handle But TIMING is today from July TOP we are ending a 5 wave Diagonal I have moved to a 95 % LONG IN THE MONEY PUTS IN SPY JAN 2026 600 strike Best of trades WAVETIMER

QQQ UP UP AND AWAY! BULL MARKET JUST GETTING STARTED? PT INSIDE!NASDAQ:QQQ
LET THY BULLS RUN! 🐂
My 2025 EOY Price Target is...🥁🥁🥁...
🎯 $560
Not Financial Advice. 🖖
#QQQ #NASDAQ100 #Nasdaq #Futures #futurestrading #StockMarket #options

Semis may be ready to surge.NASDAQ:NVDA has reclaimed most daily supply and may trade into the earnings high if it can reclaim this week's range. NASDAQ:SMH has similarly reclaimed the daily 50 SMA and will go higher upon confirmation of the daily 100 SMA supply. Higher prices in semiconductors, such NASDAQ:AVGO as well, may help NASDAQ:QQQ follow AMEX:SPY to a new all-time high.
