$QQQ $NASDAQ : WE WILL BE AT ATH'S NEXT WEEK. HERE IS THE CURE! NASDAQ:QQQ NASDAQ:QQQ WE WILL BE AT ATH'S NEXT WEEK. HERE IS THE CURE!
In this video, we will discuss the following
1.) We will look at the technicals and charts while going over multiple indicators and patterns pointing us in one direction on the markets...HIGHER
2.) Stick around to the end of the video as I give you the CURE to the markets' 3-5% pullback from recent highs, which will indeed take us to ATHs next week!
Drop a comment below if you learned something new or want a deep dive into anything discussed in this video today.
Stay tuned for more.
LIKE l FOLLOW l SHARE
NFA
Qqqshort

QQQ technical SHORT opportunityNASDAQ:QQQ is approaching a very strong resistance level, which aligns with both a previous supply zone and a diagonal resistance line. This presents an opportunity for a technical SHORT play. Why do I call it technical? Because the market remains very bullish, with no signs of a broader uptrend reversal—especially following strong earnings from NASDAQ:GOOG . If a sell-off occurs, it will most likely lack significant follow-through. Nonetheless, it’s still possible to capitalize on it
Disclaimer
I don't give trading or investing advice, just sharing my thoughts.

QQQ UP UP AND AWAY! BULL MARKET JUST GETTING STARTED? PT INSIDE!NASDAQ:QQQ
LET THY BULLS RUN! 🐂
My 2025 EOY Price Target is...🥁🥁🥁...
🎯 $560
Not Financial Advice. 🖖
#QQQ #NASDAQ100 #Nasdaq #Futures #futurestrading #StockMarket #options

DIA Support breakdown . US Stock406 below short
405/400 /398 can test easily
support below dia very weak

ARM Short . US Stock122 below weak , already tl break
if yesterday low below sustain then very weak
121/119/116/114/112 target

SPY short into the 540-543 zoneSPY short into the 540-543 zone on the first touch would most likely pay.

QQQ Put & Call case for 8/1/24QQQ along with the rest of big tech has/is looking weak. This has been going on the the last month at least. Weakness to all of these levels. I am trying to stay neutral , but the price action & volume delta/CVD doesn't lie.

ANET H&S Pattern breakdown possible , US Stock325 below strong support break possible
Gap fill possible
322/320/316/313 target
Also form H & S Pattern , IF Breakdown projection level is 275

$QQQ to bottom sub $250?QQQ had an impressive run, however, that run is now over and it's time to look at shorting this thing back into the ground.
As you can see, momentum has already flipped negative w/ the first red weekly heikin ashi candle.
I expect a sharp pullback here into the election and I think we'll bottom under the $250 sometime before the end of the year.
Let's see how it plays out.

QQQ H& S Pattern breakdown possible , US ETF474 below Trendline breakdown possible 472/470/460 can test soon
Also have H& S pattern which have target 440

QQQ, ICT Short Setup, small lot👋Hello Traders,
Our 🖥️ AI system detected that there is an H1 or higher timeframe ICT Short setup in
QQQ for session trade (a couple of hours)
Here is a session trade idea (since it is near support surface, we should use small lot size)
Please refer to the details Stop loss, FVG(Sell Zone),open for take profit.
For more ideas, you are welcome to visit our profile in tradingview.
Have a good day!
Please give this post a like if you like this kind of simple idea, your feedback will bring our signal to next better level, thanks for support!

🌟📉 Short Trading Setup on QQQ Chart—ICT Analysis! 📊💼Let's dive into an intriguing trading opportunity on the QQQ chart with a short setup based on ICT analysis. Get ready for valuable insights and potential trading strategies. 🚀📉
📉 Downtrend Formation:
Upon careful examination, it becomes evident that QQQ has formed a lower high and lower low, signaling the establishment of a downtrend in the H1 or lower timeframe. This bearish pattern suggests a potential opportunity for short trades. 📉🔻
💡🔍 ICT M15 Short Setup:
Delving deeper into the chart, it becomes quite apparent that a compelling ICT M15 short setup is in play. The price action and key indicators align, indicating a favorable scenario for short trades. This setup presents an opportunity to capitalize on the downward movement and potential profit. 💡📉📊
🎯 Target and Stop Loss:
For this short trading plan, we have set a target at $443, representing the level we anticipate QQQ to reach during the downtrend. To manage risk effectively, we recommend setting the stop loss at $448. This ensures a risk and reward ratio of either 1 to 1 or 1 to 1.5, depending on your preferred approach. 🎯⛔💼
Embrace this short trading setup on the QQQ chart, guided by ICT analysis. Remember, trading carries risks, so always exercise caution and diligence. Make informed decisions based on your risk appetite and trading strategy. Let's maximize the potential and aim for profitable trades! 💪💼💹
#QQQ #ICTAnalysis #ShortTradingSetup #TargetandStopLoss #RiskRewardRatio 📉📊💱

QQQ to $392Trading Pattern
QQQ has formed an ascending channel which may prove to be very lucrative for derivative trading. Utilizing Elliott Impulse and Correction Waves within the support and resistance lines, Wave 4 may dip as low as $392 which is a few dollars shy of a 61.8% Fibonacci retracement level.
Technical Indicators
A bearish RSI divergence has been present since the share price surpassed $400; the RSI highs retain a negative slope while the share price highs have a positive slope (both reflected in yellow). This supports the Elliott Wave Theory and ascending channel pattern as the share price is currently at, or soon approaching, the crest of Wave 3 as well as the ascending channel resistance line.
QQQ may experience a slight bump upwards indicated by the RSI line (green) which appears to be close to crossing the MA line (red) from beneath. However, due to its close proximity to overbought territory, I believe selling pressure will begin soon after as might be indicated by the MACD.
The MACD technical indicator shows a tightly wound MACD line (green) and Signal line (red). The MACD line is within dangerous territory of crossing its Signal line from above which is a bearish indicator and suggests an increase in selling pressure followed by a correction in share value.

Nas100 HTF Analysis I expect Nas to reach 17k in the next few weeks. Nas has been pushing up relentlessly last few weeks so expecting ATLEAST a nice pullback. Once we hit 17k tho we could see all time highs again!

QQQ Jan 26th, after the close updateSharing my usual QQQ chart with weekly and daily levels (they get updated every Monday for Weekly and every day for Daily)
#QQQ is in an ending diagonal, bull flagging, so early next week price action is important.
Should break above or fail on a grand scale!
Below 420.50 will trigger a strong selloff down to 412!

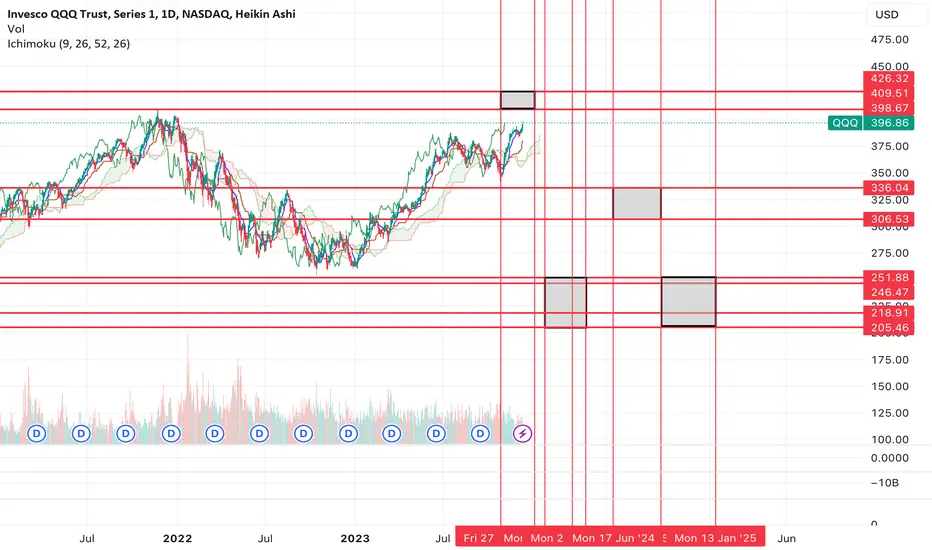
$QQQ 2024 downside price targets + timingIt's very tough to forecast price + time and get the exact timing and price targets correct. However, I'm going to attempt to do so.
Over the next year, I expect NASDAQ:QQQ to fall somewhere between 35-50%. If the move that I'm expecting plays out, we'll be right around a 50% drawdown from the current levels.
The chart attempts to forecast time and price levels that are important over the coming year (2024). Each grey box represents a price level that should get hit within that timeframe.
Again, this is extremely hard to do accurately. Often I do these for myself just to try to anticipate large changes in trends, but I thought I'd share this publicly as it would be fun to follow along over the next year.
Essentially what I'm forecasting is one more move up before the end of the year. It should happen before Christmas, but I'm allowing myself some extra time.
Then Q1 should be extremely bearish for the markets with the largest leg down during that time. There are two scenarios that I'm looking at. Either we hit the lower targets all in one move $205-218, then bounce afterwards (this scenario would be the bottom), and we'd retest that lower range in Q4. Or, we hit $246-255 and then bounce into Q2 and fall further in Q4 marking the final bottom.
Regardless of which one plays out, you'll want to buy equities in March/April and then again in October/November.
Q2 and Q3 we should see a bounce where you'll likely want to take profits on the way up.
Let's see if it plays out as anticipated.
QQQ NEW LOWS INCOMING!Hello, fellow traders and investors! There has recently been a leg up in our bearish channel creating what we anticipate to be a lower high. There is plenty of uncertainty in the economy at the moment whether it be the wars in Russia/Ukraine or Israel/Palestine, upcoming interest rate decisions, the fed's approach to their balance sheet and applying quantitative tightening, etc...
All that to say Rise Capital believes we are at overbought levels and are actively pursuing strategies to take advantage of the bearish movement that is soon to come. We will be taking different approaches like shorting qqq, getting put contracts on qqq and buying shares of sqqq.
SHORT QQQ
Entry: 367.71
Take Profit: 342.20 (Partial profits can be taking off depending on price action)
Stop loss: 373.75
Risk/Reward: 4.3

QQQ/IWM Pair trade correction ideaRecent bearishness on the QQQ, think it is time to be bearish on the QQQ and bullish on the IWM. If you know how to do pairs trading there you go, if you don't this a good one to practice on. Also check out NDX/RUT for longer term data.

QQQ Supply/Demand ShortQQQ and the market have had a really good rally this morning, but right into some supply levels. IMO, this is a good spot to short for a gap fill.

Michael Burry Executes Massive Short of SPY and QQQIntroduction:
In recent news, renowned investor Michael Burry has made waves by executing a massive short of the SPY (S&P 500 ETF) and QQQ (Nasdaq 100 ETF). Burry's move has garnered significant attention, raising concerns about the future performance of these major USA stock market ETFs. This article aims to provide traders with a cautious analysis of the situation and present a call to action for those considering shorting these ETFs.
The Burry Effect:
Michael Burry, famously known for his accurate prediction of the 2008 financial crisis, made a bold move again. By shorting the SPY and QQQ, Burry is signaling his belief that the current market conditions may be overvalued or potentially face a correction. Traders should take note of his historical accuracy and consider the implications of his actions.
Understanding the Risks:
Understanding the associated risks is crucial to approach any investment decision thoroughly. Shorting ETFs like SPY and QQQ involves betting against the market's overall performance, which can be highly volatile and unpredictable. While Burry's track record is impressive, conducting independent research and analysis is essential before making investment decisions.
Considerations for Shorting:
1. Diversification: Traders should ensure their portfolios are well-diversified, spreading risk across various asset classes and sectors. Shorting ETFs like SPY and QQQ should be considered a strategic move within a broader investment strategy.
2. Risk Management: A clear risk management plan is crucial when shorting major market ETFs. Setting stop-loss orders and regularly monitoring positions can help mitigate potential losses.
3. Expert Advice: Consult with financial advisors or professionals specializing in shorting strategies. Their expertise can provide valuable insights and guidance tailored to individual trading goals and risk tolerance.
Call-to-Action: Proceed with Caution
Considering Michael Burry's recent shorting activity, traders are encouraged to proceed cautiously when contemplating short positions on SPY and QQQ. While Burry's reputation for accurate predictions is noteworthy, conducting thorough research and analysis is imperative, and assessing the potential risks and rewards associated with such trades is imperative.
Ultimately, the decision to short these significant USA stock market ETFs should be based on an individual's risk appetite, investment strategy, and market outlook. Traders should carefully weigh the potential benefits against the inherent risks, seek professional advice, and consider alternative investment options.
Conclusion:
Michael Burry's massive short of SPY and QQQ has undoubtedly sparked interest and raised questions among traders. However, it is crucial to approach such investment decisions and conduct thorough research cautiously. By considering the risks, diversifying portfolios, and seeking expert advice, traders can make informed choices that align with their individual trading goals. Remember, shorting major ETFs is a complex strategy that requires careful consideration and may only be suitable for some.

QQQ - Short Scalp OpportunityThe NASDAQ:QQQ Chart is currently displaying signs of bearish harmonics, a pattern that may suggest a downward trend. Specific downside targets, along with the stop-loss (SL) value, have been detailed on the chart for your reference.
Please proceed with caution and trade safe!

$QQQ top?NASDAQ:QQQ looks to be putting in a top here. If it holds, I think we have a long way down to go.
I think we'll surpass last years lows and end up somewhere around the $200 range (where the green supports are).
Let's see how it plays out over the next 6 months to a year.

QQQ: I might be wrong (Inverted Chart)I have been a staunch bear since about March. Since the lows expected a nice bounce but that we would resume
the downtrend at some point. Nothing has convinced me that this market would not do anything besides have another
period of pullbacks, until I inverted the QQQ today. From this perspective, I cannot help but see the very real possibility
of a double top at the very least. At that point though, there is no reason we couldn't keep going and make new highs.
The macro economic conditions are not ideal in the slightest but this might be the kind of bull that is largely absent retail
and will say that way until we actually start to top. A bull, minus retail, is what this looks like. You are not having investors
capitulate easily at all. Buyers have been positioned large and they plan on staying there for a while. Very hard to say.
This is by far the hardest market to judge, that I personally have participated in. I am thinking about taking some long positions
in certain companies, maybe even the Qs but I will be doing so cautiously.
