Another good entry point to short QQQ $QQQAnother good entry point to short QQQ -- Around $5 down
Please refer the chart
Will finish wave 5 of wave 1 down after this move.
Qqqshort

#QQQ testing critical support after price reverses to downsideHello all,
#QQQ local uptrend has finally reversed to the downside after gapping down over the weekend and is currently testing a support level. Should be an interesting week ahead. Share your thoughts with us on what you think will happen next and why?

Dollar and treasury yields are back on the marchU.S. Treasury yields moved higher on Friday to their highest since July 21 and U.S. stock futures fell by almost 1%, along with similar losses in Europe. The yield on the benchmark 10-year Treasury note was up 8 basis points at 2.967% as the Fed indicated July meeting minutes that it would continue hiking rates until inflation slows down significantly, although the central bank could soon decrease its pace of tightening.
The 10-year Treasury yields above its 100-day exponential moving average, yields may extend its strength to 3.00% mark with the dollar's rally.

QQQ - Bearish Channel Thesis based on banker candlesThis post is a test of my thesis that I can accurately identify a banker's candle that tests market structure. The Thesis works like this:
Bank trading firms need to test the market structure with specific actions on specific days that tell them what the market can tolerate and they base their plans accordingly.
For instance if banker candles identify a market structure that can trend down for a certain trend, they will then execute that trend line selling the appropriate volume and delivering the correct price.
This means if such candles can be confirmed - then the trend channel can be inferenced.
This is a test such that I am predicting the next banker candle (all concepts are marked with green arrows) and that it will be confirmed by testing the trend line at the 9daily MA.
Then QQQ will roll over testing the 200daily MA into the Channel.
A 5 wave impulse (Elliot Wave) is then likely that will take the price to both retest the 200daily MA, the new "lower low" that marks a "safe entry" and confirms down trend, before then retesting the 50day Moving Average.
The low of wave 3 was selected to hit prior highs of the accumulation phase that led to the recent rally (the Bulkowski pennant seen early July).
Entry may begin at the 200daily MA if conditions are right. (If slow stochastic falls below 80 at least).
We have 2 probable banker candles, now waiting on a 3rd to be confirmed. Good luck!

Bearish Rounding Top w/ Inverted cup and handle set up..Looking to short in two spots. 1st is from C wave $324. I would like to see at least 3x rejections before shorting..
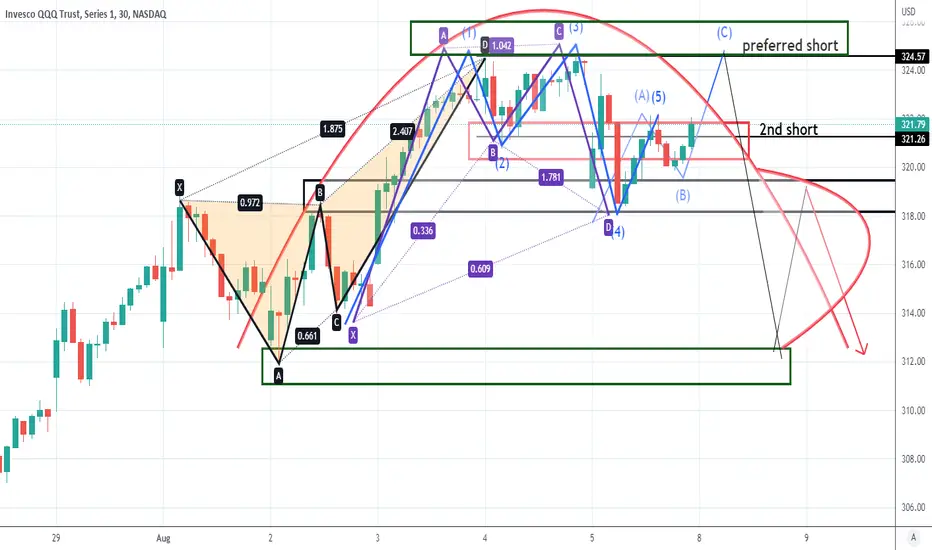
An interesting look at QQQ. This is not financial advice. Just an observation of QQQ since June 16th. What do you think happens in the market over the next week?

QQQ SHORTReasoning explained in the chart:
1. MACD and RSI divergence
2. Finishing of wave B and major fib level
3. Price hitting the upper end of the channel.

$QQQSTILL A BEAR. WHY?
Let me tell you one thing on my thesis why I am a bear. QQQ trend is still a downtrend; looking at economic events, it's weak.
- First, the Fed tried to tell us inflation was "transitory."
- Within a year, inflation hit 9.1%, a 42-year high.
- Then, the Fed tried to tell us that a recession was "unlikely."
- Now, we officially entered a recession.
- You are witnessing the most significant failure by any Fed in history.
Reference:
The Kobeissi Letter
"BREAKING NEWS: Q2 GDP unexpectedly falls by -0.9%, officially putting the U.S. in a recession."
My thoughts on technical trading. 4hr chart screaming overbought with QQQ sitting on resistance with regression trend showing overbought signal. Also, there has been a history of 50 SMA as support/resistance (which can be seen highlighted yellow circle)
Also, keep in mind bond rate is decreasing. Meanwhile, FED is increasing the interest rates to control inflation. This is called recession. ASK YOURSELF BEFORE GOING LONG HERE. IT'S BEEN ALMOST 12 YEARS OF BULL RUN WITH DIP THEN RIP AGAIN. THAT'S NOT A BEAR MARKET AT ALL; ITS STAYS more than six months. Plus, commodities going up is also a signal of recession.

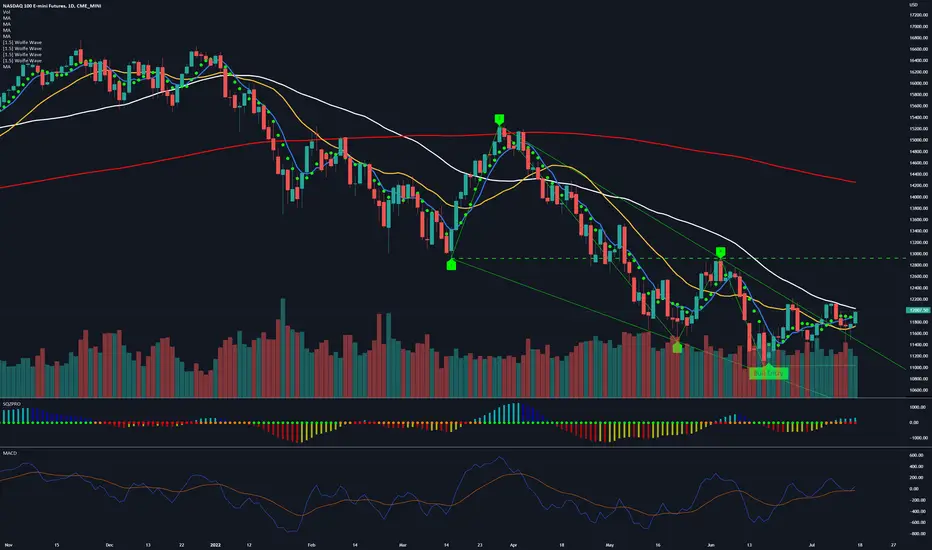
NQ breakout attempt Number 1In tandem with SPY , there is an agreement between the two major index that may be worth considering into the last half of the year. There is a daily wolfe wave setup , which triggered 4 days earlier than the SPY, on June 17 closing day at 11296.75. The projected target is calculated by extending a linear line between pivot 1 and 4 and projecting the line. This is represented as the green perforated line, as shown in the chart. The projected target is 12942which is expected to reach this price target before Oct 10. Projected targets are defined by identifying the apex of the wolfe wave and projecting a vertical line toward the green perforated projection tgt which is extending from left to right.
Head and Shoulders on NASDAQ ChartHead and Shoulders on NASDAQ chart (mirrors Inverse H&S on DYX chart).

It went really good SQQQ Shut up to yhe moon with the CPI Numbers
I'm expecting to continue the rally.

QQQ fakeoutI expect a potential reversal to $287 before going lower this year, around the $250 area.
The chart is forming a massive falling wedge.
Looking forward to read your opinion about it.

QQQ Fed Rate Hike is Coming on June 15!If you haven`t noticed Jamie Dimon`s prediction:
Then you should know that The Federal Reserve is expected to raise interest rates by a half of a percentage point for the second consecutive time on June 15.
More rate hikes are likely in the coming months because consumer prices rose 8.6% YoY through May.
Inflation is at 40 year high!
Jamie Dimon, the JPMorgan Chase CEO:
"Right now it's kind of sunny, things are doing fine. Everyone thinks the Fed can handle this." "That hurricane is right out there down the road coming our way." "We just don't know if it's a minor one or Superstorm Sandy. You better brace yourself."
Jamie Dimon is predicting an economic "hurricane" caused by rising inflation , interest rate hikes and the war in Ukraine.
If oil reaches $140 - 150 this year, then this is the strongest sign of a recession or if China invades Taiwan.
Looking forward to read your opinion about it.

QQQ PutQQQ has been in a downtrend since the start of April along with SPY, BTC, US30. The market is clearly crashing, I believe QQQ will fall to $285 - $293 zone and create a small rally after. Im looking to pick up QQQ $288 Put Expiring 5/13, the current price of the contract is going for about $245-250. Once QQQ hits my zone I will then look to pick up some short term calls.

QQQ more done side coming?$QQQ has been in the down side for the past few days after rallying for 12 days straight. this is expected after the long rally. but this down side might continue.
this is due to tech stock taking a beating putting QQQ in a sell off.
also with the concerned about geopolitical issue in Russia and Ukraine war and Europe possible comic slow down putting indices in roller coaster ride.
below is my ideal entry for day trading or scalp play. $QQQ average move per day is about $5.00-6.00+ a day.
QQQ: Day trade or scalp target play: 04/11/22
Buy call above 341.36 sell at 344.20 or above.
Buy puts below 336.44 sell at 332.44 or below.
option open interest: ideal expiration date: 4/29/22 5/20/22 & 6/17/22
Hello everyone,
welcome to this free technical analysis . ( mostly momentum play )
I am going to explain where I think this stock is going to go over the next day or week play and where I would look for trading opportunities
for day trades or scalp play.
If you have any questions or suggestions which stock I should analyze, please leave a comment below.
If you enjoyed this analysis, I would definitely appreciate it, if you smash that LIKE button and maybe consider following my channel.
Thank you for stopping by and stay tune for more.
My technical analysis is not to be regarded as investment advice. but for general informational proposes onl

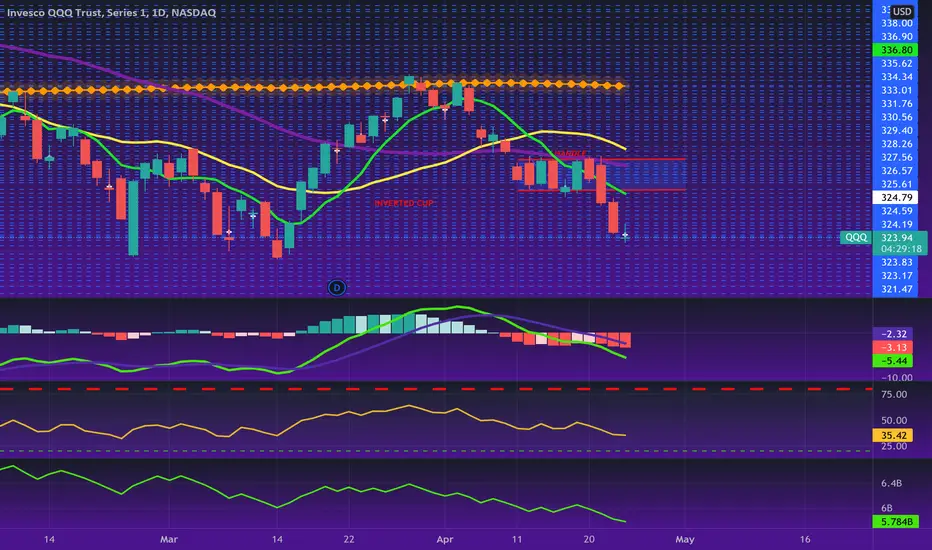
QQQ "Inverted Cup & Handle" Pattern
Inverted Cup & Handle pattern on QQQ's daily chart.
*This post is not financial advice.
QQQ: Buy Zone is 349-354QQQ is working on an impulsive 5-wave move off the March 14 low. Right now, we have completed 3 waves up. I would like to see one more micro push higher to make the count look more complete. I am targeting the .382 - .500 fibonacci retracements for this pullback. Bearish divergences in MACD and RSI indicate that this uptrend is becoming exhausted and needs time to rest. This should be a very strong year for QQQ.

QQQ 100 & 200 MA shortGonna trying this short on the QQQ since it just got to it's 100 and 200 daily MAs. Market has been strong over the past 2 weeks, so kinda thinking its over extended. I'm picking up put options for May. If we get down to the 10 EMA daily, I might just close it and wait to see what the market is going to do.

QQQ Retracement Projection: Is $180 Realistic?$QQQ is heavily weighted towards risk-on technologies.
Inflation is soaring, dovish Fed with loose monetary policies is not sustainable in the face of CPI/PPI/Commodities/etcetera reflecting an unhealthy market with price increases not seen in 40 years.
Previous significant correction benchmarks:
1. 2020 global pandemic from local high to bottom took 30 days with a -30% retracement. The recovery was limited in depth and and time due to fast stimulus response by government that has led to part of this inflation challenge
2. 2008 housing market bubble took 390 days to bottom out with approx 55% retracement
3. 2001 dot.com took 930 days to bottom with 84% retrace
Of note, the dot.com recovery for NASDAQ took 15 years and was supported by unfettered government quantitative easing.
The long-term channel bottom for QQQ aligns with the 55% correction level that took 390 days for the housing market.
QQQ Price Target at this level is approx. $180

$SQQQ Inverted head and shouldersInverted head and shoulders has a price target of $63. ProShares UltraPro Short QQQ (SQQQ) is a 3x leveraged inverse ETF, so be prepared for a very volatile ride on both the up and the downside.

BEARISH on QQQ todayI BOUGHT A PUT OPTION on #QQQ WITH A $349 STRIKE PRICE AND 3/4 EXPIRY...ALREADY IN THE MONEY... HERE'S WHY I ENTERED THE TRADE...
#QQQ opened higher than yesterday's market close. However, I believe this is a bull trap. Price is pushing against major trendline resistance and the stochastic indicator on 1HR and 4HR charts reflects QQQ in overbought territory.
My theory is that there is way too much bearish news in the marketplace for tech stocks to break resistance and go on a major run.
Do you agree or disagree? Let me know in the comments!

$QQQ is Ready for Correction NASDAQ:QQQ
Since tech leads the rest of the market and the rest of the market looks clearly ripe for correction, it's obvious to short $QQQ. As a chaos theory enthusiast, it is of my belief we do an analog of the correction and run-up of 2020, in 2021. It's that simple and shouldn't be over complicated.
With that said, history only repeats itself until it doesn't. Barring any major black swan or trend changing event we should see $401 to the pip by September 5th. Book it.
- PennyBags

2/21/22 MSFTMicrosoft Corp. ( NASDAQ:MSFT )
Sector: Technology Services (Packaged Software)
Market Capitalization: $2.159T
Current Price: $287.93
Breakdown price: $286.00
Sell Zone (Top/Bottom Range): $297.00-$312.00
Price Target: $276.00-$274.40 (1st), $233.00-$230.50 (2nd)
Estimated Duration to Target: 28-30d (1st), 68-71d (2nd)
Contract of Interest: $MSFT 3/18/22 280p, 6/17/22 260p
Trade price as of publish date: $7.20/contract, $9.97/contract
