NASDAQ(QQQ) WILL FALL FROM RESISTANCE|SHORT
NASDAQ index , represented by the QQQ ETF chart in this post
Is trading in a rising channel
Looking at the price-action within the channel
We can see a bear flag forming
Therefore, I think that after a final push Up
And retest of the resistance
The flag will break downwards
And fall to retest the channel support
Short!
Like and subscribe to never miss a new idea!
Qqqshort

Triple QQQ Triple Color Fractal Frenzy I started looking back for areas in time where the volume profile specifically looked very similar.
We've kind of got an interesting volume profile going on right now with recently almost all buying volume and a very clean diminishing buying profile followed by a sudden approximately double selling volume from the next most recent candle.
I pulled those fractals I found where the volume profiles looked the most similar and scaled them to fit the most recent moves.
The dates are kinda fuzzy cuz I wasnt paying close attention but the general time frames are there if you want to look.
The yellow fractal seems interesting as once I scaled it to fit the most recent activity its peak hits the channel and its pull back lands almost right on the dotted support line.
Which fractal will it be!

QQQ continues descent to September lowsQQQ, along with the rest of the market, has been in a bearish trend since mid-October. The factors that pushed this bear trend, namely the covid third wave and lack of another fiscal stimulus remain the key factors. As such there's no stopping the market until the next major support levels formed in the September market decline.
For QQQ that gives us a target around $260
There should be an opportunity for entry via a continued correction from Friday's dip until 271.80 or so. But the pace of the move is unpredictable and so is the timing which may happen pre-market.
Stop is at 50% of prior Thursday/Friday's move at $273.
Happy Trading!

QQQ heads to $270QQQ started a rapid correction this afternoon after the government fiscal stimulus talks fell apart.
QQQ finished its first wave extension to 274. The second wave extension remained unfinished after-hours in its wave 5 and should resume in the morning.
Our target is the third wave extension to $270, which is 161.8% of the first wave.

Nasdaq could see some buying BEFORE BEAR MARKET! Nasdaq was the leading index this year and we found out why pretty recently. The FAANG index was being propped up by nonother than SoftBank with a $5Bn options positions on big tech.
SoftBank got their hands on OTM calls for big Tech which did a few things:
1) Forced the options market makers to hedge the position against them meaning they had to buy the stocks. Tying up about $50 Bn in shares on the big Tech companies. This alone pushed US Tech stock prices higher.
2) Created interest in order flow for large traders that saw the options interest and the transaction quantity somewhere OTM on big Tech which caused buying to take advantage of the potential move higher from the big fish.
3) Caused a rally in tech and piqued the interest of a lot of traders that saw tech stocks rallying, jumping in blindly, or calculated entries for the continued push higher.
Which means the recent sell off was profit-taking from Tech and understanding what had happened and selling. To return major stocks to "value"
That caused the Nasdaq to drop nearly 15% from its highs and it seems that there is more downside to come out even though it seems that the support is being held up for now. Support is now at $260 and the 100-day moving average is very nearby.
If this level breaks we're going to see a temporary bear market in the Nasdaq, as we saw the year prior. We could see a pop into $280 on QQQ before we get the downside though! There is a key resistance there. under $260 and the 100-day MA we will see a big sell stop run into the prior broken top and volume profile block.
The volume is worth noting as well, it's decreasing on every rally. Most recent rally at least, with big sell volume. this is a bear sign.
This is an idea, for educational purposes, that doesn't constitute investment or trading advice.

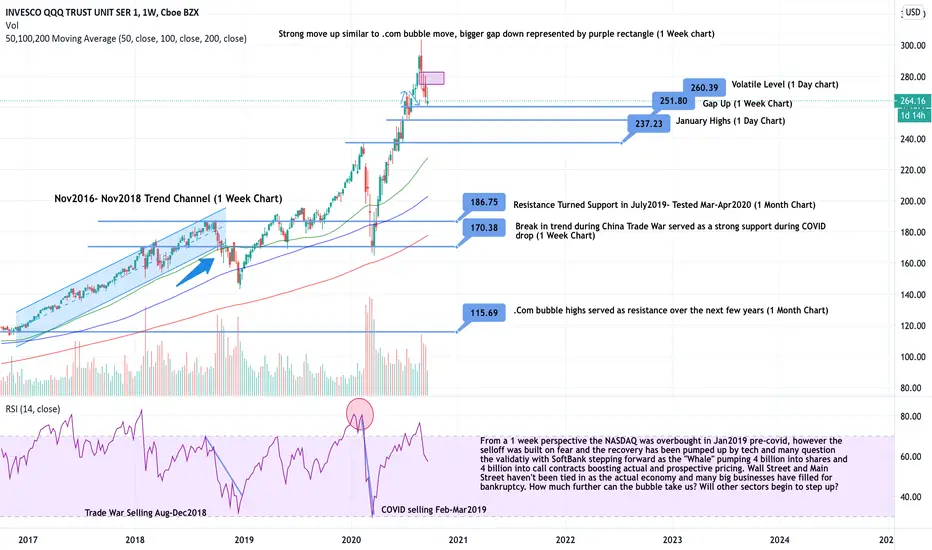
QQQ All-Time LevelsIn an uncertain market it is hard to find footing. NASDAQ:QQQ is currently testing a jumpy support level right now. The biggest factors that will play into the outlook of the NASDAQ and the market as a whole is government stimulus and the upcoming election. Many analysts are comparing this years election to Gore-Bush election and the uncertainty could be detrimental for our market. If support begins to break and there is no positive news on a COVID vaccine, QQQ could face some major downside before leveling out. Many analysts have also compared the boom in tech "post-COVID" to the .com bubble in 1999. Furthermore, the news of Europe begining to take preventative measures is creating more fear globally. If the market doesn't quickly move to fill the gap down or support is broken there is room for a lot more sell-off. It's a long way down.
Head and shoulders target on QQQThere may be a bounce for a week or so but in general, I see this playing out to about 240ish (or the 200 ma) before a larger counter rally. If the channel doesn't hold, we're looking at 220 area.
I think the high is in, but the unwind may take time.
Good Luck


QQQ to $260After a brief 2 day rest, QQQ looks to continue bearish run as it still remains below daily moving averages.
We just had a hourly 13 EMA/30 SMA crossover, which confirms a sustained bearish move.
Our intermediate target is $264 but we're really shooting for the previous low of $260 from 2 days ago.

QQQ continues correction to $257Revisiting a previous idea that kept finding resistance at $267, which was finally cleared today.
After retracing today's move a bit, next week QQQ looks to continue correcting to its next target $257, which is a strong support and 61.8% of the Corona rally since March.
Stop is a strong and convincing move above the previous $267 resistance.

QQQ falls to $258QQQ breached the 30 day SMA again today (see arrow). It is now retesting the 50 day SMA it bounced off earlier this week.
If the 50 day SMA is breached, our first target is $258, which is 61.8% of the move of the Corona rally since March.
If that doesn't hold our next target is $243, which is 50% of the Corona rally.

QQQ - Major Bear Trap IncomingGood Morning Traders,
We had a nice bounce in the market wednesday morning leading up to thursday premarket trading session.
However we haven't seen it hold well at those upper levels at $280-290. Yesterday's sell off was due to stimulus bill not getting passed + crash of the pound currency.
Although we're ultimately bullish on US equities, we're expecting some more volatility in our trading sessions the next few days.
QQQ currently headed towards our resistance. We think that the market might try to bring on more sellers. We may be visiting our recent lows a few more times before we make the full bounce (or even quick flush lower).
Sell the rip type of mood today.
We play what the market gives us.
*NOT A FINANCIAL ADVICE, THIS IS JUST OUR PERSPECTIVE AND WE DO NOT RECOMMEND ANY TRADES WE PUBLISH ON OUR CHANNEL. YOU WILL LOSE MONEY.

QQQ ready to retrace on Fed minutesAlong with the rest of the market, QQQ started a correction at 2pm today after almost completing a wave extension.
I believe the bearish momentum continues because the ticker crossed bit 13 period EMA and 30 SMA averages. It also breached support at 276.64.
Target 1 is at previous support at 274.75
Target 2, if profit cashing continues, is at next support around 273

Nasdaq/SP500 big picture road mapI tried the chart be as obvious as possible. pay attention and have this picture in your mind

QQQ outside of the multiyear trendline...awaiting reversalQQQ ahead of itself.. outside the upside trendline & Bollinger band stretched. Divergence on RSI weekly. Need to revert to the mean/average. Correct -10% in the next 3-4 weeks.

💵 Attacks Major Level Of Resistance (QQQ)💰 LET'S GET INTO SOME QQQ ETF ANALYSIS!💰
1️⃣ First off SMASH that LIKE BUTTON & Give us a FOLLOW for DAILY ANALYSIS! ❤❤❤
(Overall Market Sentiment) Neutral 🤷♂️
- 3day Chart
- Green Engulfing Candle
- 3/3 EMA DOTS Green
We are aware on the 3day on big players like the DOW and SPX500 we are starting to see potential shift for selloff as they start to compress and shift red, but we won't have a close till the end of the week. QQQ is still firing massive green candles with all indicators still green. This week close and next week should show us a nice trend reversal range to watch closely on the market to see how we approach for a longterm play. What can we take into consideration for potential bear signs. We are entering into overbought territory based off the bottom indicator and we can take into consideration that we are now hitting the top of the alltime upward Resistance from all major market structures.
Best of luck to you and all of your trades this week! 🤜
Drop your charts and comments down below, share with us what you think is going on in the markets! ❤❤❤
Thanks for checking out our analysis! ✌😁✌
🥇MLT | MAJOR LEAGUE TRADER

QQQ short positionI am usually long-only and either hedging or exiting the market during times of volatility and using a rules-based semi-passive strategy, so taking an outright short position is unusual for me. Posting it publicly to see how it'll pan out.
Main thesis is that:
1) The bull case for the QQQ over the past decade is largely based on momentum rather than growth. Most of the outperformance vs the SPY is based on expanding PE's. This is fine, a momentum trend can last for a long time.
2) Looking at a log chart, we are currently at the top of the 10-year channel and above the top of the multi-decade channel. This limits short term risk exposure unless you assume that the QQQ will go outright parabolic.
3) Considering that we are likely to see continued negative earnings growth due to the coronavirus recession over the next few quarters, a number of other bad medium-term macro factors for tech such as the ending of the H-1B program, and a widespread sentiment that this is a bear market rally, I am assuming that the worst case scenario in 2) is unlikely.
4) With VIX ETN's getting delisted and bonds at extremely low yields, there are very few hedges left, so long/short positions are becoming increasingly attractive.
As such, betting on a mean reversion of tech over the next couple of months should be relatively safe. Hedging it with long exposure to other US equities.

sqqqLooks like the bulls have about 2-3 weeks left. Really just depends on the squeeze that is probably coming. Their will probably be record numbers of degenerates shorting 9600-9700 NDX which will ofcourse lead to a squeeze that sends the NDX100 up to like 10k B4 finally dumping back to 8400 or the 200 D1 ema

Nasdaq (QQQ) ready for short in big pictureElliotte is getting completed (last wave). then based on momentum will go at least to fib support which is HMA143 support as well.

The Nasadaq Looking very Promising for shortMonthly Chart :
The price broke down the MUT (Major Upper Trendline) what lasted for 10 YEARS :
Moreover, The Price found Resistance on that MUT, and on the old Resistance Area between 186-192.
Note the Weekly Chat :
When you move into Daily Resolution , we can see clearly how the Buyers Failed to hold the Price above the MUT , and therefore, showing weakness :
Shorts can be launched at the current trading zone. But we have to calculate the risk in relation to the coming week open
The Main Profit Taking Target is - 143
