QTUM longSo QTUM has drawn a nice falling wedge and right now it broke up.
As you can see on the 1hr chart, it has already checked its old resistance as new support and it went well.
So what I´m expecting is a move north.
My price target is above 9 maybe at 9.5-10...¨It all depends on volume and ofc BTC...
Qtum


QTUMSince this past crash we all experienced last night, the only coin that seems to be recovering and bouncing up better than any other coin is QTUM.
It's trying to break a resistance right now. if it does, I've pointed out 2 TP areas for you guys to set up your positions.
So far it has moved up about 10%, and I think it has the potential to do more.
⚠️ NOTE: This usually happens when a coin gets hot on crypto platforms: it might go down by a little and then get back up to a new high.
Good Luck 🎲
Tell me your ideas. Like and Share 🗣✅

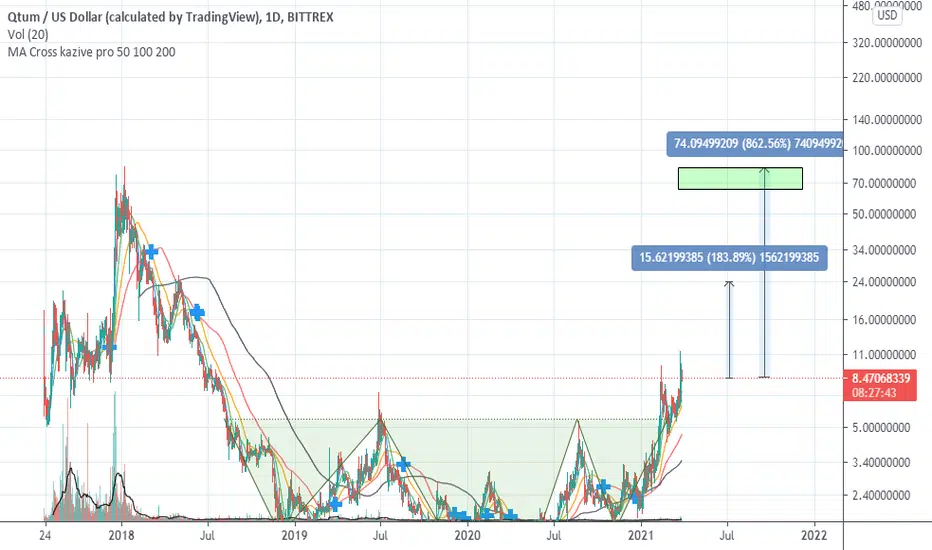
#QTUM Possible targets for 2021#QTUM Possible targets for 2021 with head and shoulders pattern
TARGET1: 9.5 $
TARGET2: 20 $
TARGET3: 45 $
TARGET4: 120 $
STOPLOSS: 3.7 $
Upon reaching each new target, the previous target should be considered as a loss limit.

🔥 QTUM Bullish Triangle BreakoutFew moments ago QTUM broke out of the triangle in which it has been trading for almost a month. It found strong resistance around the $7.50 area, which has now finally been breached. Seeing the strong sudden influx of buyers I'm expecting the price to fall back towards the $7.55 area, which now functions as a support. If bullish pressure continues, we might see a new ATH soon!
Happy trading!

QTUMBTC Squeeze The BTC getting weaker soon, if this not ready then it will be soon.. might have one more wave to the down said, bullish wave is near ,,

QTUMUSDTPossible buying zone were in the red elipse zone. But still can try to catch good entry. Use the limit order if you want to try to be IN.
Danger: I don´t like Monday trades - waiting till Monday afternoon (CET). Because Monday was couple of time full of blood in crypto.
First TP: 0,8 usd - we´ll se what happen later.

QTUM/USDT VERY SOON MOON 5xTHE WEEKLY LOOK ALSO HAS A SHOULDER HEAD AND SHOULDER FORMATION AND BROKEN
IF YOU LOOK WEEKLY AS BTC, THERE IS A FALLING TRIANGLE IF IT BREAKS IT IS AT LEAST 5X

9$ Minimum Objective QTUMBreakout of descending trendline with triangle consolidation:
Minimum objective historical maximum 8.8$
Minimum triangle objective 9.5$
Maximum triangle objective 11.3$


QTUM is close to a symmetrical triangle breakoutYellow line is short term and white is long term. Looking bullish

QTUM USDT LONG SIGNAL- QTUM : Hard Fork Launch
-Wait for the candle to close above the blueline with good volume.
-you can follow the analysis on 1H or 2H timeframe, but the important is the volume.
-Go step by step.
*NB:BLUELINE: entry level
GREENLINE : take profit
REDLINE: stop loss

$Qtum longQtum tested long torm downtrend and now breaking out of Invert head and shoulder. Soon 13$


My short time prediction for QtumOk there are 3 steps
Green line we need to see a double bottom (small one)
Yellow we go down to shape second double bottom and then go up to resistance line
Blue : if we look at the left side we see small shoulder and double head so i believe we need a small other shoulder in right side to shape reversed head and shoulder
These are 3 steps Qtum can be saved


QTUM heading northQTUM has been oscillating nicely within this pitchfork. Looking for it to extend again to the upper bounds.

QTUM/USDT - Possible Bullish BreakoutHello traders and community, today we will tell ourselves shortly about the situation of QTUM/USDT
Trend analysis
- As you can see from the QTUM/USDT daily chart, the price of QTUM is moving in symmetrical triangle (white zone) and that's why we can expect with 60 % probability bullish breakout in the following days (white line on the chart). I recommend to wait for good signal before putting trade position and after it confirmes you can put position up to 7,476 price level. As another scenario we will drop approximately to 5 price level. Today's resistance level (red line) is on 7,476 price level, support level (green line) is on 5,947 price level and global trend stays bullish. Wish you good trades with this pair!
Chart pattern
- Symmetrical Triangle (approved)
Technical indicators
- RSI: market is still in boarders and is located near 54 level (not overheated, Neutral signal)
- MACD: MAs are stabilized + they started moving closer to each other (Neutral signal)
- BB: Volatility of the market started stabilizing after volatile movement accomplished (Neutral signal)
- MA (10,20): MA10 is above the level of MA20 and moving upward (Bull signal)
= Overall neutral signal movement
Dear friends, please push the like button, write comments below, follow me for more technical analysis and share this post with other traders - that would be the best support, Thank you for your attention!
Tell us about your opinion for making better decisions :)
P.S.: Information provided is only educational and should not be used to take action in the market.

Does QTUM/USDT bullish flag and +HD make enough sense ?Hi every one
QTUM / TETHERUS
the QTUM/USDT has a bullish flag pattern which has already experienced upward break out and also there is a hidden bullish divergence (+HD) on both MACD and RSI indicator now we can come to a conclusion that the price can increase as much as the flag pole so there is still time to get profit from this situation!
Traders, if you liked this idea or have your opinion on it, write in the comments, We will be glad.
Things can change...
The markets are always changing and even with all these signals, the market changes tend to be strong and fast!!
Thank you for seeing idea .
Have a nice day and Good luck

