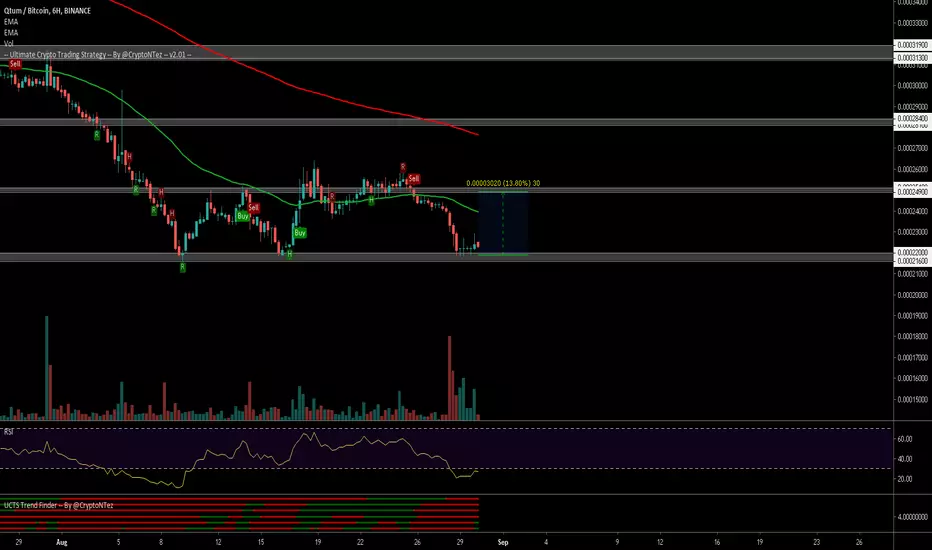
$QTUM, Sitting over support at ~22k Sats...$QTUM
Sitting over support at ~22k Sats, previous iterations with this level lead to a bounce back to 25k sats (13% movement)
RSI at oversold levels (leaving this could be a first signal)
Volume started to show good activity (Volume preceeds price)
#QTUM
Qtum
QTUM (QTUM/USDT, 1D): The Price Is Forming a Bullish WedgeThe price is forming a bullish wedge right now. Green lines are support levels, red lines are resistances. Better split your buy orders and buy it partially, because no one knows, when the coin decides to change the trend. Zones of interest and targets are on the chart. Good luck everyone!

Qtum (QTMUSD) long.All description on the chart.
Please, don't forget to like and follow.
Thank you.


QTUMBNB window presents opening as altseason wraps upBTC is starting to rally & the consolidation may lead to continuity but for now we're seeing the king retake it's place up on the throne where it belongs...its times like these, when more volume is swapped within a matter of minutes than you'll see during a matter of days-weeks in some bear runs with nonstop sideaways priceaction, where you have to be disciplined & take a breath.
Admittedly I should be taking my own advise; though I do often get ahead of myself. I usually don't bother making a publication as I have to monitor my portfolios in real time, but I spotted this one opening that I would be remiss not to share with ya'll as it is quite a good one if you can make your entry/exit in time; accordingly and contingent on the volume, priceaction, and overall market conditions leading to BTC juxtaposed to altcoins; pairings like this are much harder to spot especially when markets are in reversal/retracement.
With that being said:
TP1: 0.09745 (conservative)
TP2: 0.10503 (aggressive)
STOP : 0.09050
ITS CRUCIAL that you set STOP losses first & always during moments like this. However, given the huge volume surge; a great opportunity to snipe some extra BNB is present; it's up to you and ONLY you to make the decision whether or not you should seize it. The window is closing, though I would not make any rash decisions...just do your own TA & follow your own head/analysis, I'm simply here to point out the surge in volume & the candlestick projection analytics as presented by the charting above.
DISCLAIMER:
TRADE SAFELY! PLEASE DO HEED MY WARNING! MARKET VOLATILITY == HIGH!! DO NOT INVEST/RISK (same difference) A PENNY MORE THAN YOU CAN AFFORD TO LOSE! Don't be the idiot who mortgages his house or takes out a bunch of loans/credit cards to go allin FOMO on a bullrun. Trade with your head, not your gut; read my Linkdln article for more on that.
- @a1mTarabichi

Qtum Buy Setup- Price is now going with dynamic support.
- Expecting its boom soon.
- Try to take entry at 250-253.
- Take profit at 275-284

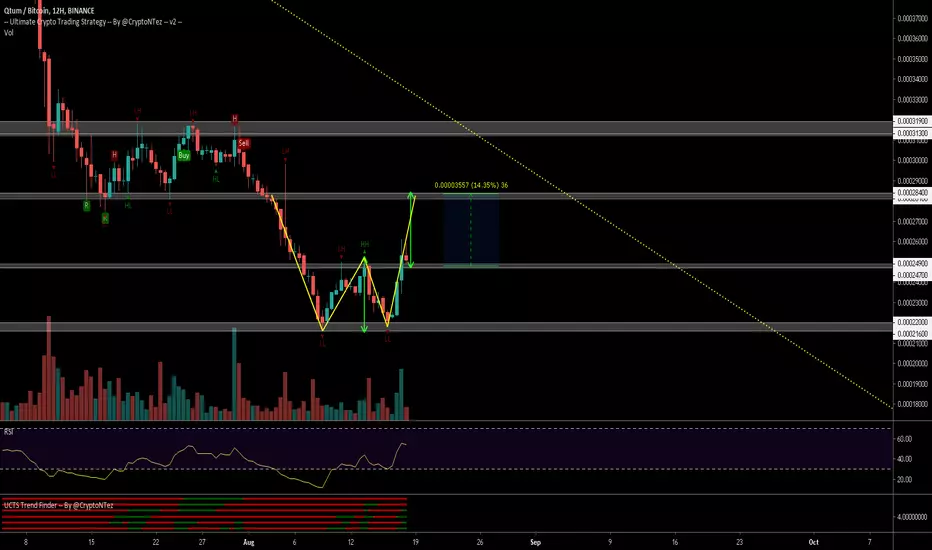
$QTUM, Showing a double bottom pattern about to flip ~25k sats $QTUM / $BTC
Showing a double bottom pattern about to flip ~25k sats resistance into support for a new leg up to ~28K sats (~14%)
Volume rising, MACD showing a bullish divergence while UCTS showing buy signals on 6H or lower timeframes...
Let see how it evolves..
#QTUM


Qtum Price Analysis QTUM / USD: Pattern SuperpositionQTUM / USD Short-term price analysis
QTUM has a bearish short-term trading bias, with the cryptocurrency still trading below its 200-period moving average on the four-hour time frame.
The four-hour time frame shows that a bearish head and shoulders pattern is starting to form, which could trigger the next bearish move lower in the QTUM / USD pair.
Technical indicators on the four-hour time frame have turned bullish and continue to generate buy signals.
QTUM / USD H4 Chart by TradingView
Pattern Watch
Traders should note that a bullish double-bottom pattern is also in play across the four-hour time frame.
Relative Strength Index
The Relative Strength indicator has turned bullish on the four-hour time frame and is generating a buy signal.
MACD Indicator
The MACD indicator has turned bullish on the four-hour time frame, with the MACD signal and histogram both issuing a buy signal.
QTUM / USD Medium-term price analysis
QTUM has a neutral medium-term trading outlook, with the QTUM / USD pair probing towards its trend defining 200-day moving average.
The daily time frame is showing that the QTUM / USD pair is at a critical juncture over the medium-term, as bulls and bear battle around key technical support.
Technical indicators on the daily time frame are bearish and continue to generate sell signals.
Pattern Watch
Traders should note that the large inverted head and shoulders pattern still remains valid on the daily time frame.
Relative Strength Index
The Relative Strength indicator remains bearish on the daily time frame and continues to issue a sell signal.
MACD Indicator
The MACD indicator is bearish on the daily time frame and continues to generate a sell signal.
Conclusion
QTUM is at a critical juncture over both short and medium-term, as bulls and bears battle for directional control around the QTUM / USD pair’s 200-day moving average.
The four-hour time frame best illustrates the near-term struggle, with a head and shoulders pattern pitched against a double-bottom pattern.


QTUM Breakout the bullish pennant
Support at: $4.7
Buy as close $4.8 as possible
Stop if 4H candle close under $4.5
Target: $5.7

QTUM LONG$QTUM
I'm liking the volume we've seen over the last week, CCI turning positive on the daily. Could see a retest of green support, then I think we'll head for yellow POC above.


QTUMUSD technical analysisbull flag formed and we have just broke out and the target is as shown on the chart and the stochastic is going up so we are more likely to hit the target
all info provided by me is not a financial advice and I'm not a financial adviser .. its all just my opinion based on TA


Qtumoon :-)
´´´´´´´´´´´´´´´´´´´´´´¶¶¶¶¶¶¶¶¶……..
´´´´´´´´´´´´´´´´´´´´¶¶´´´´´´´´´´¶¶……
´´´´´´¶¶¶¶¶´´´´´´´¶¶´´´´´´´´´´´´´´¶¶……….
´´´´´¶´´´´´¶´´´´¶¶´´´´´¶¶´´´´¶¶´´´´´¶¶…………..
´´´´´¶´´´´´¶´´´¶¶´´´´´´¶¶´´´´¶¶´´´´´´´¶¶…..
´´´´´¶´´´´¶´´¶¶´´´´´´´´¶¶´´´´¶¶´´´´´´´´¶¶…..
´´´´´´¶´´´¶´´´¶´´´´´´´´´´´´´´´´´´´´´´´´´¶¶….
´´´´¶¶¶¶¶¶¶¶¶¶¶¶´´´´´´´´´´´´´´´´´´´´´´´´¶¶….
´´´¶´´´´´´´´´´´´¶´¶¶´´´´´´´´´´´´´¶¶´´´´´¶¶….
´´¶¶´´´´´´´´´´´´¶´´¶¶´´´´´´´´´´´´¶¶´´´´´¶¶….
´¶¶´´´¶¶¶¶¶¶¶¶¶¶¶´´´´¶¶´´´´´´´´¶¶´´´´´´´¶¶…
´¶´´´´´´´´´´´´´´´¶´´´´´¶¶¶¶¶¶¶´´´´´´´´´¶¶….
´¶¶´´´´´´´´´´´´´´¶´´´´´´´´´´´´´´´´´´´´¶¶…..
´´¶´´´¶¶¶¶¶¶¶¶¶¶¶¶´´´´´´´´´´´´´´´´´´´¶¶….
´´¶¶´´´´´´´´´´´¶´´¶¶´´´´´´´´´´´´´´´´¶¶….
´´´¶¶¶¶¶¶¶¶¶¶¶¶´´´´´¶¶´´´´´´´´´´´´¶¶…..
´´´´´´´´´´´´´´´´´´´´´´´¶¶¶¶¶¶¶¶¶¶¶…….

Qtum/Bitcoin (June 30) #QTUM $QTUM #BTC $BTCAccumulate : 430-440
Sellzone : 500-570
Holdzone : 720-760-2420-4100
Stoploss : Under 400

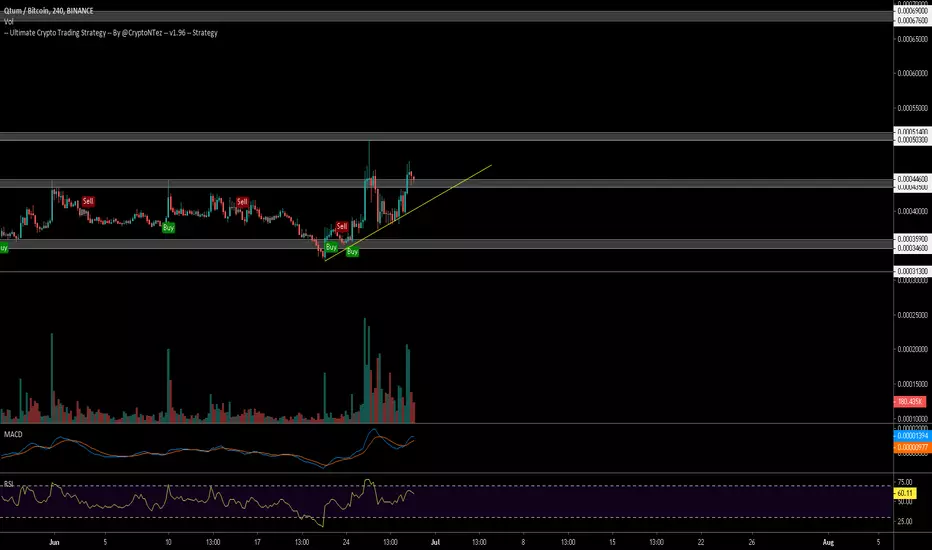
QTUM continues bullish reversalQTUM has checked nearly every mark when it comes to a bullish reversal. One of the only barriers left is its previous local high of 50,300 satoshis. If we manage to break through I expect a very good breakout.

QTUM - Looking More Bullish Than Most Alts - Watch For Breakout!Looking at the Daily chart for QTUM, I like what I see. We have a nearly completed falling wedge and a bullish MACD with a solid cross over the zero-line. This is bull territory. I am eyeing the bold yellow dotted resistance trend. This resistance has knocked down all attempts to break it since August of last year. If QTUM break this resistance level, that would be a very bullish sign. The next resistance area is would be 2x and we could reach it very quickly because there's no resistance in between.
For long-term hodlers, this is a great time to buy. Very little downside risk compared to the upside reward.
For short-term buyers, I would wait for a breakout beyond the bold yellow resistance level. The price could move quickly from here and prove to be an ideal scalp for some real profit.

$QTUM Showing good volume as it tries to recover 2018 lows$QTUM Showing good volume as it tries to recover 2018 lows support around ~450sats...
If manages to break from here with this volume, we may see a jump to the 500 sats (15%) as first target...
UCTS Buy signal on the 4H
Couple of events coming on the following days
#QTUM