$QTUM On a descending channel since March 15th...$QTUM On a descending channel since March 15th...
Not interested until I see a real breakout from this channel
Volume still looks low, no UCTS buy signals yet...
#QTUM
Qtum

QTUM - TRADE SETUPQTUM just breached a tough resistance area and we feel another leg up could follow soon.
Levels on the chart.

QTUM/USDT - wait for break upI am more interested in Alt/USDT pair
Please wait for the reliable entry point
Follow me for more update guys

QTUMUSDT is good for a scalp trade.BINANCE:QTUMUSDT
QTUM did have a good raise last days. Today it shows many of bullish sign that makes me confident to give it another try. The bullish signs are including:
- Double bottom pattern on daily chart.
- MACD, macd line cross up zero line.
- The Tenkan-sen crossover the Kijun-sen (of Ichimoku Kinko Hyo).
There will have a small pull back of QTUM due to strong Fib. 61.8% resitance decline, there will be a good chance to buy QTUM on next correction.
Buy zone: 2.9 to 3.1 (Fib. 50% and Fib. 61.8%)
Sell targets: 3.3 and 3.6
Stop-loss: Below 2.8 (Fib. 23.6%)
P/S: This is not a financial advice.

qtumBuy blue box break out. This chart has been a soul crusher but super fun to finally get a grip on it. Either ABC can happen so one did happen or one is about to.
Posting this because its complex and taking a lot of people out. Let's see if the count is right.
Thread in comments.

Qtum o grande estouroDepois de ter rompindo uma LTB de longo prazo e iniciado uma formação de pullback, a mesma perdeu força para voltar ao fundo novamente fortalecendo mais ainda a região e virando um fundo duplo de inversão, veremos boas subidas para a QTUM em breve.
Swing trade :
Entrada: 44.360 a 46.880
Stop: 43.178
Alvos:
49.000
56.165
71.700

Valari Bot Feedback XRP/ETH LONG 2019-04-05 Hello everyone,
XRP single buy 0.02200
P.S Taking longs on ripple does not really look that bad now, but the bounce might take a while.
All the best

Valari Bot Feedback ONT/ETH BUY AROUND 0.007914Hello everyone,
Third trade is ONT/ETH
We have around 6 buy orders with an average of 0.007914
P.S I would not advise a buy above 0.005500 with the current trend (Down)
All the best

QTUMUSDT shows strong uptrend reversalBINANCE:QTUMUSDT
After reached nearish top high at $3.69, QTUM entered a short correction ending up at Fib. 23.6% ($2.22).
QTUM has gained its bullish since the start of May 2019, drawn 4 consecutive green candles that gives strong uptrend on indicators, including:
+ RSI breaks downtrend resistance, as shown on chart. RSI is facing 50 value, which is a bull/bear frontier.
+ MACD is highly likely have a positive crossover on tomorrow, the histogram meets the zero line will get positive values.
+ CCI line pierces through the zero resistance, indicates new uptrend.
+ Bill William's Accumulator/Deaccumulator Oscillator ( AC ) turns positive 3 days ago.
Tomorrow will be a good day for QTUM, after it breaks some key resistance areas and enters active mode. The resistances and targets for QTUM in short-term are:
+ 1st target: Bollinger Bands (BB) mid-line and Fib. 50% at $2.6t they are key resistances (in term of bullish or bearish zone).
+ 2nd target: Fib. 61.8% and the Kijun-sen at $3.0, they are strong resistances.
+ 3rd target: BB upper line and Fib. 76.8 at around $3.2, they are weak resistances.
+ And last short-term target: Last peak at $3.6, a strong resistance.
Ideal buy zone and supportances for QTUM is $2.5 and $2.6, which are the MA200 and BB mid-line values.
Protective stop-loss for this trade should be placed at $2.3 and belows.
Trailing stop-loss should be place after at 3% below each target, after the targets be passed.
P/S: Scalp trading between the targets is also a good idea on this market, when BTC dominance is quite high.


A trading opportunity to buy in QTUMETHTechnical analysis:
. Qtum/Ethereum is in a range bound and the beginning of uptrend is expected.
. The price is below the 21-Day WEMA which acts as a dynamic resistance.
. The RSI is at 33.
Trading suggestion:
. There is a possibility of temporary retracement to suggested support zone (0.014950 to 0.013950). if so, traders can set orders based on Price Action and expect to reach short-term targets.
Beginning of entry zone (0.014950)
Ending of entry zone (0.013950)
Entry signal:
Signal to enter the market occurs when the price comes to " Buy zone " then forms one of the reversal patterns, whether " Bullish Engulfing ", " Hammer " or " Valley " in other words,
NO entry signal when the price comes to the zone BUT after any of the reversal patterns is formed in the zone.
To learn more about " Entry signal " and the special version of our " Price Action " strategy FOLLOW our lessons:
Take Profits:
TP1= @ 0.017910
TP2= @ 0.020200
TP3= @ 0.023570
TP4= @ 0.028240
TP5= @ 0.037080
TP6= @ 0.051400
TP7= Free

QTUM/BTC can be playableQ TUM is at 450 sats now can move to as low as to 445. So you can ladder in buys from now to 445. Stop Loss at 437, this would be in the case that BTC loses value again, so use trailing stop or stop limit. Targets open to 600. Take profits responsibly and accordingly.


QTUMBTC Buying oppurtunity QTUM looks good to buy between 520-530. Target 1 547 is standing strong for short call as well as long call. Cup will be formed. There chances cup's handle will be formed then we achieve Target 3 - 648. Aslo, QTUM is oversold on 4h RSI and MFI.
Contact me - t.meGTCGoodTradeCalls

$QTUM, Break over ~750sats never happened...update on $QTUM, Break over ~750sats never happened and now its back to ATL BTC zone...
Similar to other asset I would recommend to ladder your buys into this asset as we expect it to bounce as it did in the past...
I will be updating as I see signals of reversal..
#QTUM

QTUM:BTC Long TradeBullish Ddvergence on BINANCE:QTUMBTC .
Spike in volume
Upward Channel
Bounce off ema 20 line on 4hr.
Thanks for visiting.


QTUMQTUM has fallen right back down onto trendline support as well as the demand zone
A strong bounce from this area would show that QTUm might be ready to retest the previous local highs and break out from this accumulation zone
Trendline support must hold or we could revisit the lower demand zone

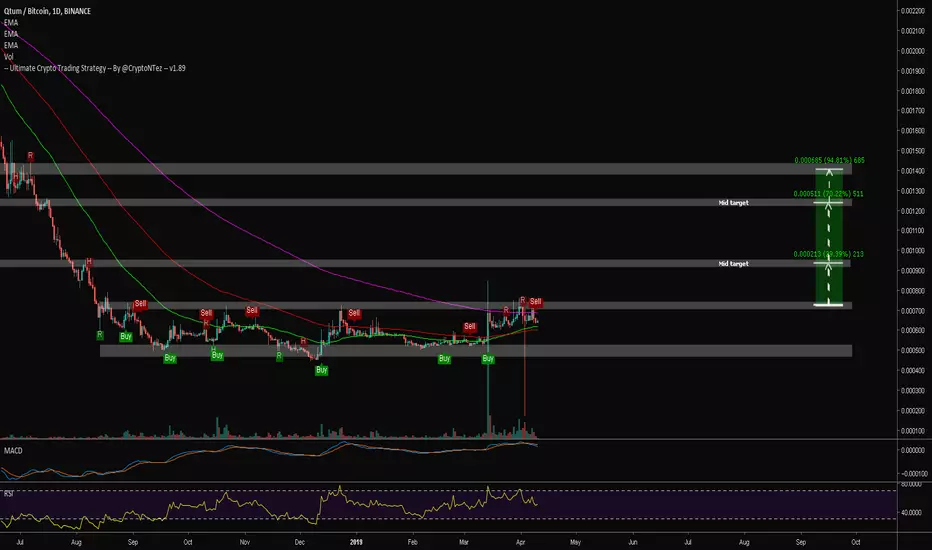
$QTUM If it gets enough traction to get over ~750sats...$QTUM If it gets enough traction to get over ~750sats, this will fly...
UCTS Buy signal on the 1/2D (20%+ up already)
RSI at good levels, MACD deciding what to do
Volume looking ok..
Trying to cross EMA200
For now set alerts & wait, but dont miss it if it happens!
#QTUM