QTUM/USDT – Make or Break? Testing the Edge of Accumulation?🧠 Overview:
After going through a volatile multi-year cycle, QTUM is now back at one of the most critical historical support zones. This demand area has acted as a strong reversal point multiple times since 2020 and is once again being tested as price consolidates near the bottom of its macro range.
---
📉 Price Structure & Key Levels:
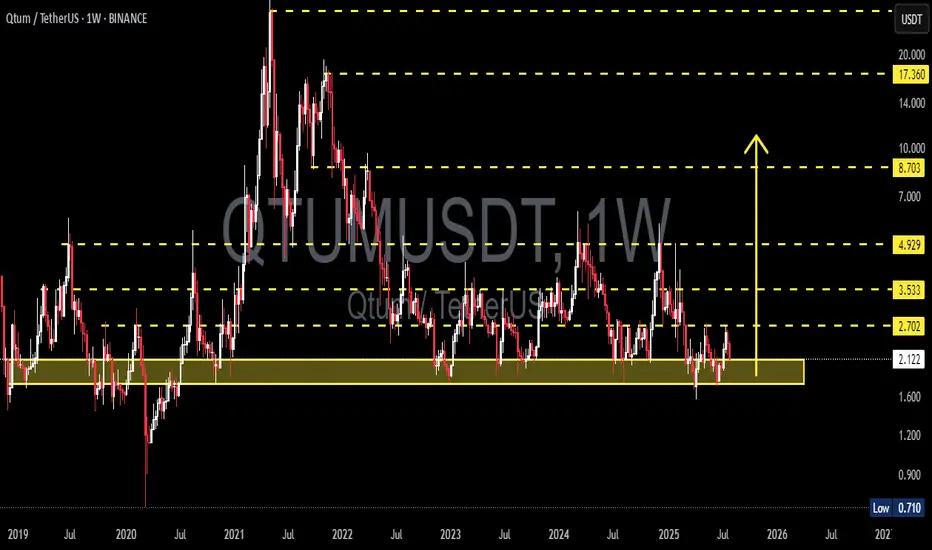
📍 Major Support Zone (1.70 – 2.10 USDT):
A proven accumulation zone based on multiple long wicks and price rejections in the past.
This is where smart money tends to accumulate during market uncertainty.
📍 Layered Resistance Levels (Bullish Targets):
2.70 USDT → Initial breakout validation
3.53 USDT → Mid-range resistance
4.93 USDT → Key structural level
8.70 USDT → Mid-term breakout target
17.36 USDT → Peak from previous macro cycle
---
🧩 Current Pattern: "Sideways Accumulation Range"
QTUM is clearly in a range-bound accumulation phase, with tight price action within a key support area. Historically, such patterns often precede large impulsive moves, especially when accompanied by volume surges and breakouts from structure.
> ⚠️ Important Note: Sideways movement at historical support, combined with increasing accumulation volume, often leads to a breakout into the markup phase.
---
📈 Bullish Scenario: Potential Upside Momentum
Trigger: A confirmed breakout and weekly candle close above 2.70 USDT.
Additional Confirmation: Strong bullish candle with increased volume.
Targets:
3.53 USDT (local resistance)
4.93 USDT (mid-range structural level)
8.70 USDT (swing target)
17.36 USDT (macro cycle high)
🎯 High reward-to-risk potential if entries are made near support with a stop-loss under 1.70 USDT.
---
📉 Bearish Scenario: Breakdown Risk
Trigger: Weekly candle closes below 1.70 USDT.
Implication: Breakdown from long-term demand zone.
Downside Targets:
1.20 USDT → Minor horizontal support
0.71 USDT → Historical all-time low
Warning Sign: High volume breakdown = likely sign of institutional selloff or panic exit.
---
📊 Strategic Summary:
> QTUM is at a pivotal crossroads.
The 1.70 – 2.10 USDT range is a decisive area.
A bullish breakout could spark a major recovery rally,
while a breakdown may lead to a deeper capitulation.
This is a “calm before the storm” situation. Traders should monitor closely as the next few weekly candles could define the trend for the rest of 2025.
#QTUMUSDT #QTUM #CryptoAnalysis #AltcoinSetup #TechnicalAnalysis #AccumulationPhase #SupportAndResistance #BreakoutPlay #CryptoBreakout
Qtumusdt
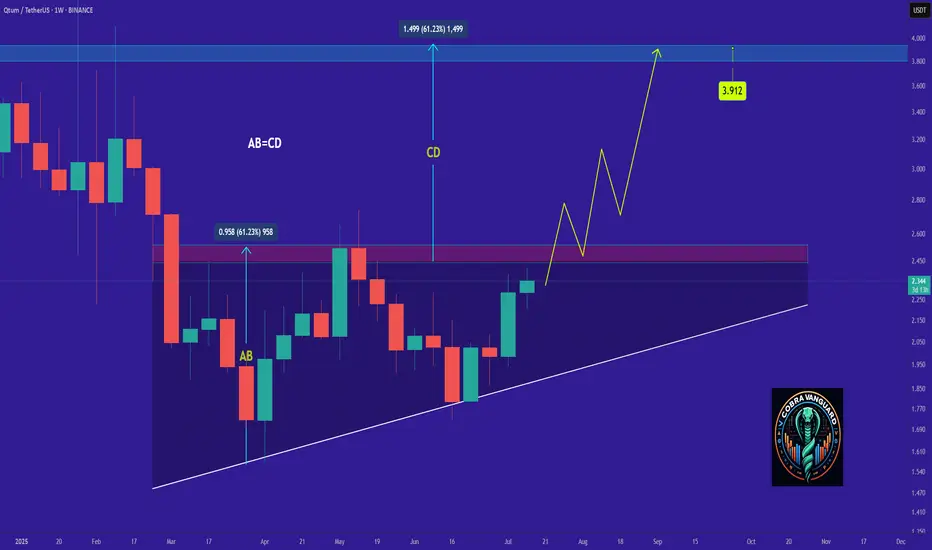
QTUM- Time to buy again!The price on the WEEKLY timeframe is within an ascending triangle, which can be promising. If the price breaks this pattern with bullish candles, it could easily rise by the distance of AB=CD.
Best regards CobraVanguard.💚
QTUMUSDT 1W AnalysisQTUM ~ 1W Analysis
#QTUM Buy back gradually from here with a short term target of at least 20%+ from this support.

#QTUM/USDT#QTUM
The price is moving within a descending channel on the 1-hour frame and is expected to break and continue upward.
We have a trend to stabilize above the 100 moving average once again.
We have a downtrend on the RSI indicator that supports the upward move with a breakout.
We have a support area at the lower limit of the channel at 2.25, acting as strong support from which the price can rebound.
Entry price: 2.30
First target: 2.35
Second target: 2.41
Third target: 2.47

QTUMUSDT 1D AnalysisQTUM ~ 1D Analysis
#QTUM Buy after successfully penetrating this resistant line with a short -term target of at least 10%+ from here.

QTUM May Surprise You All (3D Analysis)Qtum has formed a rectangle in weekly time period. Whenever it reachs the bottom, always turned back to gather upside liquidty till now.
The other interesting thing is, when Qtum first went upwards for liquidty, it took over 2 years to gather all remaining short liqudations. When it did again, it took less than a year. So the scale of time for gathering liquidty is squezing.
If Qtum can stay above the bottom of the rectangle, I believe there is a chance for %160 profit in long term. There is not even need for a leverage.
-%20 down here means that this coin is set for going hell and no way for recover.
But, there is %160 profit chance. The question is, are you willing to take that risk?
Cause I will.
Thanks for reading.

Trading opportunity for QTUMUSDTBased on technical factors there is a Buy position in :
📊 QTUMUSDT
🔵 Buy Now
🪫Stop loss 1.950
🔋Target 2.580
📏 R/R 2
💸RISK : 1%
We hope it is profitable for you ❤️
Please support our activity with your likes👍 and comments📝

QTUMUSDT 1WQTUM ~ 1W Analysis
#QTUM If you still have a Conviction on this coin, maybe this support you can consider to start buying again from here.

QTUM ANALYSIS🚀#QTUM Analysis :
🔮As we can see in the chart of #QTUM that after consolidation there was a huge bullish move. Right now we could see #QTUM is trading around its major resistance zone. After the breakout we would see a good bullish move
⚡️What to do ?
👀Keep an eye on #QTUM price action. We can trade according to the chart and make some profits⚡️⚡️
#QTUM #Cryptocurrency #TechnicalAnalysis #DYOR

Long QTUMThe good moment for try to Buy the QTUM. We are a ling time in the flat channel. And now we a tested the up level and do not touch the low level. It can be support point. After fast move up and back we can to stop on the middle line of flat channel and start to move up creating up trend. The good trade with small risk and good reward. Will see...
Important support and resistance zones: 2.950-3.403
Hello, traders.
If you "Follow", you can always get the latest information quickly.
Please also click "Boost".
Have a nice day today.
-------------------------------------
(1D chart)
The M-Signal indicators of 1D, 1W, and 1M charts are concentrated in the 2.950-3.403 section.
Accordingly, when the StochRSI indicator shows a downward trend in the overbought section, whether there is support near this section is an important issue.
-
(30m chart)
In order to change the trend, the MS-Signal indicator must rise above the price and maintain the price.
If the MS-Signal indicator rises above the price, the BW (100) indicator is formed at the 3.922 point and the HA-High indicator is formed at the 4.033 point, so the point to watch is whether this section can be broken upward.
When the StochRSI indicator enters the oversold zone and then rises, you should check for support near the 2.950-3.403 zone.
When you meet the HA-Low and BW(0) indicators, it is natural to enter a buy (LONG) position because there is a high possibility of an increase.
However, as I mentioned earlier, you should respond based on whether there is support near this area because you need to break through the MS-Signal indicator upward.
-
Rather than deciding how far it will fall or rise, it is important to consider which points are important support and resistance points and create a trading strategy based on whether there is support at those points.
Then, if you have traded according to the price movement, you can respond with a split transaction.
We are not analyzing charts, but trading to make profits, so you can respond appropriately and go with the flow.
-
Thank you for reading to the end.
I hope you have a successful trade.
--------------------------------------------------
- Big picture
I used TradingView's INDEX chart to check the entire range of BTC.
(BTCUSD 12M chart)
Looking at the big picture, it seems to have been maintaining an upward trend following a pattern since 2015.
In other words, it is a pattern that maintains a 3-year upward trend and faces a 1-year downward trend.
Accordingly, the upward trend is expected to continue until 2025.
-
(LOG chart)
Looking at the LOG chart, you can see that the upward trend is decreasing.
Accordingly, the 46K-48K range is expected to be a very important support and resistance range from a long-term perspective.
Therefore, I expect that we will not see prices below 44K-48K in the future.
-
The Fibonacci ratio on the left is the Fibonacci ratio of the uptrend that started in 2015.
That is, the Fibonacci ratio of the first wave of the uptrend.
The Fibonacci ratio on the right is the Fibonacci ratio of the uptrend that started in 2019.
Therefore, this Fibonacci ratio is expected to be used until 2026.
-
No matter what anyone says, the chart has already been created and is already moving.
It is up to you how to view and respond to it.
Since there is no support or resistance point when the ATH is updated, the Fibonacci ratio can be appropriately utilized.
However, although the Fibonacci ratio is useful for chart analysis, it is ambiguous to use it as a support and resistance role.
The reason is that the user must directly select the important selection points required to create the Fibonacci.
Therefore, it can be useful for chart analysis because it is expressed differently depending on how the user specifies the selection point, but it can be seen as ambiguous for use in trading strategies.
1st: 44234.54
2nd: 61383.23
3rd: 89126.41
101875.70-106275.10 (when overshooting)
4th: 134018.28
151166.97-157451.83 (when overshooting)
5th: 178910.15
-----------------

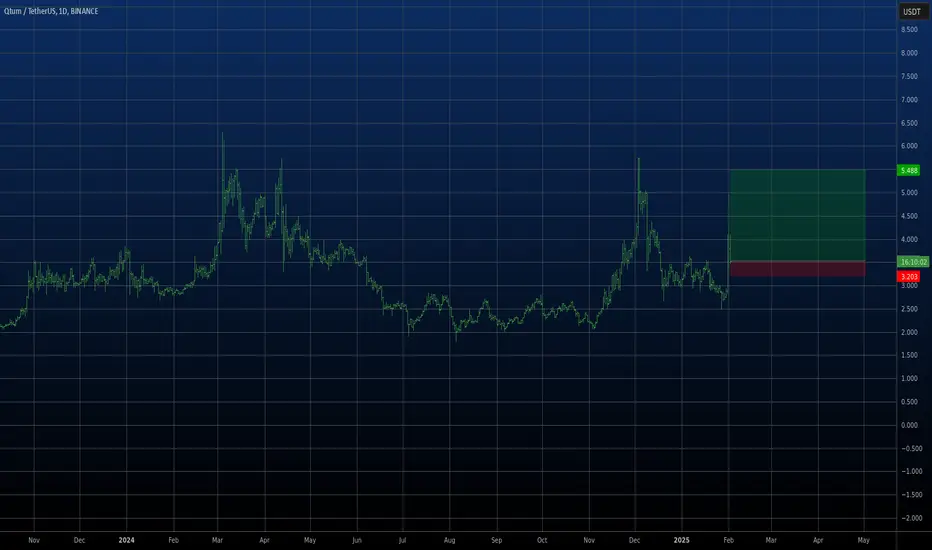
QTUMUSDT(Quantum) Updated till 01-02-25QTUMUSDT(Quantum) Daily timeframe range. we can see a nice push here. tried to break through 4.564. but bag holders took out profit at 4.564 so buyers needs to hold above 3.529 to continue the push. PA holding on its midrange decently for a while now.

QTUMUSDT 1WQTUM ~ 1W
#QTUM If you still have Conviction on this coin,. This support block would be a very good buying place for now,. With a minimum target of 20%++

QTUMUSDT Approaches Rectangle Pattern ResistanceQTUMUSDT Technical analysis update
QTUMUSDT has been trading within a rectangle pattern for the last 150 days at the bottom yearly support. The price is now moving toward the rectangle resistance, and once a breakout occurs, a strong bullish move can be expected. The price is trading above the 100 and 200 EMAs, and there has been a noticeable rise in volume over the past few days.
Regards
Hexa

Bullish Breakout or Bearish Breakdown Ahead for #QTUMUSDT?Yello Paradisers! Are we on the verge of a bullish breakout or could a bearish breakdown be looming for #QTUMUSDT?
💎#QTUMUSDT has been trading within a tight consolidation range, hovering between a strong support at $2.040 and a key resistance at $2.789. This prolonged sideways movement reveals a market in equilibrium, with neither buyers nor sellers taking full control just yet. Typically, such consolidation phases set the stage for a significant price move once one side gains dominance.
💎Currently, all eyes should be on the $2.789 resistance level. If #QTUM breaks above this threshold with substantial trading volume, it could kick off a sharp upward move, with the next major target at $4.592. Throughout this consolidation, trading volume has remained relatively stable, but a surge could be the catalyst needed for a breakout. The RSI is showing neutral-to-bullish momentum, supporting the potential for an upward trend if resistance is broken.
💎However, if #QTUM fails to breach this resistance, we could see either a retest of the support level at $2.016 or continued sideways action. A strong rebound from this support would maintain the bullish outlook, while a breakdown below $2.016 could invalidate this setup and signal a shift towards bearish sentiment.
Stay disciplined, Paradisers. In moments like these, patience and timing are key. Don’t let market noise disrupt your strategy this could be a pivotal point, but only for those who play it smart and steady.
MyCryptoParadise
iFeel the success🌴

#QTUM (SPOT- Investing ) entry (1.880- 2.370). SL (1.784)BINANCE:QTUMUSDT
entry range (1.880- 2.370)
Target1 (3.290) - Target2 (4.960) - Target3 (7.740) - Target4 (10.499) - Target5 (13.199)
1 Extra Targets(optional) in chart, if you like to continue in the trade with making stoploss very high.
SL .1D close below (1.784)
** This coin may take long time to achieve all targets **
*** collect the coin slowly in the entry range ***
*** No FOMO - No Rush , it is a long journey ***
**** #Manta ,#OMNI, #DYM, #AI, #IO, #XAI , #ACE #NFP #RAD #WLD #ORDI #BLUR #SUI #Voxel #AEVO #VITE #APE #RDNT #FLUX #NMR #VANRY #TRB #HBAR #DGB #XEC #ERN #ALT #IO #ACA #HIVE #ASTR #ARDR #PIXEL #LTO #AERGO #SCRT #ATA #HOOK #FLOW #KSM #HFT #MINA #DATA #SC #JOE #RDNT #IQ #CFX #BICO #CTSI #KMD #FXS #DEGO #FORTH # AST #PORTAL #CYBER #RIF #ENJ #ZIL #APT #GALA #STEEM #ONE #LINK #NTRN #COTI #RENDER #ICX #IMX #ALICE #PYR #PORTAL #GRT #GMT # IDEX #NEAR #ICP #ETH #QTUM ***

QTUMUSDTQTUM ~ 1W
#QTUM So far it continues to maintain this support Block. If you still have Conviction on this coin,. this support block will be a very good buy so far.

QTUMUSDTQTUM ~ 1W
#QTUM A very interesting demand zone at the moment. we think 20%+ in the short term is not too bad for this $Coin.

QTUM 25%QTUM is showing strengh, i am playing spot here. This should be easy 25% if BTC stays stable. Price action is very bullish, volume is there as well. Overall it is bullish now as market bullish as well.
NOT A FINANCIAL ADVICE
ALWAYS USE STOPLOSS AND MANAGE YOUR RISK

QTUMUSDT Triple Bottom.QTUMUSDT Technical analysis update.
QTUM has formed a triple bottom on the daily chart and is currently trading below the neckline resistance. Once a breakout is confirmed on the daily chart, we could see a strong bullish move in QTUM.
Buy level: After Breakout.

#QTUM/USDT#QTUM
The price is moving in a descending channel on the 12-hour frame and is sticking to it very well and is expected to break it upwards
We have a bounce from a major support area in green at 2.05
We have a downtrend on the RSI indicator that was broken upwards which supports the rise
We have a trend to stabilize above the 100 moving average which supports the rise
Entry price 2.28
First target 2.60
Second target 2.85
Third target 3.16

QTUMUSDTQTUM ~ 1W
#QTUM A very interesting demand zone at the moment. we think 20%+ in the short term is not too bad for this $Coin.

QTUM's long term is bearishFrom where we put the red arrow on the chart, the correction of QTUM has started.
This correction seems to be a double or multiple correction.
Recently, wave X seems to have ended and we have entered the second correction.
The least risky place to buy on large time frames in the medium term is the green range.
For risk management, please don't forget stop loss and capital management
Comment if you have any questions
Thank You
