Quant’s next target = $221-224We have hit our recent target and now set our sights on the $221-224 breakout target of the inverse h&s pattern with the white neckline. Often times we will se a slight correction or consolidation in between going from hitting one breakout target to hitting the next. However, sometimes price action can just keep pumping until it hits both targets. As of now, we haven’t really seen any significant correction after reaching our first target here but it could still potentially correct enough to even retest the white neckline. If we were icky enough to get that steep of a correction first and the neckline then confirms as solidified support that would be a location where I would add to my position. No guarantee it will return there before reaching the $221 target though so once again hodling is paying off. *not financial advice*
Quant

Quant All Time High, buy nowQuant claims to have solve interoperability challenges, "Led by an experienced team from large corporate, financial and regulatory institutions, we enable existing financial infrastructure to operate with new decentralised networks."
Head and Shoulders bottom against USD.
All time high against btc
$1000 soon ?

QUANT $1000Quant claims to have solve interoperability challenges, "Led by an experienced team from large corporate, financial and regulatory institutions, we enable existing financial infrastructure to operate with new decentralised networks."
Head and Shoulders bottom.
All time high against btc
$1000 soon ?

BreakoutQNT just broke out and is about to break through strong resistance at $150. We could see some real follow through price action if Quant can stay above $150.

QNTUSDT Entered a new Bull CycleIt's been quite some time ago that Quant (QNTUSDT) gave the first bullish break-out signals as we highlighted on our analysis on July 09:
As you see, the signal was the break above the 1D MA200 (orange trend-line) and we've clearly set a mark that a new Bull Cycle would start when the price would break above its (then) 6-month Resistance Zone. That has been emphatically achieved last week and Quant is on a strong Bullish Fractal targeting the 236.235 December 12 2021 High. With the 1D RSI approaching the top of its 2022 Channel Up, a pull-back afterwards wouldn't come as a surprise but from now on the benchmark Support will be the 1D MA50 (blue trend-line). All Highs, including the All Time High can be targeted after this.
-------------------------------------------------------------------------------
** Please LIKE 👍, SUBSCRIBE ✅, SHARE 🙌 and COMMENT ✍ if you enjoy this idea! Also share your ideas and charts in the comments section below! This is best way to keep it relevant, support me, keep the content here free and allow the idea to reach as many people as possible. **
-------------------------------------------------------------------------------
You may also TELL ME 🙋♀️🙋♂️ in the comments section which symbol you want me to analyze next and on which time-frame. The one with the most posts will be published tomorrow! 👏🎁
-------------------------------------------------------------------------------
👇 👇 👇 👇 👇 👇
💸💸💸💸💸💸
👇 👇 👇 👇 👇 👇

QNTUSD could validate the symmetrical triangle breakout here. Nice sized candle currently above the yellow symmetrical triangle..it has grown a mild bull wick since testing the thickerwhite line above the triangle which is the neckline to a bigger inverse head and shoulders pattern. It could come back down to retest the top trendline of the yellow symmetrical triangle…the most important thing is where the current daily candle closes and how the follow up candle behaves afterwards. As long as we close above the yellow trendline on the current candle probability favors the breakout…however breaking above the white neckline by the follow up candle and flipping it to support will really seal the deal. If we do validate the breakout I would not be shocked if price action came back down to retest the white neckline as support after reaching the triangles full breakout target at $166. If it can hold the white neckline as support after that its a good sign that the inverse head and shoulders pattern will be validating as well taking us even higher. Of course it doesnt have to retest the neckline to validate the inv h&s so wise to anticipate that outcome as well. One last thing to add is there is also a current smaller inv h&s we are breaking up from at the same time as the symmetrical. I forgot to put that patterns target on the chart but the smaller inv h&s target is $137. There’s always a possibility price action corrects after reaching 137 too. *not financial advice*

#QNT is one of the best performing #crypto's of 2022Robust performance post bottom
Retested early launch price action
4X in price and on verge of breaking out
This may only appeal to large funded speculators, due to having a high token price. Driving away smaller speculator's.
But much like the stock market , if this token achieves a four figure sum in the next bull market who cares if you have ten tokens or a thousand.

QNT : A Little up Then down...QNT Seems to be trading inside a huge rising wedge and we will be touching the resistance soon...
Just trading the charts and keeping emotions out here...

QUANT Inverted H&SInverted H&S pattern evident
The right arm of the right shoulder is yet to form completely, which allows bullish potential
Bullish on this daily timeframe

$QNT - Brewing Up for next HIGHHello my Fellow TraderZ,
On 4 HTF, $QNT #QUANT is forming an ASCENDING TRIANGLE which is bullish in nature. RSI has already broken the Trendline Resistance so waiting for the Price to do the same.
But be a bit cautious as multiple rejections near $142 is clearly showing the strength of the Sellers.
If breakout happens above $142 with strong VOLUME, go for LONG with the price target ~$160.
Trade well FAM. CHEERS!!!

$QNTUSDT UPDATE!!!Hi Snipers,
Please refer to the recording for the next price levels and scenarios.
Thanks
MS

Quant: Blue Skies 🎼Blue skies
Smiling at me,
Nothing but blue skies
Do I see.
Bluebirds
Singing a song,
Nothing but bluebirds
All day long.
If Quant would be singing this famous jazz song by Irving Berlin from 1926, it would probably rather go like this:
Blue zones
Beckoning me,
Nothing but blue zones
Do I see…
From the end of wave (ii) in blue at the upper edge of the lower blue zone between $86.77 and $50.69, Quant has steadily been climbing upwards and should soon cross the resistance at $161.52. Afterwards, it should rise into the upper blue zone between $236.77 and $294.39 to finish wave (iii) in blue. There is a 40% chance, though, that the altcoin could drop below the support at $85.93 and take a detour through the lower blue zone before moving upwards effectively.

Quant inverse head and shoulder patternQuant on a brink of a huge breakout, if this bullish momentum continues, Quant could hit $240


Party people... QNT is in DA HOUZE!Check it, all QNT needs is a second to wreck it... ;-) You know the drill: inverse H&S on da hill. Looking nice, just check the target price What do you see, the bones of a CBDC :-)

BUY Quant $QNT Inverse Head & Shoulders Breakout, Bullish DailyBulls seem to be winning in a very bearish market when it comes to Quant $QNT.
The Inverse Head & Shoulders on the daily timeframe is a high-probability trade and one I have now entered and will continue to layer into. My targets are market on the chart at $189 - $222 for an easy 70%+ gain.
The pattern is one thing but what excites me about this play is the strong buy volume confirming these breakouts. Even on smaller timeframes like the 15 min, we are getting higher highs and higher lows with slowing volume into a price floor before the next breakout.
Social mentions + metrics are high as well if you check out LunarCrush.
All other factors/indicators aside, this is enough to convince me that taking a position wont be too risky.
Any breakdown below 120 at a serious timeframe will be my confirmation of a breakdown and I will exit at a small loss.

$UNI - Catching Up with $QNTHello my Fellow TraderZ,
This is very interesting to see how the #DEFI with strong fundamentals are showing the sign of reversal to the upside Breakout.
Here we have $UNI/Usdt chart exactly the replica of $QNT which recently broke its Inverse Head and Shoulder Pattern and currently retesting to confirm the Breakout.
$UNI is also about to complete the Right shoulder of the Inverse H&S. If this pattern plays out, will see a handsome profit of ~82% with upside movement. All eyes on #Btc which could anticipate this breakout.
Till then Happy Trading. CHEERS!!!

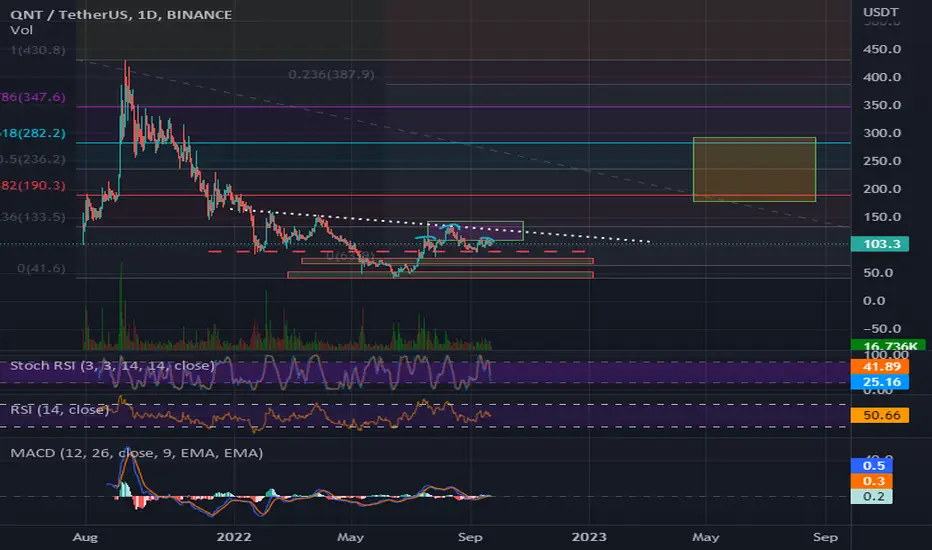
QNTUSDT(Quant) Daily tf Range Updated till 28-09-22QNTUSDT(Quant) Daily timeframe range. funny part is even with all the carnage going around within trading world, bleeding and fud and what not its still slowly moved up. its already up 200% from its june 2022 low. price action is less unstable we cant see much of unusual p and d. it got decent volume and a nice trading range.

Inverse Head and Shoulders Pattern Spotted on the Daily!Traders,
Heads up on this Inverse H&S pattern I spotted on Quant. If it breaks that neckline, we're in for a nice ride up!
Stew

QNTUSD (Quant) - BreakoutQuant has completed a reversal from bear to bull
This reversal was allowed due to the formation of a large inverted H&S pattern
Right now price is testing this red resistance line and will most likely breakout of it, as per its bullish state
Bullish!!

QNT, Inverse head and shoulder?inverse head and shoulder for QNT.
Hopefully this will happen if Bitcoin cooperates a bit.

Quant QNT big picture still goodIf Qnt breaks the $88 price range we may see $69 in the short term but long term we are still likly heading to the 0.382 or higher by mid 2023
