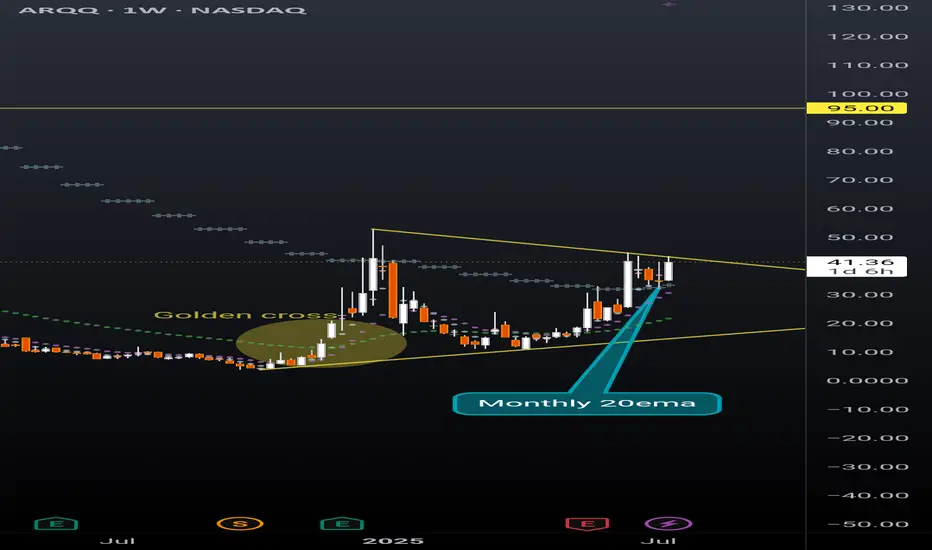
ARQQ weekly pennantBeautiful weekly pennant on ARQQ weekly timeframe. This chart is coiling nicely for a continuation. Still early in the process of reaching breakout but given the recent momentum in this sector a premature break to the upside can happen at any moment.
The ticker is currently sitting above the monthly 20ema (overlayed on this weekly chart), and just had a strong bounce off the daily 20ema (overlayed on this weekly chart). Golden cross is also highlighted that occurred in December 2024 with the daily 50ema retracing back to the daily 200ema and then continuing the uptrend earlier this spring.
Quantum
QBTS bull flag dailyBetter look at quantum computing ticker QBTS bull flag on the daily timeframe. Previous post looked at the weekly timeframe to highlight the bullish momentum. Lots of retail money piled into this one in the last few months, a breakout of this bull flag will likely be followed by a parabolic move.
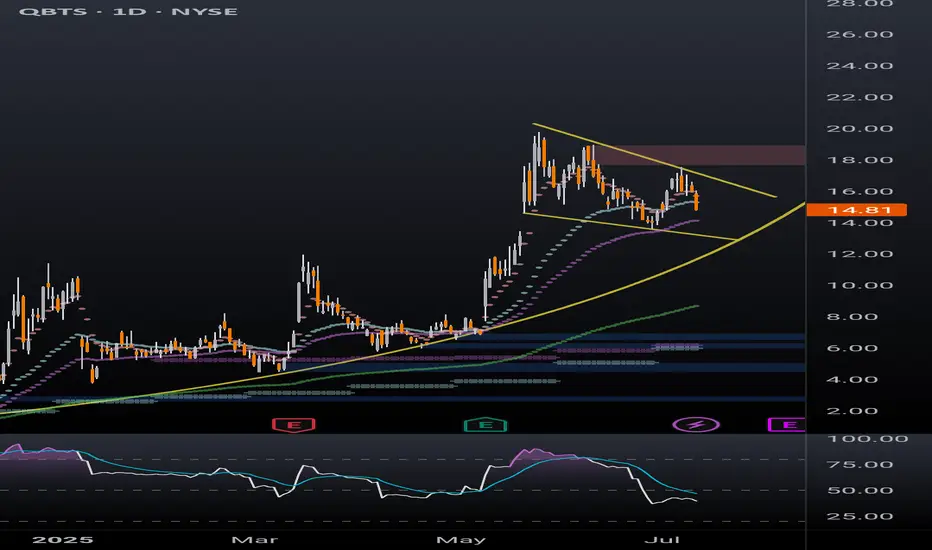
QBTS massive weekly bull flagLots of eyes on quantum computing these days. Massive bull flag forming on the daily and weekly on QBTS which has already had a great run.
Another ticker with no resistance if/when the breakout occurs.

$IONQ – Breakout Watch at $48 After Months of ConsolidationNYSE:IONQ has been basing since January, quietly marinating under the $48 level — and now we’re approaching the trigger zone. Technically, it’s a great setup. But context is everything.
🔹 The Setup
Multi-month base under $48 — a breakout above that level could release serious energy.
The structure is clean, and the volume profile is tightening — signs that something is brewing.
🔹 My Concerns (Let’s Keep It Real):
Price action has been weak — this stock hasn’t traded clean lately.
Late-cycle behavior: Even A+ setups have been failing lately — breakouts aren’t sticking like they should.
Market conditions matter: I need to see risk-on confirmation from NASDAQ:QQQ , AMEX:IWM , CRYPTOCAP:BTC , and crypto names before trusting this breakout.
🔹 My Trade Plan:
1️⃣ No Anticipation Here: Only trading this on A+ intraday setup — strong volume, clean trigger through $48.
2️⃣ Risk Control: Tight stop — can’t give it room in this tape.
3️⃣ Market Check: I want to see risk-on flows:
✅ NASDAQ:QQQ strong
✅ AMEX:IWM green
✅ CRYPTOCAP:BTC & crypto names moving
✅ Speculative names showing juice
Why I’m Watching It Anyway:
Long base = stored energy
If the market flips risk-on and NYSE:IONQ catches a bid, this could move fast
But patience is key — not every setup needs to be taken

GOOG | The Year of Quantum | LONGAlphabet, Inc. is a holding company, which engages in software, health care, transportation, and other technologies. It operates through the following segments: Google Services, Google Cloud, and Other Bets. The Google Services segment includes products and services, such as ads, Android, Chrome, devices, Google Maps, Google Play, Search, and YouTube. The Google Cloud segment refers to infrastructure and platform services, collaboration tools, and other services for enterprise customers. The Other Bets segment relates to the sale of healthcare-related services and internet services. The company was founded by Lawrence E. Page and Sergey Mikhaylovich Brin on October 2, 2015 and is headquartered in Mountain View, CA.

Time to take profits on $QBTS
I Have been bullish on most of the quantum computing stocks for awhile now. NYSE:QBTS
For about a year or so now, trump winning the election didn't change my thoughts at all. I'm not surprised at all that NYSE:QBTS is performing so well however it is important to know when to take profits, and this is one of those times. You're free to leave a small percentage of some QC stocks in your portfolio, I will leave some with trailing stops though for the most part I have taken profits, and quite nice profits they were.

100% move potential Quantum Computing RGTIRegetti Computing Inc. (RGTI) - Quantum Computing is on the move - Breaking above the 25 day EMA to continue the uptrend. RGTI has the potential to move 100% of the current price. With that potential, when would you sell at 25% , 50%, 75% or 100%? Otherwise, would you hold longterm?

QBTS Flat top Breakout setupAfter qbts earnings report we have a little flag building under this 12.25-12.40 zone along with a bigger flat top breakout in the works.
This stock has the volume and the price break along with sector momentum.
Playing this with calls on the 12 strike for next week around .9 stop under 9ema on the daily chart on the equity. Think this one has some legs
QQQ down today but quantum is looking good liking ionq also potentially

ALTCOIN BOOM FOR ALGORAND 2025-2026 PROPOSALAlgorand ( EURONEXT:ALGO ) is a layer-1 blockchain designed for speed, scalability, and sustainability. It uses Pure Proof of Stake (PPoS) to achieve fast, low-cost transactions while maintaining decentralization. Algorand’s niche is bridging TradFi and DeFi, with a focus on real-world assets (RWAs), CBDCs, and institutional adoption. Think of it as the “green Ethereum” with a compliance-friendly edge.
Recent News Launched “Algorand 2.0” with quantum-resistant cryptography and dynamic NFT standards. Secured a partnership with the IMF to pilot a cross-border CBDC project. EURONEXT:ALGO rallied 25% in July after months of stagnation, but still lags behind major layer-1 tokens.
Deep Dive Algorand’s quantum-resistant upgrade is a sleeper hit. While others focus on speed, ALGO is future-proofing against quantum hacks—a unique selling point for risk-averse institutions. The IMF partnership is HUGE, positioning Algorand as a potential CBDC backbone, but progress will be slow (TradFi moves at a glacial pace). Competitors like Hedera and Ripple are ahead in enterprise adoption, so ALGO needs to accelerate development.
Latest Tech or Utility Update
Update Details Algorand 2.0 introduced quantum-safe encryption, dynamic NFTs (updatable metadata), and “State Proofs” for trustless cross-chain interoperability.
Implications Quantum resistance is a long-term bet, but it’s a marketing win for institutional clients. Dynamic NFTs could revolutionize gaming and IP licensing. State Proofs allow Algorand to interact with chains like Bitcoin and Ethereum without bridges, reducing exploit risks. However, adoption depends on other chains integrating Algorand’s tech—a chicken-and-egg problem.
Biggest Partner & How Much Was Invested
Partnership Spotlight The International Monetary Fund (IMF) is testing Algorand for a multi-country CBDC network. No direct investment, but a 3-year technical collaboration.
Impact Analysis If the IMF pilot succeeds, Algorand could become the go-to chain for central banks. This would create significant demand for EURONEXT:ALGO as a settlement layer. However, CBDCs are politically charged—regulatory backlash could slow adoption.
Most Recent Added Partner & Details
New Collaboration Partnered with Circle to launch EURC and USDC natively on Algorand, enabling near-instant settlements. No funding disclosed, but revenue-sharing on stablecoin transactions.
Future Prospects EURC/USDC integration makes Algorand more attractive for DeFi and remittances. Short-term, this boosts liquidity; long-term, it could position ALGO as a Euro-on-ramp for institutions.
Tokenomics Update
Token Dynamics Fixed max supply of 10B EURONEXT:ALGO , with 7.3B already in circulation. Governance rewards slashed to 6% APY (from 8%) to reduce inflation. New burn mechanism: 0.1% of transaction fees destroyed monthly.
Deep Analysis The hard cap is bullish, but slow burn rates won’t offset inflation from vesting tokens. Lower governance APY might deter casual stakers, but it tightens supply. Algorand’s tokenomics still lack the deflationary firepower of ETH or BNB.
Overall Sentiment Analysis
Market Behavior Mixed bag: Retail remains cautious (social sentiment neutral), but whales are quietly accumulating. ALGO’s price is still 90% below its ATH, creating a “cheap layer-1” narrative.
Driving Forces CBDC hype and quantum-resistance FOMO. Critics argue Algorand’s marketing lags behind its tech, and ecosystem growth is too slow compared to Solana or Avalanche.
Deeper Insights Sentiment hinges on the IMF partnership delivering tangible progress. If the CBDC pilot stalls, ALGO could re-enter “zombie chain” territory.
Recent Popular Holders & Their Influence
Key Investors VanEck added EURONEXT:ALGO to its digital assets portfolio. Crypto whale "0x5a1D" bought 10M EURONEXT:ALGO in July, now a top 50 holder.
Why Follow Them? VanEck’s move signals institutional interest in Algorand’s CBDC potential. Whale “0x5a1D” has a history of accumulating undervalued layer-1s before rallies (e.g., bought DOT at $4 in 2023).
Summary & Final Verdict
Recap Algorand is a tech-first chain with strong partnerships (IMF, Circle) and cutting-edge upgrades (quantum resistance). However, its ecosystem growth lags, and tokenomics lack urgency.
Final Judgment EURONEXT:ALGO is a high-risk, high-patience play . It could 5x if CBDCs take off or quantum security becomes a priority, but institutional adoption takes time.
Considerations Can Algorand onboard enough devs to escape the “ghost chain” label? Will the IMF partnership lead to real CBDC deployments, or just research papers? How will ALGO’s inflation schedule impact price if adoption remains slow?
If you're bullish on CBDCs and quantum-resistant tech, accumulating under $0.20 could pay off long-term. If you prefer faster-moving projects, look elsewhere.

IONQ: Price at Mid-Term ResistancePrice has reached a key mid-term resistance zone (29-32) for a bounce since Apr bottom.
As long as price remains below the 32 (with max. extension to 34) resistance area, I continue to favor the scenario of another leg lower unfolding in the coming weeks.
Should price break and hold above 32–34, the current trend structure would require reassessment.
Thanks for your attention, and best of luck with your trading!

$BTC is facing a systemic threat—and it's becoming real.This post is a follow-up to my highly controversial idea from last year:
Back then, many laughed and called me a fool. But it's happening:
Forbes: "Quantum Leap or False Alarm? Bitcoin’s Fate in the Quantum Age"
www.forbes.com
CoinDesk: "Bitcoin Developer Proposes Hard Fork to Protect BTC from Quantum Threats"
www.coindesk.com
Key points:
Bitcoin is not digital gold. It can be hacked.
We have about 5 years to move to quantum-resistant encryption.
This requires a hard fork, forcing all BTC holders to move their coins to a new wallet.
Those who don’t move their coins? They’re burned—permanently lost.
How?
Quantum computers can use a “long-range attack” to derive private keys from public keys. In early BTC transactions, public keys were visible—around 2 million BTC are at risk.
Consequences:
Two chains will coexist: BTC (legacy) and BTC (quantum-safe).
SegWit adoption took 2 years. Expect similar delays.
2 million BTC could be lost forever (≈10% of supply).
Satoshi’s coins? Gone.
We'll have BTC, BTCQ, and BCH side by side.
Why would whales support this?
Removes inactive or lost coins
Doubles their holdings across chains
Protects their assets from being hacked
Is this bullish? Should you buy BTC?
Not sure. This is a systemic risk. The panic from Bitcoin developers says it all.
I warned you. Read my original post. Follow me to stay ahead of what’s next.
📉 Potential consequences
Bitcoin chain split: Legacy chain vs. upgraded chain (like BTC/BCH but even messier).
Burned coins: Could cause a deflationary shock if millions of old coins become inaccessible.
Temporary loss of trust: Confusion = market panic. Price volatility could spike.
Regulatory scrutiny: Governments could use this as an excuse to push CBDCs or new crypto laws.
New “Bitcoin” brand wars: Just like the BCH/BSV split, there may be competing narratives.
Can the developers fix this problem?
Yes, developers can upgrade Bitcoin to be quantum-safe.
But the real danger lies in:
Coordination failure
Loss of user trust
A messy migration
Potential devaluation of old BTC
Legal and branding chaos
#Bitcoin #BTC #CryptoNews #QuantumComputing #CryptoRisk #HardFork #Blockchain #CryptoSecurity #SatoshiNakamoto #CryptoWarning #DYOR #Altcoins #BTCFork #BitcoinUpdate #QuantumThreat

IONQ: Investing in QuantumQuantum is the next revolution after "Ai".
Technicals:
uHd + counter strike candle w/ vol + 61.8% fib + horizontal supp.
Note:A fall from 50 to 25 is a big discount!

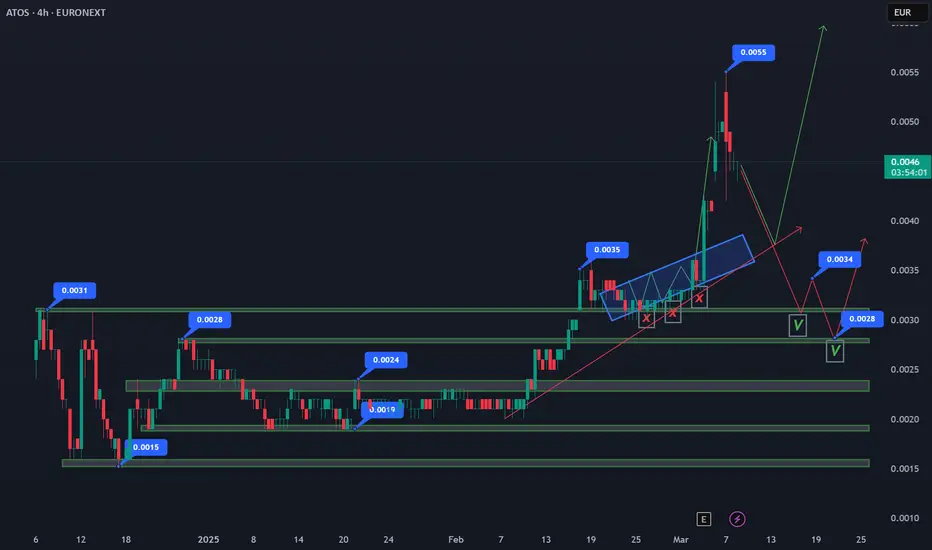
Atos Reverse Stock Split – Another Round of Price Manipulation?Atos Confirms Bullish Continuation, Invalidating Consolidation and Bearish Retest
Atos has officially invalidated neutral consolidation and a bearish retest, choosing a bullish continuation as it currently trades at $0.0046.
Atos Needs a Pullback to $0.0028–$0.0034 After 84% Surge
Following a massive 84% rally from $0.0030 to $0.0055, Atos now requires a technical pullback to retest and confirm support.
Target Pullback Zone: $0.0028–$0.0034
A retracement into this range would provide a healthy consolidation, allowing bulls to regroup before another breakout.
Holding this zone would strengthen the bullish structure, preventing excessive volatility and reinforcing confidence in further upside.
If $0.0028 holds, the next bullish wave could see Atos push beyond $0.0055 and target new highs.
This pullback phase is crucial for maintaining trend stability and ensuring Atos builds a strong foundation for the next bullish leg. If buyers defend $0.0028–$0.0034, the stock could be positioned for another sharp upward move.
Atos SE Reverse Stock Split Analysis – March 2025
Atos SE has announced a reverse stock split at a 10,000-to-1 ratio, aiming to reduce the number of outstanding shares and stabilize stock price volatility. This move follows prior capital increases and a drastic decline in share value.
Key Impacts of the Reverse Split:
Structural Change, Not Value Addition:
The total market capitalization and shareholders' equity remain unchanged.
For example, a holder of 30,000 shares at €0.0049 each will receive 3 shares at €49 each, maintaining a €147 portfolio value.
Market Sentiment & Perception:
Large-scale reverse splits are often perceived negatively, as they may signal distress.
Atos must demonstrate financial stability and growth potential to prevent further investor sell-offs.
Liquidity & Trading Adjustments:
Shareholders with fractional holdings (<10,000 shares) will need to adjust positions before April 23, 2025, or risk forced liquidation.
The new shares will start trading under a new ISIN code (FR001400X2S4) from April 24, 2025.
Potential Post-Split Volatility:
If investor confidence remains weak, the stock could face renewed selling pressure despite the higher nominal share price.
However, if Atos improves its fundamentals and strategic outlook, the split could help attract institutional investors who prefer stocks with higher unit prices.
Final Take:
While the reverse split does not inherently add value, it aims to enhance trading conditions and market perception. The real impact depends on Atos' ability to execute a successful turnaround strategy beyond the technical stock adjustment.
Atos Reverse Stock Split – Another Round of Price Manipulation?
Atos SE has once again announced a massive reverse stock split (10,000-to-1), following a sharp decline in share value. While this move is framed as an effort to reduce volatility and stabilize trading conditions, history suggests a pattern of price manipulation that leaves retail investors at a loss.
A Look Back – The 2024 Split Manipulation
The last time Atos conducted a share split (13,497 new shares for every 24 old shares), the price artificially pumped from €0.15 to €1.70 right before the official announcement. This created a false sense of demand, trapping investors at high prices, only for the stock to collapse afterward. Many retail traders ended up buying high and losing money.
Current Manipulation – Selling Off Before the Split
Now, we see a similar pattern playing out again—Atos is trading at record-low levels below €0.0030 ahead of the reverse split. This suggests that once the new shares start trading at a higher nominal price, investors may again face forced sell-offs and further declines, leading to more financial losses for shareholders.
Key Takeaways:
The reverse split does not add value—it only reduces the number of shares outstanding, while total market capitalization remains unchanged.
Shareholders with less than 10,000 shares must adjust their positions before April 23, 2025, or risk forced liquidation.
Without strong fundamentals, the post-split price may drop again, just like last time.
Investors should remain cautious and consider the risks before making any decisions. Atos must prove its financial stability rather than relying on stock restructuring to create the illusion of recovery.
IONQ Options Ahead of Earnings If you haven`t bought IONQ before the rally:
Now analyzing the options chain and the chart patterns of IONQ prior to the earnings report this week,
I would consider purchasing the 30usd strike price Calls with
an expiration date of 2025-4-17,
for a premium of approximately $5.15.
If these options prove to be profitable prior to the earnings release, I would sell at least half of them.

Can Quantum Leap Us into the Cosmos?Boeing's venture into the quantum realm is not just an exploration; it's a bold leap forward into a universe where technology transcends traditional boundaries. Through its involvement in the Quantum in Space Collaboration and the pioneering Q4S satellite project, Boeing is at the forefront of harnessing quantum mechanics for space applications. This initiative promises to revolutionize how we communicate, navigate, and secure data across the vast expanse of space, potentially unlocking new realms of scientific discovery and commercial opportunity.
Imagine a world where quantum sensors offer unprecedented precision, where quantum computers process data at speeds and volumes previously unimagined, and where communications are secured beyond the reach of conventional decryption. Boeing's efforts are not merely about technological advancement; they are about redefining the very fabric of space exploration and security. By demonstrating quantum entanglement swapping in orbit with the Q4S satellite, Boeing is laying the groundwork for a global quantum internet. This network could connect Earth to the stars with unbreakable security and accuracy.
This journey into quantum space technology challenges our understanding of physics and our expectations for the future. With its history of aerospace innovation, Boeing is now poised to lead in an area where the stakes are as high as the potential rewards. The implications of this work extend far beyond secure communications; they touch on every aspect of space utilization, from manufacturing in microgravity to precise environmental monitoring of our planet and beyond. As we stand on the brink of this new frontier, the question isn't just about what quantum technology can do for space, but how it will transform our very approach to living, exploring, and understanding the cosmos.

Long $QSI Now!!! The next Bull Rally is coming to $2.60 - $3.20Here is my #QSI trading plan:
Long entry at as close as $2.00
If you are just short term trader, let's setup the Stop Loss whenever the 4H candlestick close below $1.70. If you are an hodler, just hold it to the moon.
1st Target for Swing trader at $2.60
2nd Target is $3.20.
My open interest Options is Buy call strike $5.00, exp March 21, 2025.
Because I believe that in QSI's earning call on March 3, 2025 they will bring a lot of good news on the technical side as well as update the cooperation process and initial results after cooperating with NVDA to apply NVDA's Quantum AI to protein biotechnology research.
Buy Call strike $5 expire date on March 21, 2025 is only priced under $0.10/Buy Call Option (Current price on 2/13/2025) may increase to $0.20/Buy Call Option next week and $0.20 - $0.30 when that close to ER date. This price is too cheap to avoid the afraid of losing.
One more reason I "double down" to #QSI because who knows how the Quantum stock market will react after Robinhood launched an introduction to the Quantum Computer investment like the next trend and positive information about the business situation of Quantum-Si #QSI. That Robinhood's article must have had a huge impact on sub $10 quantum computing companies like #QBTS ($6.50), #QUTB ($8.28), and even #QSI ($2.00), even though Quantum-Si only applies this technology to research and develop the medicine and pharmaceuticals, not a developer or manufacturer of quantum computers.
Robinhood newest article about Quantum Computing: learn.robinhood.com
Disclaimer

QUBT Long Potential Reversal from Demand ZoneThe Quantum Computing Inc. (QUBT) stock has retraced to a 15min demand zone after a strong rally. With confluences from RSI, volume profile, and order blocks, a reversal seems plausible.
Strategy: Look for bullish confirmation (e.g., break above $10.70 or crossing the trend line before entering the trade.
Trade Plan:
Entry: ~$10.60
Stop Loss: $10.12
Take Profit: $13.44
Position Size: Adjust based on risk tolerance, ensuring 1% account risk per trade.
(RRR): Approximately 1:6,
Risk Management:
If the price closes below the demand zone ($10.05), then avoid entering the trade if bearish momentum increases below $10.05
Trade Advice:
Plan Your Trade:
Define your entry, stop loss, and target levels before placing the trade.
Stick to your risk management plan, risking no more than 1-2% of your account per trade.
Wait for Confirmation:
Look for additional confirmation signals (e.g., a bullish candle pattern or a surge in volume) before entering the trade.
Set Alerts:
Use alerts to monitor key levels like $10.50 (for potential entry) and $10.01 (for stop loss).
Be Prepared for Volatility:
Stocks like QUBT may experience sudden price swings. Use appropriate position sizing and avoid overleveraging.
Review and Learn:
Analyze the trade outcome, whether successful or not, to identify lessons for future setups.
"Trading requires patience, discipline, and a solid understanding of risk management. Never trade with money you cannot afford to lose."

AI and quantum stocks are slightly getting back on track. $LAESAfter savoring a delicious sip of NASDAQ:REBN coffee, we’re reminded of that perfect Christmas gift from NASDAQ:LAES —ideal for fans of mid- and long-term trading. And it’s free for our swing trader subscribers!

RGTI: both ways potential Chart on the daily looks like being in no-mans is about to decide of its further direction.
I have two main alternatives:
1. If price moves above Jan 24th highs the road is opened to following resistance zone: 20-25, 28-33 and a push towards ideal macro-resistance target at 37-45 levels;
2. If price break down bellow Feb 3rd lows, odds are moving in favour of one potential leg down to potentially test 4-3 macro support levels.
Weekly macro view:
Thank you for your attention!

QTUMUSDT(Quantum) Updated till 01-02-25QTUMUSDT(Quantum) Daily timeframe range. we can see a nice push here. tried to break through 4.564. but bag holders took out profit at 4.564 so buyers needs to hold above 3.529 to continue the push. PA holding on its midrange decently for a while now.

Hobo is Deepseek exposure: could run hard!The market has woken up to bad news from China with Deepseek. Not going into detail but its generally bad for semiconductors, especially NVDA - which is quite high priced (understatement).
Been looking for opportunities on the other side of this trade and found HOLO. They will be using DeepSeek R1 as the model for their holographic AI engine. Thing is: Deepseek is the hype (just like AI and Quantum was before) and HOLO is probably one of the few stocks that offers exposure AND its only sitting at a 33 million market cap. Jokes, much higher! First target: $7, if rally can sustain for multiple weeks: $18.
I literally just bought, i honestly dont care if it pumped 50% pre-market - its a sign of strength. Let's see, obviously a risky play but also makes a lot of sense. Chart looks good after a retest of previous resistance.

Fractal Phenomenon Proves Simulation Hypothesis?The humanity is accelerating towards the times when virtual worlds will get so realistic that their inhabitants gain consciousness without realizing they exist in a simulation. The idea that we might be living in a simulation was widely introduced in 2003 by philosopher Nick Bostrom. He argued that if the civilization can create realistic simulations, the probability that we are living in one is extremely high.
Modern games only render areas that the player is observing, much like how reality might function in a simulation. Similarly, texture of game environments update as soon as they are viewed, reinforcing the idea that observation determines what is rendered.
QUANTUM MECHANICS: The Ultimate Clue
Quantum Mechanics challenges our fundamental understanding of reality, revealing a universe that behaves more like a computational process than a physical construct. The wave function (Ψ) describes a probability distribution, defining where a particle might be found. However, upon measurement, the particle’s position collapses into a definite state, raising a paradox: why does the smooth evolution of the wave function lead to discrete outcomes? This behavior mirrors how digital simulations optimize resources by rendering only what is observed, suggesting that reality itself may function as an information-processing system.
The Born Rule reinforces this perspective by asserting that the probability of finding a particle at a given location is determined by the square of the wave function’s amplitude (|Ψ|²). This principle introduced probability into the very foundations of physics, replacing classical determinism with a probabilistic framework. Einstein famously resisted this notion, declaring, “God does not play dice,” yet Quantum Mechanics has since revealed that randomness and structure are not opposing forces but intertwined aspects of reality. If probability governs the fabric of our universe, it aligns with how simulations generate dynamic outcomes based on algorithmic rules rather than fixed physical laws.
One of the most striking paradoxes supporting the Simulation Hypothesis is Schrödinger’s Cat, which illustrates the conflict between quantum superposition and observation. In a sealed box, a cat is both alive and dead until an observer opens the box, collapsing the wave function into a single state. This suggests that reality does not exist in a definite form until it is observed—just as digital environments in a simulation are rendered only when needed.
Similarly, superposition demonstrates that a particle exists in multiple states until measured, while entanglement reveals that two particles can be instantaneously correlated across vast distances, defying classical locality. These phenomena hint at an underlying informational structure, much like a networked computational system where data is processed and linked instantaneously.
Hugh Everett’s Many-Worlds Interpretation (MWI) takes this concept further by suggesting that reality does not collapse into a single outcome but instead branches into parallel universes, where each possible event occurs. Rather than a singular, objective reality, MWI posits that we exist within a constantly expanding system of computational possibilities—much like a simulation running countless parallel computations. Sean Carroll supports this view, arguing that the wave function itself is the fundamental reality, and measurements merely reveal different branches of an underlying universal structure.
If our reality behaves like a quantum computational system—where probability governs outcomes, observation dictates existence, and parallel computations generate multiple possibilities—then the Simulation Hypothesis becomes a compelling explanation. The universe’s adherence to mathematical laws, discrete quantum states, and non-local interactions mirrors the behavior of an advanced simulation, where data is processed and rendered in real-time based on observational inputs. In this view, consciousness itself may act as the observer that dictates what is “rendered,” reinforcing the idea that we exist not in an independent, physical universe, but within a sophisticated computational framework indistinguishable from reality.
Fractals - Another Blueprint of the MATRIX?
Price movements wired by multi-cycles shaping market complexity. Long-term cycles define the broader trend, while short-term fluctuations create oscillations within that structure. Bitcoin’s movement influencing Altcoins exemplifies market entanglement—assets affecting each other, much like quantum particles. A single event in a correlated market can ripple across the entire system like in Butterfly effect. Just as a quantum particle exists in multiple states until observed, price action is a probability field—potential breakouts and breakdowns coexist until liquidity shifts. Before a definite major move, the market, like Schrödinger’s cat, remains both bullish and bearish until revealed by Fractal Hierarchy.
(Model using Weierstrass Function )
A full fractal cycle consists of multiple oscillations that repeat in a structured yet complex manner. These cycles reflect the inherent scale-invariance of market movements—where the same structural patterns appear.. By visualizing the full fractal cycle:
• We observe the relationship between micro-movements and macro-structures.
• We track the transformation of price behavior as the fractal unfolds across time.
• We avoid misleading interpretations that come from looking at an incomplete cycle, which may appear random or noisy
From Wave of Probability to Reality
1. Fractal Probability Waves – The market does not move in a straight line but rather follows a probabilistic fractal wave, where past structures influence future movements.
2. Emerging Reality – As the price action unfolds, these probability waves materialize, turning potential fractal paths into actual price trends.
3. Scaling Effect – The same cyclical behavior repeats at different scales (6H vs. 1W in this case), reinforcing the concept that price movements are self-similar and probabilistically driven.
If psychology of masses that shapes price dynamics is governed by mathematical sequences found in nature, it strongly supports the Simulation Hypothesis
Do you think we live in a simulation? Let’s discuss in comments!

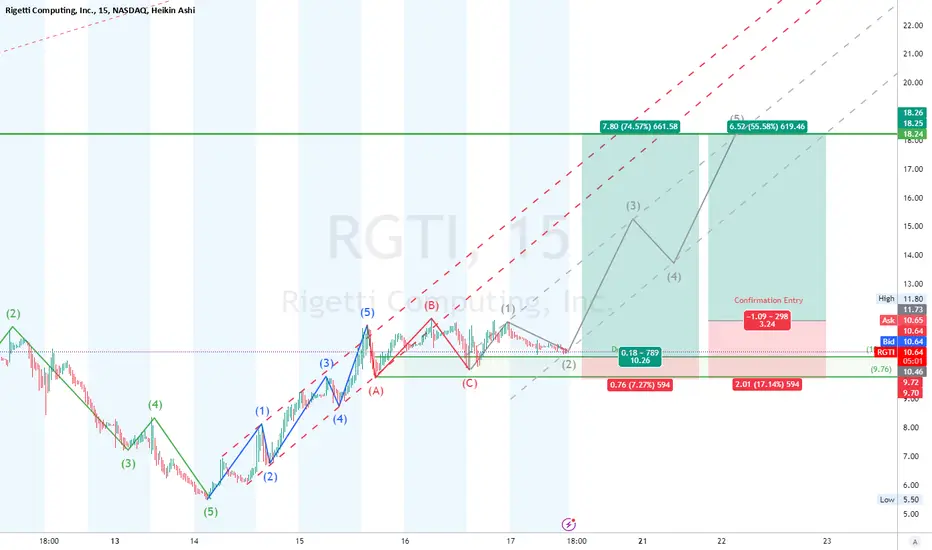
Rigetti Computing Inc. (RGTI) Long SetupRigetti Computing Inc. (RGTI) price appears to be completing ABC correction in the 15min chart, possibly completed wave (2) of an impulse wave structure and is set for a potential bullish continuation into wave (3).
Setup:
RGTI is completing wave (2) correction and is poised to enter wave (3), targeting higher levels.
Strategy:
Enter at current levels or wait for confirmation of bullish momentum breaking above $11.79.
Trade Plan:
Entry: $10.46, or confirmation entry $11.79
Stop Loss: $9.70
Take Profit: $18.26
Position Size: Adjust to limit risk to 1-2% of account equity.
Risk-Reward Ratio:
Entry at $10.26 with a stop at $9.70 and target at $18.26 offers an RRR of approximately 1:10.
Confirmation Entry RRR is ~1:3
Confirmation:
Monitor for bullish candlestick patterns or a breakout above the $11.70 level to confirm the start of wave (3).
Disclaimer:
This analysis is for educational purposes only. Trading financial markets involves risk, and you should not trade with money you cannot afford to lose. Past performance is not indicative of future results. Consult a licensed financial advisor before making any trading decisions.
Trade Advice:
Stick to your risk management rules and avoid overleveraging.
If the price breaks below $9.70, then the trade is not valid for confirmation entry.
Use alerts to monitor key levels ($11.7 for confirmation and $9.70 for the stop loss).