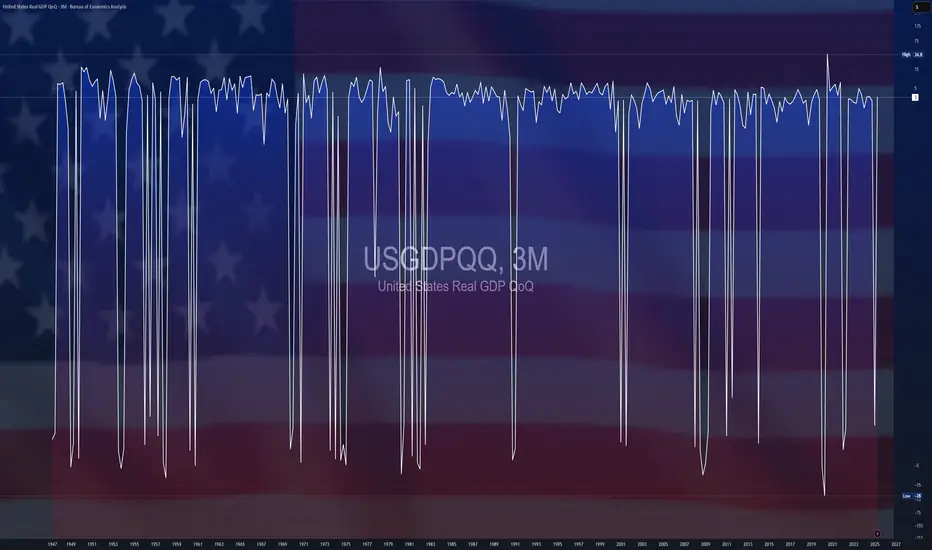
$USGDPQQ -U.S Economic Growth Outpaces Forecasts (Q2/2025)ECONOMICS:USGDPQQ 3%
Q2/2025
source: U.S. Bureau of Economic Analysis
- The US economy grew at an annualized rate of 3% in Q2 2025,
sharply rebounding from a 0.5% contraction in Q1 and exceeding market expectations of 2.4% growth, largely driven by a decline in imports and a solid increase in consumer spending.
However, the gains were partly offset by weaker investment and lower exports.
Quarterly
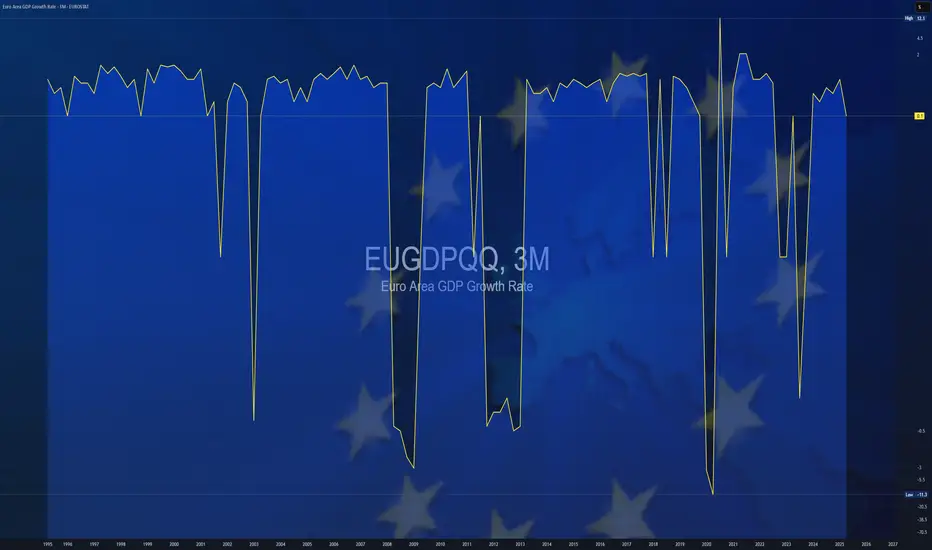
$EUGDPQQ -Europe GDP (Q2/2025)ECONOMICS:EUGDPQQ
Q2/2025
source : EUROSTAT
- The Gross Domestic Product (GDP) In the Euro-Area expanded 0.10 percent in the second quarter of 2025 over the previous quarter.
GDP Growth Rate in the Euro Area averaged 0.37 percent from 1995 until 2025, reaching an all time high of 11.60 percent in the third quarter of 2020 and a record low of -11.10 percent in the second quarter of 2020.
$CNGDPYY -China GDP Growth Slows Less Than Expected (Q2/2025)ECONOMICS:CNGDPYY
Q2/2025
source: National Bureau of Statistics of China
- China’s economy expanded 5.2% yoy in Q2 2025, easing from 5.4% in the prior two quarters and marking the softest pace since Q3 2024.
Still, the latest reading narrowly beat estimates of 5.1%, supported in part by Beijing’s policy measures amid a fragile trade truce.
Growth momentum in H2 is projected to weaken further, due to headwinds from trade tensions, deflation risks, and a prolonged property slump.

Bitcoin's 4-year bullish cycle is coming to an end.The price reversal and manipulation zone could be between $120K and $133K, indicating a big bearish movement.
Quarterly analysis indicates a target of approximately $24,750.
QT + ICT + SMC
- Sainty

SWDY Future ReboundSWDY stock is trying to peak up, but unfortunately, it's rebounding back from the resistance line 80.081. It had already broken the support line 78.989. In case of continuing, it'll break the support line 78.928 till reaching the support line 78.868. In case of rising, it'll breach the 1st resistance line at 79.199, the 2nd resistance line at 79.320, and the 3rd resistance line at 79.470, which is more recommended due to its Q1 Profit Rise, which achieved EGP 4.15 Billion versus EGP 3.98 Billion a year ago beside its Q1 revenue EGP 59.39 Billion versus EGP 45.25 Billion a year ago.

$JPGDBQQ -Japan's GDP Shrinks More than Expected (Q1/2025)$JPGDBQQ
Q1/2025
source: Cabinet Office, Japan
- Japan's GDP shrank 0.2% qoq in Q1 of 2025, compared with forecasts of a 0.1% fall and after a 0.6% growth in Q4, flash data showed.
It was the first GDP contraction in a year, amid worries over the impact of US trade policy under President Donald Trump.
On an annualized basis, the economy contracted 0.7%, worse than consensus of a 0.2% drop and a reversal from an upwardly revised 2.4% gain in Q4.

$EUGDPQQ -Eurozone GDP Growth Rate Beats Forecasts (Q1/2025)ECONOMICS:EUGDPQQ
Q1/2025
source: EUROSTAT
-The Eurozone economy grew by 0.4% in the first quarter of 2025,
accelerating from 0.2% in the previous quarter and exceeding market expectations of 0.2%.

$USGDPQQ -U.S Economy Unexpectedly Contracts in Q1/2025ECONOMICS:USGDPQQ
Q1/2025
source: U.S. Bureau of Economic Analysis
-U.S economy shrank 0.3% in Q1 2025, the first contraction since Q1 2022,
versus 2.4% growth in Q4 and expectations of 0.3% expansion, as rising trade tensions weighed on the economy.
Net exports cut nearly 5 percentage points from GDP as imports jumped over 40%. Consumer spending rose just 1.8%,
the weakest since mid-2023, while federal government outlays fell 5.1%, the most since Q1 2022.

$USGDPQQ -United States GDP (Q4/2024)ECONOMICS:USGDPQQ 2.3%
Q4/2024
source: U.S. Bureau of Economic Analysis
- The US economy expanded an annualized 2.3% in Q4 2024, the slowest growth in three quarters, down from 3.1% in Q3 and in line with the advance estimate.
Personal consumption remained the main driver of growth, increasing 4.2%, the most since Q1 2023, in line with the advance estimate.
Spending rose for both goods (6.1%) and services (3.3%).
Also, exports fell slightly less (-0.5% vs -0.8%) and imports declined slightly more than initially anticipated (-1.2% vs -0.8%), leaving the contribution from net trade positive at 0.12 pp.
Government expenditure also rose more (2.9% vs 2.5%).
Private inventories cut 0.81 pp from the growth, less than 0.93 pp.
On the other hand, fixed investment contracted more (-1.4% vs -0.6%), due to equipment (-9% vs -7.8%) and as investment in intellectual property products failed to rise (0% vs 2.6%).
Residential investment however, rose more than initially anticipated (5.4% vs 5.3%).
Considering full 2024, the economy advanced 2.8%.

$USGDPQQ -US Economy Slows More than ExpectedECONOMICS:USGDPQQ 2.3%
(Q4/2024)
source: U.S. Bureau of Economic Analysis
- The US economy expanded an annualized 2.3% in Q4 2024, the slowest growth in three quarters, down from 3.1% in Q3 and forecasts of 2.6%.
Personal consumption remained the main driver of growth, but fixed investment and exports contracted.
Considering full 2024, the economy advanced 2.8%.

$CNGDPYY -China 2024 GDP Meets Official Target ECONOMICS:CNGDPYY
Q4/2024
- The Chinese economy expanded by 5.4% yoy in Q4 2024, topping estimates of 5.0% and accelerating from a 4.6% rise in Q3.
It was the strongest annual growth rate in 1-1/2 years, boosted by a series of stimulus measures introduced since September to boost recovery and regain confidence.
For full year, the GDP grew by 5.0%, aligning with Beijing's target of around 5% but falling short of a 5.2% rise in 2023.

$USGDPQQ -U.S GDP (Q3/2024)ECONOMICS:USGDPQQ
(Q3/2024)
source: U.S. Bureau of Economic Analysis
- The US economy expanded an annualized 3.1% in Q3, higher than 2.8% in the 2nd estimate and above 3% in Q2.
The update primarily reflected upward revisions to exports and consumer spending that were partly offset by a downward revision to private inventory investment.
Imports, which are a subtraction in the calculation of GDP, were revised up.

ETH Week 49When looking at the weekly chart of BINANCE:ETHUSDT.P we find a Yearly Q4 gap in Weekly chart that we are just about to close above it with Daily PSP that closes above it (there are still 2H left for the daily candle).
This makes be believe we'll keep this bull run until 4420$

$USGDPQQ -U.S GDP (Q3/2024)ECONOMICS:USGDPQQ 2.8%
Q3/2024
source: U.S. Bureau of Economic Analysis
-The US economy expanded an annualized 2.8% in Q3 2024,
below 3% in Q2 and forecasts of 3%, the advance estimate from the BEA showed.
Personal spending increased at the fastest pace since Q1 2023 (3.7% vs 2.8% in Q2),
boosted by a 6% surge in consumption of goods (6% vs 3%) and a robust spending on services (2.6% vs 2.7%), mostly prescription drugs, motor vehicles and parts, outpatient services and food services and accommodations.
Government consumption also rose more (5% vs 3.1%), led by defense spending.
In addition, the contribution from net trade was less negative (-0.56 pp vs -0.9 pp), with both exports (8.9% vs 1%) and imports (11.2% vs 7.6%) soaring, led by capital goods, excluding autos. On the other hand, private inventories dragged 0.17 pp from the growth, after adding 1.05 pp in Q2.
Also, fixed investment slowed (1.3% vs 2.3%), led by a decline in structures (-4% vs 0.2%) and residential investment (-5.1% vs -2.8%).
Investment in equipment however, soared (11.1% vs 9.8%).

$EUGDPQQ -Europe's GDP (Q3/2024) ECONOMICS:EUGDPQQ 0.4%
Q3/2024
source: EUROSTAT
- The Eurozone GDP expanded 0.4% on quarter in the three months to September 2024,
the strongest growth rate in two years, following a 0.2% rise in Q2 and above forecasts of 0.2%
The German economy expanded 0.2%, surprisingly avoiding a recession, after a downwardly revised 0.3% decline in Q2.
GDP growth also quickened in France (0.4% vs 0.2% in Q2) and the Spanish economy remained robust (0.8% vs 0.8%).
In addition, the Portuguese economy grew 0.2%, the same as in Q2 while the GDP in Ireland (2% vs -1%) and Austria (0.3% vs 0%) rebounded and grew faster in Lithuania (1.1% vs 0.3%).
On the other hand, the Italian economy stalled, following a 0.2% rise in Q2 and Latvia remained in contraction (-0.4% vs -0.3%). Year-on-year, the Eurozone GDP expanded 0.9%, the best performance since the Q1 2023, compared to a 0.6% rise in the previous quarter and higher than forecasts of 0.8%.
The ECB expects the GDP in the Eurozone to expand 0.8% this year.

$CNGDPYY - China's GDP (Q3/2024)ECONOMICS:CNGDPYY Q3/2024
source: National Bureau of Statistics of China
-The Chinese economy expanded 4.6% YoY in Q3 of 2024,
compared with market forecasts of 4.5% and a 4.7% rise in Q2.
It marked the slowest annual growth rate since Q1 2023, amid persistent property weakness, shaky domestic demand, deflation risks, and trade frictions with the West.
The latest figures came as Beijing had intensified stimulus measures to boost economic recovery and rebuild confidence.
In September alone, there were some positive signs:
industrial output and retail sales both saw their largest increases in four months, and the urban jobless rate fell to a three-month low of 5.1%.
On the trade front, however, exports rose the least in five months while imports were sluggish. In the first three quarters of the year, the economy grew by 4.8%, compared with China’s full-year target of around 5%.
During the period, fixed investment rose by 3.4% yoy, topping consensus of 3.3%.

Euro-Zone GDP Quarterly *3M (QoQ)ECONOMICS:EUGDPQQ (+0.3 %)
Q1/2024
source: EUROSTAT
The Eurozone’s economy expanded by 0.3% in the first quarter of 2024, the fastest growth rate since the third quarter of 2022, to beat market expectations of a marginal 0.1% expansion and gain traction following muted readings since the fourth quarter of 2022.
The result added leeway for the European Central Bank to refrain from cutting rates to a larger extent this year should inflationary pressures prove to be more stubborn than previously expected.
Among the currency bloc’s largest economies, both the German and the French GDPs expanded by 0.2%, while that from Italy grew by 0.3% and that from Spain expanded by 0.7%, all above market estimates.
Compared to the same quarter of the previous year ECONOMICS:EUGDPYY ,
the Eurozone’s GDP grew by 0.4%, beating market expectations of 0.2%, and gaining traction after two straight quarters of 0.1% growth.

Russel 2000 - Consolidation into Q3
Hey Guys,
For this Index the Consolidation period has been there since the big Engulfing Candle on the Yearly Chart happened in 22.
To become bullish again Russel has to move beyond 2280 (-1625 is the lower end with a mid-point of 1940)…
Until then I will take a neutral bias towards this Index. Most likely we will consolidate on the 3D Chart between the two white lines - Demand and Supply Lines from the Quarterly Chart. Keep in mind that the Blue Box is the High of 23 and the Red Box Constitutes the Middle Line of 22.
I am looking to go long from the lower part and short from the upper part of the Consolidation - until a break occurs.
Normally I would enter on the 4h or 2h Chart but I will break it down to the 1H Chart because I like to take entries from there (Risk - Reward wise).
Thanks for reading

Nasdaq Buy to SellSimple charting of HOW we should READ the MARKET/PA/ETC!! Focus not just on the structure(PRICE), but also TIME. We need to approach the market as if we are DOCTORS having OPEN Surgery..Each blue b0x is 6 h0urs, study the FL0W EACH 6H0urs then APPLY the FRACTAL "doubling down theory" Im SELLING MNQ1! the whole week unless proven wrong then I'll catch a trade next week. The BUY is the illusion in my eyes. (Monday & Asia High)Weak SSL rest at the top. Tuesday is Manipulation day.

M6E1! Bearish Continuation This is the market every 15 days. Price have SSL intact while its almost done creating internal BSL (for it to buy up to grab later). Price might not reverse to buyside til next Thur/Fri. We just wait and see.

Nissan Motors Long ScenarioI think it will be bullish til 2026. A stock I might just buy til then.! Price is in the manipulation area(quad 2/green box), where it showed false sell run as price ran it within the next 3 years. If price make it to (quad 3/blue zone) bullish; thats the confirmation to upside. Will Come back to this after a while.

Some thoughtsThinking of how quarterly Daye theory affects or reflexts price action.
Interesting how fridays role is changing but also how we cycle through xAMD or AMDx
Notice how this week we had last Friday as ACC and then Monday we were manipulating as for Tuesday and Wednesday to be the distribution and continuation days.
it actually maps pretty well with the Thursday being the day before NFP for which i believe to be a seek and destroy day aka ACCUMULATION and for Friday (NFP day) to be the manipulation day. I will stay out of trading these 2 days.

DXY Outlook (1st Qtr 2024)Last year, despite the volatility in the markets (fight against inflation, SVB collapse, conflict in Gaza....) the DXY traded in a slightly consolidative range, between the 100 and 107 price levels (compared to 2022, where the DXY rose from 95 up to almost 115).
The theme of the first quarter of 2024 is likely to be about if/when the Federal Reserve would begin to cut rates, from the current level of 5.25% down to 5%.
Based on the CME FedWatch Tool, the Feds are likely to keep rates on hold in January, but there is a 72.4% chance of a rate cut at the March 2024 meeting.
The DXY is currently at the 101.50 price level, finding support at the 100-round number area and the longer-term 61.8% Fibonacci retracement level at the 99.25 price level.
A retrace to the upside can be anticipated early in the quarter. However, the upper bound of the bearish channel and the resistance level at the 104 price level could limit further moves to the upside.
Look out for inflation and employment data to continue to support the Fed's view for rate cuts in March. This could lead the DXY to continue trading within the bearish channel.
If the price breaks below the support level of 99.25, the DXY could trade down to the major support level of 95, and the lower bound of the bearish channel.
Major Events to Watch
5th Jan: Non-Farm Employment Change
11th Jan: CPI y/y
26th Jan: Core PCE Price Index
1st Feb: Federal Funds Rate Decision and statement
2nd Feb: Non-Farm Employment Change
13th Feb: CPI y/y
29th Feb: Core PCE Price Index
8th Mar: Non-Farm Employment Change
12th Mar: CPI y/y
21st Mar: Federal Funds Rate Decision
