QM Level Trading GBP NZDI just learn Quasimodo Trading Technic
So I test for Sell FX:GBPNZD at QM level and MPL ad 1.94375. let see what happen
Good luck
RB
Quasimodo

Swing Supply & Demand USDCAD 09/08/18Those are the next critical Supply&Demand for USDCAD.
It seems that both levels holding many unfilled orders, those orders
Are waiting for the price to come back, the demand below seems like
A pattern called Quasimodo, if the price will back to that demand I'll buy
There, my target will be the supply above which is also a great level of sell
Position, I'll sell at this supply if the price hit that level,

Quasimodo Level GOLD 29/07/18For the intraday terms the GOLD seems to be bullish,
As it looks the price tends to reach the resistance above,
If the price retrace the demand below before reaches the resistance,
It will be a great opportunity for buy position with the resistance above
As a target, the demand below is also Quasimodo level, usually, it's a
Reliable and strong pattern.

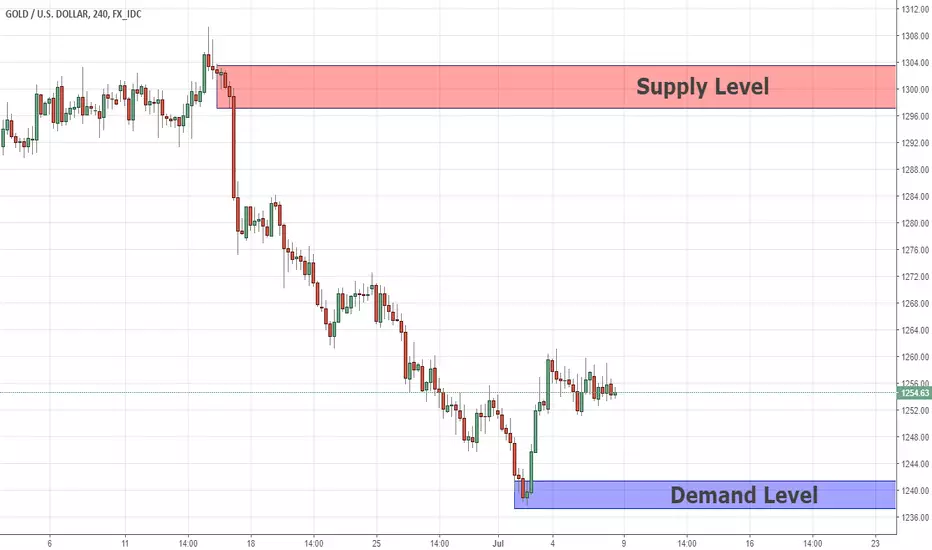
Key Level GOLD 08/07/18Those are the next key level to look for a swing position on GOLD.
The demand below is a great level for buy position, the pattern looks
Like a Quasimodo level, if the price retrace that demand I'll buy there,
My target will be the supply above which is also a great level of sell position.
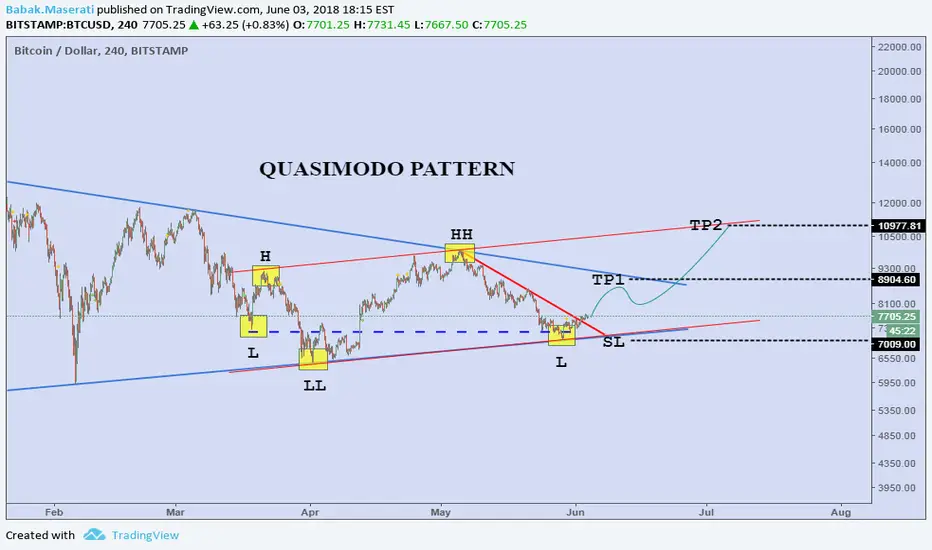
Quasimodo Long Signal Pattern on bitcoinQuasimodo Long Signal Pattern
Easy guide to trading the "Quasimodo Pattern"
The Quasimodo Pattern or Over and Under pattern is a relatively new entrant to the field of technical analysis in the financial markets. Although new, the Quasimodo pattern is a commonly occurring theme that is more frequent when price carves a top or a bottom or when price begins a major correction to the trend.
The Quasimodo Pattern, although complex as it might seem is actually very simple. This trading pattern is especially powerful because when it occurs, in most cases, traders will notice a confluence with other methods of analysis.
For example, when a trader spots a Quasimodo pattern near a support or resistance level , it increases the confidence of the trader or the trading probability. Likewise, when trading divergences, when you spot a Quasimodo pattern, that confluence can be used to trade the divergence set up with more confidence.
As we can see from the above, the Quasimodo pattern is not a trading strategy by itself but is more of a confluence pattern that can be used to confirm a trader’s bias. Of course, the Quasimodo pattern doesn’t appear all the time, but when it does, traders can be sure that the market offers a high probability trade set up.
What is the Quasimodo (Over and Under) Pattern?
A Quasimodo Pattern is simply a series of Highs/Lows and Higher or Lower highs or lows.
There should be a prior downtrend in the markets
Price makes new low then makes a small rally and forms a local high
Price then declines to form a new lower low taking out the previous low
Price then rallies to make a new higher high and then declines
The final decline is equal to the first low
The fifth leg in this pattern is the trigger for long positions with stops set to at or below the lower low
TP1=8900$
TP2=11000$
SL=7000$
Swing Analysis USDCAD 31/05/18Those are the next critical levels to look for a swing position on USDCAD.
The supply above is a great one of sell position, the price drop from there very fast,
It seems there are more unfilled orders waiting for the price to come back, i'll sell at this supply,
The demand below is a great level of buy position, seems like Quasimodo level, i'll buy at this demand .
The5%ers Proprietary Trading Fund will double your trading balance every 10% profit.

Intraday Analysis EURUSD 21/05/18Those are the next critical levels for intraday position on EURUSD.
The demand below is a great level for buy position, it's a Quasimodo level,
If the price will back to this demand i'll buy there, the supply above is a great
Level of sell position, if the price will reach that level i'll sell there, both levels
Are good for the intraday terms.

Swing Analysis USDCAD 10/05/18Those are the next critical levels for swing positions on USDCAD.
At the moment it seems the momentum became bearish and price tends to
Reach the demands below, above there is a great supply level which is also quasimodo.
If the price will back to this supply i'll sell there as a continuation trade, my targets will
Be the demand below and the one at the bottom which is also a great level of buy position.

Quasimodo Long Signal Pattern in Bitcoin Quasimodo Long Signal Pattern
Easy guide to trading the "Quasimodo Pattern"
The Quasimodo Pattern or Over and Under pattern is a relatively new entrant to the field of technical analysis in the financial markets. Although new, the Quasimodo pattern is a commonly occurring theme that is more frequent when price carves a top or a bottom or when price begins a major correction to the trend.
The Quasimodo Pattern, although complex as it might seem is actually very simple. This trading pattern is especially powerful because when it occurs, in most cases, traders will notice a confluence with other methods of analysis.
For example, when a trader spots a Quasimodo pattern near a support or resistance level, it increases the confidence of the trader or the trading probability. Likewise, when trading divergences, when you spot a Quasimodo pattern, that confluence can be used to trade the divergence set up with more confidence.
As we can see from the above, the Quasimodo pattern is not a trading strategy by itself but is more of a confluence pattern that can be used to confirm a trader’s bias. Of course, the Quasimodo pattern doesn’t appear all the time, but when it does, traders can be sure that the market offers a high probability trade set up.
What is the Quasimodo (Over and Under) Pattern?
A Quasimodo Pattern is simply a series of Highs/Lows and Higher or Lower highs or lows.
There should be a prior downtrend in the markets
Price makes new low then makes a small rally and forms a local high
Price then declines to form a new lower low taking out the previous low
Price then rallies to make a new higher high and then declines
The final decline is equal to the first low
The fifth leg in this pattern is the trigger for long positions with stops set to at or below the lower low
tp1 = 7712$
tp2= 8245 $
sl= 6300 $

Intraday analysis GBPJPY 04/04/18For the intraday or scalping traders, those are the next fresh supply & demand
In GBPJPY to look for an intraday position, the demand below is a great
Level of buy position and the supply above is a great level of sell position.
This supply is also a Quasimodo level.


Intraday analysis GBPUSD 28/03/18Those are the next fresh supply and demand for an intraday position.
The way that the price drop from the supply above indicates on unfilled
Orders that stay there and waiting for the price to come back, therefore if the
Price back to this supply I'll sell there, the same scenario is the demand below,
If the price back there I'll buy at this level.

NZDUSD bat & Quasimodo NZDUSD Bat still not complete but price reach Quasimodo level and i expecting to move down to reach point D to change position to long

Intraday analysis GBPJPY 23/03/18Those are the next fresh supply & demand for intraday position on GBPJPY.
It seems that first, the price will reach the demand below which is Quasimodo level.
I'll buy at this demand, my target will be the supply above which is also a great level
Of sell position, both opportunities are for the intraday term.


Intraday analysis EURUSD 22/03/18For the intraday terms, I marked the next fresh supply & demand,
Both levels are great for day trade position, the supply above seems like
Quasimodo level and a great level of sell position, I'll sell at this supply and
Buy at the demand below.

Quasimodo Levels EURJPY 20/03/18There are two levels of intraday positions at the EURJPY, there is a fresh supply
Above us and fresh demand below, both levels are Quasimodo levels,
i'll sell at the supply above and buy at the demand below.

Key Levels USDCAD 25/02/2018Those are the key levels of the swing term for USDCAD, at the moment it seems
The price tends to reach the supply above, therefore if the price will back to the demand
Below, it can be a great continuation trade, i'll buy there, the demand at the bottom is also
Quasimodo level and also great level of buy position, and the supply above is a great level
Of reversal opportunity, all 3 levels have a great risk-reward ratio potential.

Key Levels USDCHF 22/02/2018 Those are the key levels for USDCHF, if the price will break the support
Level below it indicates the price tends to reach the demand at the bottom,
In that case, i'll look for reason to sell in order to join the price until he will
Reach the demand, the demand at the bottom is also a great level for buy position,
Above us there is great supply level ( Quasimodo ) if the price reach that level i'll sell there.

Quasimodo Level S&P 500 02/02/2018The supply above us is a great Quasimodo level, since the price broke
The last low from the recent uptrend there is a high probability the price
Now tends to reach the demand at the bottom, i'll sell at the supply above.
My first target will be the demand below, and final target is the demand at the bottom.

Key Levels GBPAUD 31/01/2018At the intraday terms, the GBPAUD seems to be bearish, above us
There is a great supply level, it's also a Quasimodo level, it seems that
The price now tends to reach the support below, therefore if the price
Will back to the supply above I'll sell there, and my target will be the support below.

Key Levels USDJPY 29/01/2018Those are the next great levels for day trade opportunity on USDJPY.
Both of them are Quasimodo levels, each one of them can have a
Great risk-reward potential, i'll buy at the demand below, and sell at
The supply above.
