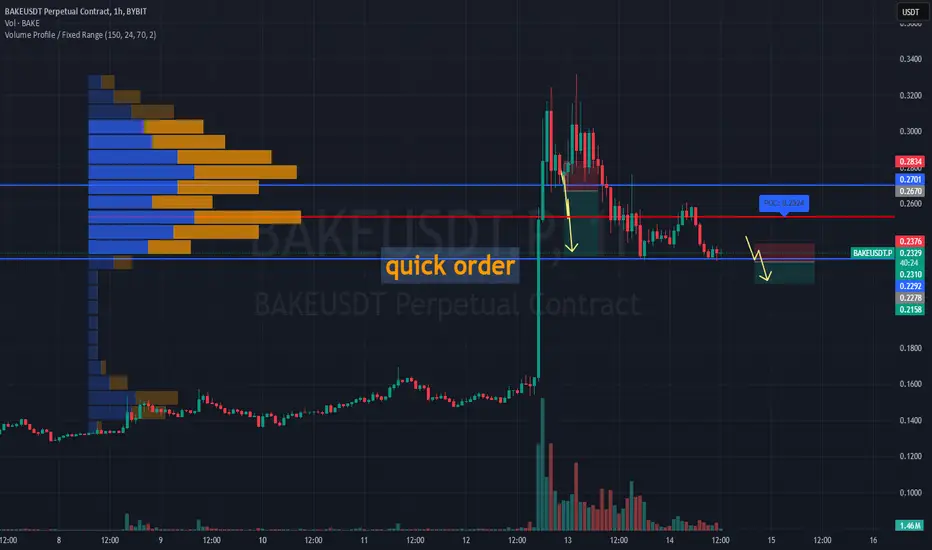
#BAKEUSDT – Quick Trade: Fast Short Opportunity!BYBIT:BAKEUSDT.P is showing weakness after breaking below the $0.2310 zone and consolidating lower. Sellers are in control, price remains below POC $0.2524, and volume confirms bearish pressure.
👉 Key Takeaways:
⚡️ This is a fast trade – no waiting!
The goal is to set the order, take profit, and exit quickly.
⚡️ Fast entry – confirmed breakdown below $0.2278.
⚡️ Tight stop-loss – set at $0.2376 to minimize risk.
⚡️ Quick target – $0.2158, where a bounce may occur.
📉 SHORT BYBIT:BAKEUSDT.P from $0.2278
🛡 Stop Loss: $0.2376
⏱️ 1H Timeframe (Quick Trade!)
✅ Overview:
➡️ BYBIT:BAKEUSDT.P is trading below $0.2310, confirming buyer weakness.
➡️ Downward momentum remains strong, next support is at $0.2158.
➡️ This trade is designed for fast execution and exit at the target level.
⚡️ Plan:
➡️ Act fast – enter and exit without hesitation.
➡️ If price slows down before $0.2158, exit early.
➡️ Don’t chase the price – wait for a clean setup.
📍 Take Profit:
🎯 TP1: $0.2158 – exit zone.
📌 Don't chase – wait for clear execution!
📌 Strategy: Momentum + Quick Profit Target.
🚀 BYBIT:BAKEUSDT.P Breaking Support – Fast Short Opportunity!
Quickshort
NVDA... See What I Did Here....?Textbook mixed with a little thought process then check against 10 different indicators all pointing me in the same direction... either im right and equivalent to an indicator or im wrong and im equivalent to an indicator...

Short-term Trade Opportunity Approaching - AUDJPYQuick short idea I saw on the charts today:
HTF Recap (from former post - linked below):
We are currently at an impasse on the weekly chart as we could not create a higher high after a strong bullish trend. We recently mitigated the HTF supply zone and held at former strong support however we are now struggling to break our former high.
I believe that if we have any chance of a higher high, we will require a demand zone mitigation below after the strong bullish breakout we had. So this trade seems like a win-win – Either we grab liquidity below, take profit at demand and reanalyze for a potential bullflag push upward toward new highs – or we grab liquidity and continue to drop leaving our second take profit to gain and stop loss at breakeven
LTF Trade Opportunity:
We are sitting at a good spot to look out for short trades toward the demand zone.
Confluence:
1. 15 min – Symmetrical triangle and breakout potential. Resistance at fib 61.8% and 70.7%
2. Daily Chart - Top of descending channel (of potential bullflag for future long play)
3. Weekly resistance above and failure to create HH + Supply zone mitigation
I’m looking to enter on a retest of certain resistance levels (such as the strong fib levels above) and a subsequent CHoCH and supply zone mitigation.
If we don’t test upper resistance and drop straight from this top of channel, we will look for a retest of the bottom of the triangle/breakout and signals to enter from there.

Week 27: ZSN2021 A quick short opportunity Last week the support level did not break (yellow zone) and resulted a huge jump.
Early this week we saw the sellers were back in the market, however they didn't have enough momentum to push the price lower.
Based on today's chart reading, $14.63 is a good area to sell.
Stop Loss will be at $14.83 and Take Profit is at $14.20
This will give us RRR = 2.17R
Bullish momentum is still strong, so this will be a quick trade.

