Rally
ALL GOOD THINGS MUST COME TO AN ENDHello fellow traders!
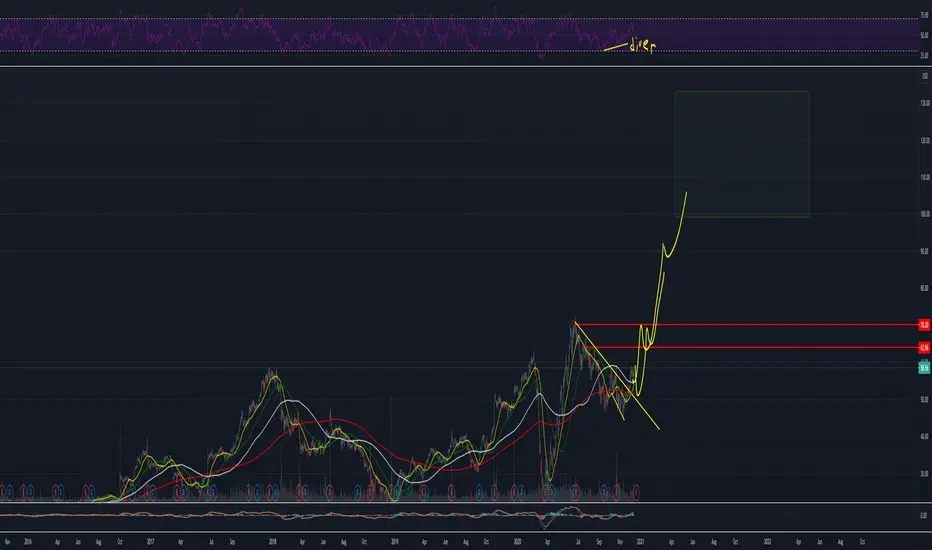
Nasdaq has been having a really enjoyable rally lately because of fundamental events that are currently happening in the macroeconomy. The news of possible vaccines and the widespread dispersal of it. Speculation has reached all time highs with investors and spectators sending warnings of a possible dip within markets. The world however has been recovering during the festive season meaning there are currently two things as a result of it.
(1) Places such as California in the United States Of America are heading into yet another lockdown meaning that retail is going to take a hit.
(2) People are heading into a spending frenzy because of the festive season and because of lockdowns, non-essential stores will be temporarily closed down meaning that we will have an increase in online spending so Amazon will be enjoying this time. Apple too has recently launched the most amount of products they have ever launched within such a small window meaning that it too will see a major increase.
It is important that we handle these all time highs with caution. In the perspective of a growth investor it means that the markets are overvalued at the moment but the growth is undervalued meaning that they are waiting for a minor dip and will invest and hold. A very bullish buyer will probably wait too for the markets to take a dip and invest more as 2021 is seen as a year of great growth and recovery. Interest rates at the moment are staying low in many markets as federal governments are trying to get money circulating in the economy again.
The green boxes are areas which I had entered in the past whilst the yellow box is my possible entry for a 200 point drop sell limit
I am still a student so please take my analysis with a grain of salt.
Comment down below if you would like to give me any advice or genuinely anything to motivate me.
Feel free to send me a message to discuss any ideas.

S&P Analysis Week of 12/13/2020: Will Selling Continue?S&P Analysis Week of 12/13/2020: Will Selling Continue?
Will the S&P continue to sell off this week or will it make new all time highs?
There has been a lot of whiplash and volatility over the year and last week was another good example. How many people thought they were in a good trade making profit only for the market to come back and take it away and some?
The market makers love to make investors look like fools and I expect that to continue this week.
My setups this week are pretty simple:
Trade #1 (long): This trade setup waits until we are back at all time highs. A break above this level (with a retest) would be a good bet we are going to see higher prices and/or a melt-up.
Note: Markets like to test the bottom of breakup candles and the top of breakdown candles. Do not be surprised or frustrated if price climbs back up to this point. It could just be a retest, which is why I would wait until we get above this breakdown candle. Also, price usually does not succeed on the first attempt. If price hangs out in this area after the first attempt, expect the market to plow through this level at some point.
Trade #2 (short): This trade setup waits until we break last week's low (with a retest) before going on to make lower prices. Last week I indicated a potential short trade but I labeled it as 'not preferred' because we were in an uptrend and the trend is your friend until its not. We are still in an uptrend technically (all the charts on the higher timeframes look healthy). However, if price starts to make a lower low from last week, we are probably heading for lower prices. So that's why I drew this trade in this week.
Note: I still think you need to be very careful shorting in an uptrend. Last week, we saw whiplash because there were numerous short opportunities erased by a reversal pump. That's what happens when you try to short in an uptrend. Prices bounce a lot easier or tend to want to continue to go up.
NEVER play the breakouts (they usually result in a retrace back to the breakout/breakdown area). Wait for the retest and resumption in the direction of your trade setup.
Good luck and please hit the like button.

XAU MSNFX RallyHolding $1835.80 Could Trigger Rally into $1860. Price Action through $1973.30 will change the overall trend long. The early price action suggests the direction of the February Comex gold market on Monday is likely to be determined by traders reacting to $1835.80.
Gold futures are inching higher on Monday after recovering earlier losses in a tight, mostly rangebound trade, as hopes of a U.S. fiscal stimulus package being passed this week offset downward pressure from optimism around COVID-19 vaccines roll-outs.

BAND/USDT - end of accumulation phase - 54% potential tradeHello, Traders!
I want to share a potential trade that I would be following.
BAND completes the accumulation phase, which has been going on for 83 days since September 16.
Buyers' liquidity is held between $6.38-7.38.
Dynamic price support is provided by the MA100 on the daily chart.
RSI moves into the bullish zone above 50
In order to secure the transaction entry it would be better to break it into two parts:
First entry 6.88 - 7.38 $
Second entry $ 7.48 -7.82 after price fixation above the level $ 7.38
SL under the level of $6.38
Targets at price levels
$8.16
$9.46
$11.50
Please leave your feedback below and watch out for the market!
P.S, This is not financial advice, but only a trade I would be following myself

S&P Analysis Week of 11/29/2020: Post Turkey WeekNow that a shortened Thanksgiving trading week is over, are markets ready to move?
As of this posting (with one more trading session in the Month), November has been a great month for bulls (10%+ returns) and even with a shortened week last week, the market still put in a nice 2.3% weekly gain.
In general, the S&P is very bullish. Look at the monthly, weekly, daily, 12 hour, 8 hour, etc. All the timeframes are technically very healthy. There is nothing wrong with any of these charts IMO.
The market has been 'creeping' up and always be weary of a 'creeping' market. After making new all time highs earlier in the month and being rejected, the market has been grinding back up consolidating to build energy.
When a professional robber wants to rob a store, they first hang out around the store. Is the market hanging out around an area they plan to breakthrough and rob? Or are they building energy to start a new leg down? Food for thought.
This week I've added three trade setups.
Trade Setup 1A: This is an aggressive entry but a valid entry. The reason it is aggressive is because all time highs is just above this area. However, I feel that price has been lingering in this area so long that any break above will most likely produce new all time highs.
Trade setup 1B: Less aggressive entry with less risk. Just wait for the break above all time highs (with retest). Simple and straight forward.
Trade setup 2: In case there is a breakdown during the week, this is a sell scenario. I did not place a sell scenario higher because of the bullish trend in the chart. The trend is your friend until it's not. Due to the weekly consolidation action, much of the space between trade setup 1 and 2 is No Man's Land (too much support too close to each other).
I use major support and resistance lines as my primary technical analysis. I avoid using other technical indicators or complicated chart patterns since they can give a lot of false signals. This has served me well by producing profitable entry and exit points.
Remember to NEVER play the breakouts (they are a losing man's trade) because they almost always result in a retrace to the last breakout/breakdown area. Wait for the retrace, retest and resumption off in the direction of your trade to take the entry. I like to use the 8 hour candle for trading and getting my entry signal.
"When it feels really right, it's probably wrong. And when it feels really wrong, it's probably right."
Good luck and thanks for viewing my chart. Please hit the like button to support my account.

Bitcoin is close to a decision point!Hello everyone,
Bitcoin has seen a fantastic rally over the last months. We've managed to reach all the way to the all-time highs.
There hasn't been any serious pullback yet.
I've found a bearish divergence on the daily timeframe in the RSi and a rising wedge pattern.
The target of the rising wedge is calculated by the height of the wedge, so around 16200.
If the rising wedge is to complete, we will see one more pump towards 20k and then a real pullback will start.
However, that being said, if bitcoin manages to clearly pump above 20200 and actually closes there, I think much higher prices are in play.
Thanks for reading my analysis,
Goodluck!

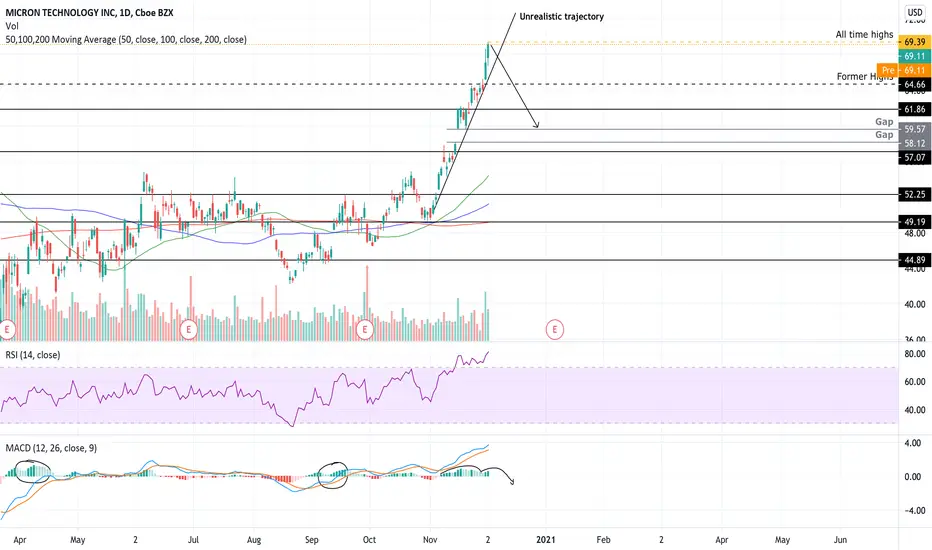
MU ShortAfter a golden cross with the 50 and 200 SMA NASDAQ:MU has pushed up into overbought conditions on the RSI leaving quite a mess as it stretches. Now at all time highs, I believe that it is a good time for a short. With lots of buying pressure in the last couple of days some consolidation is expected. Semi-conductors have been a strong play during 2020, however with a strong bid for Energy yesterday, I believe it is time for past due rotation for the continuation of the unprecedented bull market that has been carried heavily by tech centric stocks. The MAC-D is attempting to double extend to the upside for the first time since September and March lows, and with the overbought conditions it is safe to say that this move will likely be quickly rejected. My first target for MU is support at 61.68 and my second target is the gap up from 58.12 to 59.57. Note that the former highs are at 64.66 and this might serve as a testy area for MU.
S&P Analysis Week of 11/21/2020: Thanksgiving WeekHow will the shortened trading week affect the markets?
It's Thanksgiving week in the U.S. and that means markets will be closed on Thursday, a shortened trading session on Wednesday and usually a light volume day on Friday. The meat of the trading week will most likely come on Monday & Tuesday. Anything can happen though so just be ready for any volatility this week.
Last week did not have much action (a lot of sideways movement) so there wasn't much of trading for me.
Price did, however, form a triangle wedge pattern. These are unpredictable in my opinion so it is better to wait for price to breakout or breakdown (with retest confirmation).
I've marked the different trade setups I will be looking for going into the trading week.
REMEMBER TO NEVER PLAY THE BREAKOUTS. Wait for the confirmation.
"When it feels really right it's probably wrong and when it feels very wrong it's probably right."
Good luck, be careful and don't forget to hit the like button.
Background: I try to keep my charts as simple as possible with focus on the major resistance and support lines which has served me well. I don't not use any indicators (moving average, volume, oscillators, etc.) or complicated methodologies (i.e. Elliot Wave Theory) which can be difficult to predict price and provides false indicators.

BABA Breaking Through ResistanceIt appears based on the Kurutoga Cloud that Alibaba has broken through resistance. We can expect a bull run from here! Rally on :)

USDCAD - SellOff, Rally.. or both?FX:USDCAD
what will we see next with USDCAD?
If you click on my chart, hopefully you can see what I see; if not I'll guide you through it.
March 19th, 2020 - September 1st,2020 (the very start of the COVID-19 Pandemic) USDCAD's value went down an estimated 1650 pips. On September 8th, 2020 price broke out of a falling wedge pattern; therefore causing it to rally up until coming down and making its new higher low. Price began forming an uptrend once again after making this new higher low. If price startes to curve after hitting point C (1.348-1.345) we will see a sell until off past this higher low ( until around 1.295-1.3).

Bitcoin likely to retrace to last support (12500)Bitcoin is likely to retrace back to 12500. The RSi prints a bearish divergence on the daily timeframe.
14k is strong resistance.
The zone between 12000 and 12500 would be the best to start looking for longs again.
This analysis is invalidated if we can close a full daily candle above 14k.

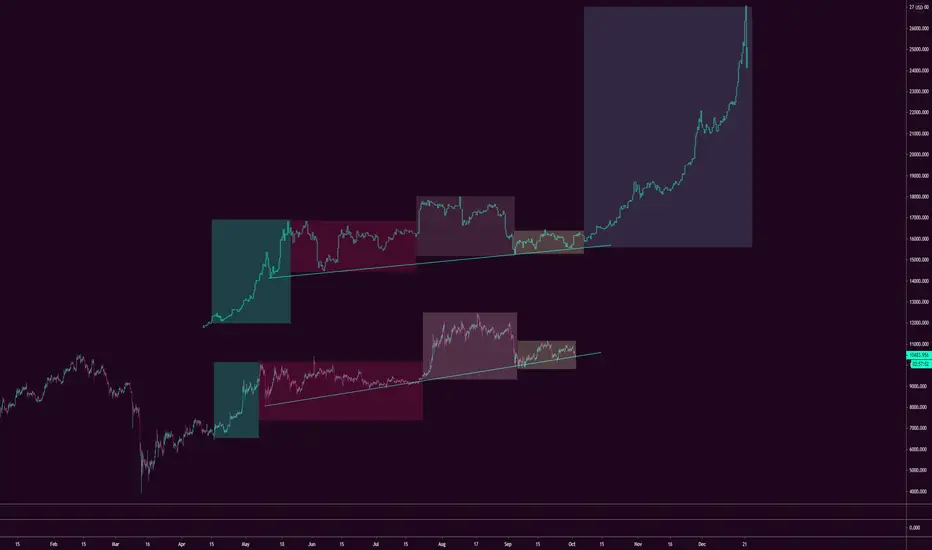
Macro Bull Flag in BTC Just Broke Out Huge Risk/RewardRecently I have discovered that assets have not just been in a very bullish trend, but that they are showing signs of being within a specific bullish trend formation. Specifically, bull flags. I'm pretty astonished to have confirmed that this is the case by applying the characteristic ABCDE pattern they display.
The implication of this cannot be understated, especially as I am seeing bull flags on lower time frames forming continuation patterns and beginning to break out right now.
Bitcoin is, as I write, completing a break out. The rally has begun to take off, and will steam ahead towards the all time high.
Additionally, many are feeling a lot of FUD and pessimism about current market conditions, but according to my analysis here. The market should have completed it's final E move down and is ready for sustained upside from here on out until the breakout. I believe this breakout will happen in a little over a week.
Whenever breakouts happen from a completed pattern, that is ALWAYS the point of maximum price velocity in the market, whether a crash or a rally.
So the implication here is that, because the above pattern is an 8 month extremely bullish pattern, that has just completed, and we have signs of bullish continuation flags starting to breakout, as soon as these new bull uptrends reach and exceed the previous highs, there will be a massive unprecedented upside rally.
This is most likely to be a once in a lifetime scenario or even less common. The upward price momentum should be shocking and unfortunately cause disorientation and the urge to FOMO buy.
This is the first risk with this scenario
The second risk here is that the comedown from this excessively overbought condition will be as big in scope as the comeup. One thing to keep in mind here is some simple sayings, "Easy come, Easy go", "The faster it rises, the faster it falls" These are general truths that will bear out their time tested wisdom once again in this extreme and unsustainable new bull market we are entering.
Finally I want to touch on the grand opportunity that this presents to people who see the signs and are able to act in advance. THIS IS NOT A TIME FOR FOMO! If anything, reaching asset prices somewhere of an indicator level of $4,500 on the S&P500 and $27,000 to $50,000 in BTC are likely good places to consider asset liquidations. This is a way to take advantage of a temporary premium value in assets.
There will be a rally, a top, and a correction to this quick and easy money. My plan is to buy now, liquidate around indicator levels aforementioned, and rebuy at the following indicator levels that a bottom may be in at: $2,700 in S&P500 and $7,500 in BTC. These are previous support levels and are the likely places prices will stop in the coming correction.
Please remember that when you see shocking price movements in the markets in the coming weeks, the highs will be unsustainable, and will come down in short order. Please do not FOMO in and protect your family as well. The risk here is great, but there is also reward for smart money. I am choosing to go all in now. I'm mostly in LINK but also have some BTC and at times will use ETH. I have leverage available for these and will use it to maximize my ROI on the way up. On the other side I along with the smart money presumably will all be holding cash, metals, and other safe havens, or actively shorting the markets back to equilibrium median value. But the equilibrium will not occur before sending the markets to lows not seen since the March crash and February of 2019.
People who buy out of euphoria and hysteria will be hard pressed not to give in to panic selling when their inflated purchases lose more than 40% of their value after just a few short months. This will devastate small retail and retirement accounts who don't know any better.
The patterns I see and the momentum as well is unmistakable to me, if you read this please keep this in mind when you see surprising things happening in the financial news soon. And take appropriate precautions. Also, remember that if you are surprised, you're too late. There are financial professionals projecting $4,500 (30%) gains in the stocks by EOY and I predict $27,000-$50,000 in BTC value at the top, but the lows that I predict should come in at previous lows in the market at $2,700 S&P500 and $7,500 in bitcoin, not as bad as the March crash, but you can see how if you FOMO into this rally, you will rapidly lose all your value and more causing the urge for panic selling. This is a recipe for big losses to uninformed people.
And finally there is always some news to go with the charts, and in this case there will be a narrative as well. Believe me: THIS BULL RALLY AND CRASH ARE ALREADY IN THE CHARTS. I can see it very clearly, and my fractal analysis shows that the crash will be a necessary part of this, not optional.
So please be smart with your money.
I am writing this on October 27th, 2020
I am open to any communications about his, thanks
Intratekram - Ben Ghrist - ghristb@gmail.com

Google - Can we expect a similar as of last quarter? On a daily time frame : GOOGL has moved slightly up from its support level which is positive sign, idicating that the stock is in uptrend. It may face little resistance at 1,625, if broken next level is 1,700. On Technical grounds RSI has moved upward and still there is room for RSI to go further up. PSAR - leading indicator has given a buy signal. As per Fib retracement support level is 1,447 and resistance lies at 1,625 (R1) and 1,720 (R2). Risk to reward ratio seems to be positive. A positive earning of 11.28 is expected which is slightly higher than its last quarter's expected earning of 10.13. This may act as stimilus to derive the share price upward before the earnings release date. After the last quarter's earnings were released there was a short rally which moved the price from 1,470 to 1,700 (approx). Can we witness the similar trend this time as well ?

Bitcoin will rally if it can break the 12k resistanceBitcoin is approaching the resistance of 12k. If it manages to break 12k I expect the breakout to be very aggressive, the minimum target will be 13.3k (next resistance) but can possibly extend further.
Long trade opportunities can be taken above 12k upon a break.

ETH ascending triangle suggests revisit of previous highsEthereum can move towards $480 if the resistance of $393 can be broken

OPTT AnalysisI see a bullish flag and if it breaks trendline resistance & picks up volume, we could see it rally again like it did not too long ago. Keeping my eye on it.

FACE MELTING BTC RALLY ABOUT TO START!? FRACTAL REPEATING ITSELFBTC Finished 4 parts of this fractal and is about to enter the 5th stage, which will be one to remember if traders behave in a similar manner. Considering the fear index (40), BTC is almost in a stage of extreme fear, and the price is above 10000. That means that people are afraid that the price will drop a lot lower.
9 / 10 times BTC does exactly the opposite of everyone's expectations.
*For total beginners:
FRACTALS are only a visual representation of a trader's psychology, which is repeating in a similar shape or pattern. This doe NOT means that the fractal MUST behave the same way. 5th stage doesn't need to happen at all.
The invalidation point will be the break of the teal trendline which is holding the price for now and making constant higher lows.
Big Gold Rally ResumeGold Breaks $1,400 Price Barrier and now what?
Gold price has been capped under $1400 since 2013. Last rally of gold is from 2001 when gold was at $252 when Gordon Brown sold the Bank of England’s holdings, since then gold rally all the way to $1900 fueled by behedging of gold miners. Since then the hedge book of miner is diminished if not empty.
These few years, the Central banks are gold buyer when compare to 2000-2011 when European Central banks are seller of gold.
There is a major game changer rules role out this year , the new Basel III rules are set to make gold a Tier 1 asset for commercial banks- compared to the Tier 3 ranking it holds currently. This means PHYSICAL gold will count as capital the same as a treasury bond. When gold is in Tier 3, only 50% of the value is recognized, but in Tier 1, 100% of the value is recognized. The value of gold is increase by 50% and the breaks of $1400 trigger a technical buy signal.
Will effective inflation pick up?
Gold has a industrial value, safe haven value and monetary value. It usually has a inverse relation with US dollar, means when USD is rallying, gold is diminishing and vice versa. It usually rallies in the same direction with USD when there is a financial crisis, gold is usually rally and so USD. Now market is expecting Federal Reserve will have rate cut this year, assume inflation didn’t changed, we have an effective inflation picking up and so the gold rally. But with the tariff imposed and de-globalization of supply chain means have price increase in supply size. These type of inflation is very difficult to be tackle with tightening of monetary policy, if the monetary polices becomes loose, it just fueled the inflation and gold will rally further.
In US a Philadelphia refinery was caught fire recently, it’s capacity refine 30% of the gasoline in US, means we might anticipate a high gas price in summer. The seeding of corn, wheat and soy beans were affected as the flooding of middle part of US are will light prompt a food inflation and especial the ASF in Asia in Autumn.
What happened if all central bank have negative interest rate?
Since 1970, Fed will cut interest rate 3%-6% whenever recession came, we are now with Fed fund rate at 2.5%, so if a 3% cut of rate, means Fed will enter negative zone which is already happened in Bank of Japan and European Central Bank. As we are know gold pay zero interest. But what if zero is higher that negative? We will have holding gold have higher interest pay than paper cash.
Looking for a series rally for gold in coming years. Good Luck everyone.


Kimberley Clark to the moon?Watch this stock as there could be massive gains. If it starts to go up, follow it up with a trailing stop loss. We could be seeing a formation of a bull flag pattern, so look out for confirmation with a break to the upside.


S&P 500 : The rally is not over yet.TVC:SPX
When RSI gives breakout signals before market/shares, I prefer to sell or buy. For example, on June 10, RSI broke the trend and gave a signal to sell.
Another example of Feb2020.
Market and RSI are still in channel. I think the market will soon surpass 3400 level.
Which stock do you want to analyze? Tell me in the comment box.
