Price projection for this XRP rally and future prospectsSo ripple started earlier than I expected in one of my previous ideas, however, it was to be expected that ripple would also pump.
We are in an insanely bullish crypto market right now and all major altcoins were already pumped, except for ripple and maybe ETH to some extent.
So now that the nasty resistance at 0.28-0.30 USD has been broken, we would like to know how high it can go?
I will base my projection on the fractal from march 2017. The structure is quite similar, so that it makes sense to compare it back to that time.
Bitcoin will do one final push in the coming days and weeks, and I think that all altcoins will top exactly at the same time as bitcoin. And as soon as bitcoin experiences
a sharp correction, say 27K to 13K, all alts will tank, ALL, without exception.
Make no mistake, all altcoins are depending largely on btc, and as soon as BTC goes down, all alts will follow. I am not saying that this is guaranteed, some super bullish news
could of course change that picture, for example amazon indeed implementing ripple, or stuff of a similar magnitude.
However, I like to play it safe, and don't very much like to rely on news, and hoping for some event to come true. Hope is always bad in crypto trading, hehe.
And what will happen in 2018?
Well, that again depends if the crypto market will continue to rise after the btc correction, or not. There is a very high likeligood that bitcoin will do another rally in 2018, the final one
before the bearmarket. It might go as high as 100K. In that case, we will see the bullish scenario for ripple.
If btc however will decline in 2018, the chance for a bullish ripple scenario are low (meaning 10% or below, we always have to think in probabilities: again as I said, some super bullish news
could change that picture).
So there we go. These are my thoughts on ripple in the near and mid-term.
Longerm I think ripple is here to stay, and will always be in the top altcoin range, together with ETH and LTC.
Rally

AUDUSD LONGAfter closing last week at our previous target around a strong resistance area, AUDUSD is expected to reverse into a bullish trend until Thursday.

Wife: I'm putting you in a house next year :) Go Bitcoin!Starting from yesterday, I've put everything I have in crypto: www.youtube.com
We have a cluster of fibonnaci levels of the last 3 major legs coming at 15K. Add this with all of the hype of crypto right now: news, bitcoin credit cards coming soon, bitcoin ETF coming in Decemeber!! Guys the hype might actually get the price to 15K soon!!
Starting from yesterday, I've put everything I have in crypto: www.youtube.com

Elliott wave Analysis: USDCAD Can be Headed for 1.2908Good evening traders!
We have seen a nice turn up on USDCAD following the BOC rate decision, so technicals once again turned out to be ahead of the news. We can see a sharp reaction to 1.2800, where is 161.8% extension target for wave three, so ideally that's a beginning of a new bullish leg, headed above 1.2908.
Disclosure: Please be informed that information we provide is NOT a trading recommendation or investment advice. All our work is for educational purposes only.

XRP - always good to buy when others panic sellSo a lot of coins are pumping right now. IOTA 15x increase in USD value since early november. And Ripple? Doing absolutely nothing. Sleeping. Dead.
So noobs are like: "Damn, look at all those shiny coins pumping, and ripple is dead. I have to sell ripple for these other cool coins!!!"
That's how whales play them, and what they basically do, is coin-chasing. Leaving a supposedly dead altcoin, for another one. And then another one.
And the next one.
If you wanna make profit in crypto, you have to be insanely patient. Buy coins that are supposedly dead, and will supposedly fall to zero.
Sell coins that are hyped and are pumping.
It is more difficult than it sounds bceause your emotions tell you that you are missing out on gains. But only the disciplined mind will be rewarded in crypto.
So what does this have to do with ripple?
Well, ripple is sleeping since May this year and is forming a huge bullish pennant. A classic example of an asset that is "sleeping" and preparing for the next move.
Many of the top alts, like ETH, ripple, LTC to some degree, have been sleeping. But they will start. And when they do, you will not believe your eyes.
When they will start is impossible to tell, however, I think sometime in the coming weeks. I expect the btc top in January, February at the latest. Normally
LTC and ripple spike together with BTC. So it is always good to put the gains you made with other coins into sleeping/dead coins.
And here, ripple seems super attractive to me at the moment. Risk/reward ratio is excellent.
However, this is only my opinion, and I do not guarantee that it will play out like this.

BTCUSD May See Resistance Around 12000BTCUSD is trading in a bullish impulse of a higher degree, labeled as black wave V. We see four of fives bullish waves completed from 11th of November, which indicate that a top can be near. Current rally that is now underway can be final wave 5 of V, that can see limited upside near the upper Elliott wave channel and near the Fibonacci ratios of 2.618 or 1.0 ; all three elements have a common thing, they offer resistance so be aware of a three-wave bearish reversal.
Disclosure: Please be informed that information we provide is NOT a trading recommendation or investment advice. All our work is for educational purposes only.

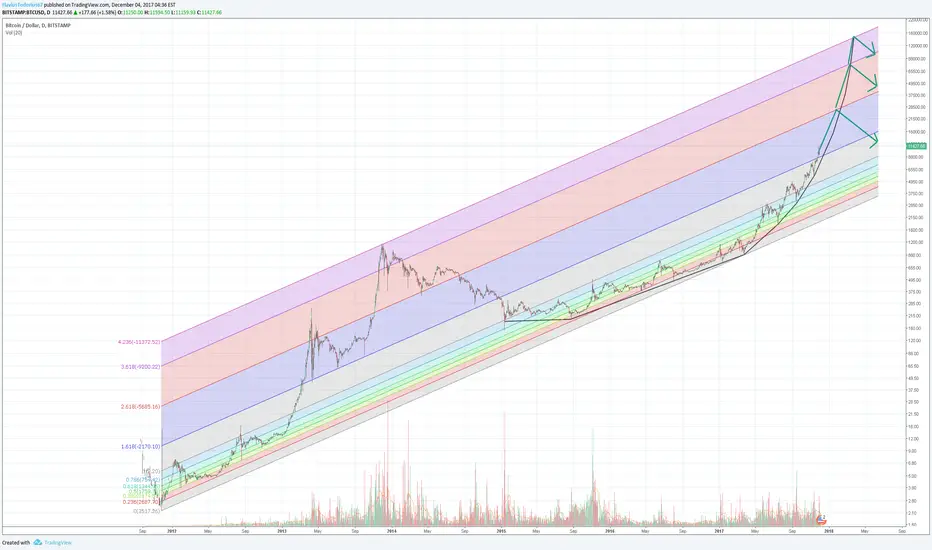
How high can this thing go? Hint: Very high.It's funny to see the reaction of people, staring in total disbelief at the prices. Why?
Because they do not think in exponential terms. The human brain is just used to think in linear terms, exponential rises take a lot getting used to.
But bitcoin? It was rising exponentially for a while, and now it entered over-exponential territory.
This means that in the logarithmic chart we don't have a line any more, but a parabola.
That is why the time for a doubling of the price will get shorter and shorter.
I drew the logarithmic trend channel and these are the possible reversal zones:
1.st at around 25K
2nd at around 75K
3rd at around 145K
If the full move is done, we could see, and I now it sounds insane, 145K until the end of march 2018.
I think 25K is the most realistic scenario, with about 60% probability. Timeframe: December-January
75K with 30% (timeframe: end of february), and 145K with 10%. It's just an estimate, but it's good to know these important resistance lines.
JCP New 1 Year Price Target:4.95 Arbitrage advance level has finally crossed the 0 line which means our Arbitrage Band is finally pointing up
Arbitrage Tick has signaled we had a new higher high within the last 2 days
And the Arbitrage Band has signaled a green flag letting us know it's time to enter the trade.
3 standard deviations from our mean puts JCP at 4.95 within the year.

DXY: Dollar Index - Small counter-rally before further weaknessDXY Dollar Index Small counter-rally before further weakness
DXY has crashed into the near term target zone at 92.74 -
92.55 (target 92.64) and bounced. It looks like it will
consolidate by moving sideways to upwards, at best to test
the upper parallel before it falls away again. When 92.50
gives way it should fall a further 1.5% to 91.01. This move,
when we see it will propel gold and oil considerably higher still.


Elliott Wave Analysis: EURUSD Breaking Higher, Approaching 1.2EURUSD has turned up in the last two weeks; it broke above the channel resistance line that normally confirms a previously completed move; in our case that was finished a-b-c decline from September high. As such, it seems that wave four on a daily time frame came to an end about we talked a lot in the past which means that more gains may follow now within higher degree wave five, currently within subwave three that might have started from 1.1712 now underway to 1.2.
Disclosure: Please be informed that information we provide is NOT a trading recommendation or investment advice. All our work is for educational purposes only.

ParkByte could rally again. Tonight!All important things are on the graph, I see a nice cup and handle forming. Breakout looks to be imminent.
ENTRY: $1.13 - $1.12
EXIT $1.30-Upwards
STOP LOSS $1.11-$1.10. 2 Cents beneath whatever you brought in at.
Anyone who followed my POWR trade yesterday, wowee!

GE: Next buy points for counter-rallyGE Next Buy Points
We never got a chance for a long down by the lows, but we
did get the next one: the break above the small parallels
channelling the tiny corrective move yesterday and Monday.
It was a really good, painless/stress-free break too. So now,
after GE filled a small gap (left on chart) it's coming back to
support at 18.07 (tweaked by a couple of pips) and should
hold up there and bounce again (low risk entry point with
stops below 18.00 . If so, The next challenge should be at
18.46 (take profits) - we know that each of the last three
pathetic rally attempts have all been 100 pips...which is
exactly where 18.46 lies...then we only go long again once
we can see 18.50 has been broken on upside, looking for
19.36 where look to close (just under here) and some may
then wish to short with stops above. More as this develops.
Better than Bitcoin today too! Old V new. Today the old won.
There are some good trades here, between the lines - and so
much less stressful than Bitcoin. For a quiet, steady calm
trade GE wins hands down, no contest. Depends on your
profile.

EURUSD Breaking Higher With ForceGood day traders! Hope everybody is doing great. Let's dig in.
On the intra-day chart of EURUSD, we see price unfolding a strong bullish movement, which suggest an impulse to be in progress. We can see waves 1 and 2 completed, so current strong rally can be wave 3, that may see limited upside near the Fibonacci ratio of 61.8. That said, once wave 3 unfolds a new temporary pullback into wave 4 can follow.
Disclosure: Please be informed that information we provide is NOT a trading recommendation or investment advice. All our work is for educational purposes only.

Okcash Huge PotentialAs we can see in the blue highlighted area's Okcash has already bottemed out and is ready to start a new rally. Highlighted in yellow we can see a fake breakout caused by rumours about Palm Beach Research Group endorsing Okcash. The volume during this fake breakout shows that this market is ready to make some big moves again just like in early september. Okcash is a coin that has seen an amazing uptrend past year and it does not look like it is going to stop now, all indicators confirm that Okcash is ready to resume this long term uptrend. Alongside all these technical reasons we also have some fundamental reasons to believe Okcash might be in for a nice increase in price, one of these reasons is Okcash's upcoming 3 year anniversary on November 24th, I can imagine they have great plans for this important date. For more information about this check out this article from one of Okcash's developers: medium.com
Cryptocurrency marketing team Golden Smophy ( The company that was responsible for the rally to 20K sats past september ) has also announced to resume their work on Okcash. Link to their site: goldensmophy.com
To add some fuel to the fire there have also been rumours about Okcash getting listed on poloniex, if these rumours turn out to be true we could see a bull run past it's previous all time high at 20K sats.
Now is the time to fill our Okcash bags, thank me later ;)

Will EURUSD Break Lower or Continue Higher?Daily chart of EURUSD shows us a five-wave bullish impulse in the making. Current three-wave decline can be corrective wave 4, with temporary support coming in at Fibonacci ratio of 38.2 and the upper channel base line. If price breaks below this region, then our alternate, bearish count would be in play and we would expect more weakness.
Disclosure: Please be informed that information we provide is NOT a trading recommendation or investment advice. All our work is for educational purposes only.

GBPAUD LONGPrice expect to break through reversal zone after retracing back to Buy Point 1. Buy Point 2 acts as a safety following a strong trend line we can trust.

LTC to 70s and Beyond?Red circles show that the flags are nearly identical in shape. Before LTC rally to 69.8 we saw the same flag. We are sitting on the next ride up to complete the second smaller flag and then the smallest flag a total of three flags. That is what it looks like. If Bully BTC doesn't get in the way, here is the likely path.
This trade will be valid if the trend continues. Close trade if LTC goes lower than 62.
TARGET 1: 70-72
TARGET 2: 77-80
Retrace to upper 60s
Happy Trading LTC fans.

DXY: Dollar bulls building pin bars ahead of next rallyDXY: Dollar Index
DXY is up and down like Harvey Weinstein's pants.
But those series of pin bars forming over the course of this
week shows serious support for the dollar at 94.41.
This whipsaw can persist a little longer and cause havoc with
positions (as in Gold, and across the pairs) and it's why it
helps to keep an eye on this chart if trading any pair against USD.
DXY continues to unwind the overbought conditions of last
week by moving sideways between 94.82 short term
resistance and 94.41 short term support...but those pin bars
are showing that ulimately the break will be to the upside.
Intend to keep accumulating Dollar longs on each test of
94.41 and increase once 94.90 has been broken on next
minor pull-back towards 94.80.

DXY: Get ready for a strong Dollar rally Tuesday from 94DXY: Looks like DXY should come back down to 94.28 at least and to 94 at most on Tuesday (well it could spike a few pips lower to test the lower parallel at lowest) before it and all Dollar pairs bottom out and start what should become a very powerful bounce...so get ready to start to building Dollar long positions across all Dollar pairs Tuesday as close to 94 on DXY as possible. Stops just below the lower parallel. Good trading

Potential Rally After BTG ForkAs the BTG fork approaches my current analysis indicates a potential bull rally after the fork. Currently we are in the 5th impulse wave from the 10/18 beginning impulse phase. Currently the price has hit a support, the point of control of the current volume profile and RSI is oversold. All of which indicate a potential pivot for the last leg in the impulse phase.

ETH Ascending Wedge quick rally before resuming correctionLooks like a quickly rally following the bearish Adam and Eve formation, expecting to hit 320-330 before resuming correction toward support at ~285
www.tradingview.com
