IS THE RALLY FINALLY OVER?SPY
We had two scenarios yesterday during our stream
1.) Preferred scenario would be for the spy to pullback down to 400-398 or trendline and hold for the rally to continue to the upside. So a pullback or consolidation around this level is healthy. Just remember its December, I always look forward to the Santa Rally if you've been in the market more than a year or two you know what that means.
2.) If SPY Pulls back and breaks this trendline and strong support, FEAR / FOMO / SQUIZZLE can happen and the bear market continues.
We don't know exactly whats gonna happen in the market but we just ride the wave and make mullah along the way 🙂
Have a blessed weekend ahead and trade smarter!
Rally

Bulls Breakout .. BUY DOGEUSDEveryone know this and we are already bottom for Doge.
If it decide to go further down then everything will be gone then will take months or years to recover.. don’t end up like Luna.
Anyways this is a good news we are still uptrend and breakout bullish confirmation; Elon musk is doing him you know the twitter going on and still will support Shiba and doge.
Also this is a 1$ rally but this won’t be easy , cuz will face unexpected resistance but will continue its bullish momentum to keep going upwards.
Trade safe y’all and good luck

Final bear market rally for 2022, SPX to 4300 by year end?Seeing some matching patterns here to put this together.
Up:
1) Going higher than 200 DMA will give bulls hope
2) 50% retrace from bottom lets people think we have finished this bear market
3) Now 80% odds for 50bps
4) Roughly 60 days would be in line + 20% return
5) Favoured seasonality for a Christmas rally
Then down:
6) Everyone forgot about the Strategic Petroleum Reserve (now lowest since 1984!), energy issues in Europe (Russia will mess with gas again)
7) 50bps I think is unlikely so we will see 75bps. FOMC is Dec 13-14, so I will target there
8) We're still in a bear market and volume will top out for another downward move
9) Cramer + Tom Lee will call for 5100 at the top
---
Related:
- Bear market investment strategies book: amzn.to
- 20%+ rally would be in line with the past:
www.fidelity.com
- Bear market rallies: www.forbes.com
- Strategic Petroleum reserves: www.eia.gov
- Energy in Europe: graphics.reuters.com
---
Daily returns
Plan for 2020-2030

WIG20, Daily, 1-Hour H&S and Weekly Bearish CandleThere was a big rally on the WSE recently - 16 green Heikin Ashi candles in a row. Now it's time for a continuation of the downtrend or, less likely, a correction in the new bullish trend.
Why? There is:
- an important supply-resistance level
- a supply zone
- 1-hour confirmation - Head and Shoulders formation
- weekly confirmation - an ending bearish candle
and USDPLN entered the weekly support zone.
Rather, the price will fall from these price levels otherwise, there is a chance that the upper zone will be tested.
The first target: the lower zone.
The second target: 2020 low.
See also related ideas.

GOLD Weekly forecastGold now in observable motion for upward rally in cope with EUR pairs. After presidential remarks In Europe has Inverted many pairs for a good cause especially EURO pairs.This week mostly Stocks went into a rally shortly after CPI news hit following the rapid move for EURO pairs, GOLD and vice versa as dollar falls in a strong dive as planned by the feds. Technically, Gold has found strong support around 1620-1630. however, there are many barrels on the way up as it approaches major supply levels.
Now we wait and see if major news and economic news could be benefitting in coping the price movements in further months or not. That includes Decisions by the new government in UK and Chaos close chats of Ukraine and Russia Conflict and as well as Economic reports of the Feds-Including NFPs, CPIs, and Inflation data.

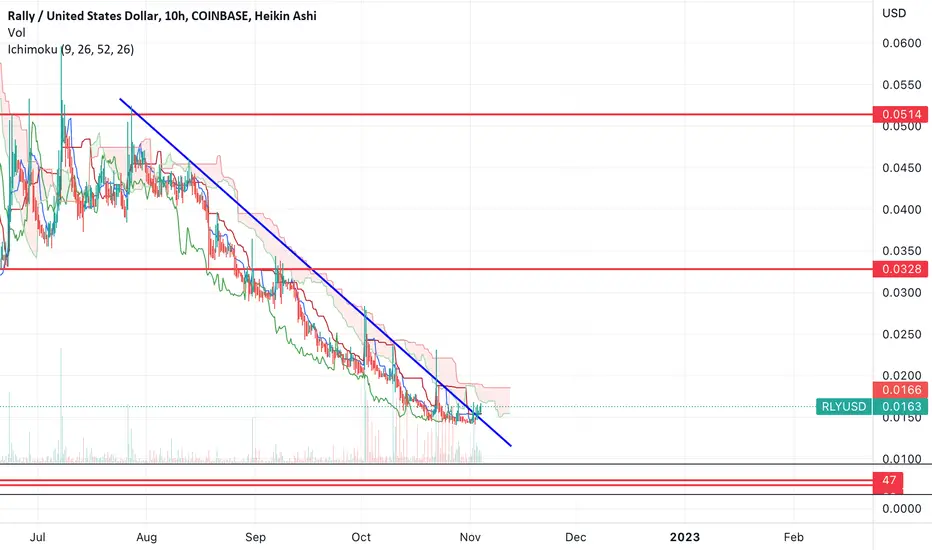
Is it finally time for $RLY to rally? Next stop $.03, then $.05?$RLY looks like it's finally time to move.
As you can see from the chart, $RLYUSD finally broke out of it's downward trendline and looks poised to move higher. Once rally breaks $.02, I see a quick move to $.03 and if we can hold above the $.03 resistance, then I see continuation to $.05 where I think the end of this move would take place.
A chance at 3x upside from the current levels if it plays out.
Good luck.
S&P 500 RECESSION ANALYSIS!EARLIER, i had posted saying if the us markets goes further down what will be there point. (check the link section)
lets go on further,
recession means what earned everything lost, reached its breakeven point. what profit gained has gone away, with net having no loss and no profit.
FIBONACCI ANALYSIS: Fibonacci describes this statement in a very beautiful manner. if the price is trading at the 0.5 level then it is has reached its recession point.
although do note that 0.5 level is also a deciding level. okay, i will come to this later.
lets talk about this idea that why is the US started recovering.
interest rates had started coming down, and the indices are reacting very positively towards it.
i have explained to Fibonacci that now the recession has been completed according to this indicator.
MOVING AVERAGES(50 AND 100): both the moving averages(50 and 100), are meeting at one point, and they will now repel and move upwards.
RSI: yet it needs to give a breakout, but is definitely showing divergence(the two purple lines), relating to price action
TREND LINES: THE BLUE TREND LINE: yet needs to be breached, and yes this is the move that will make the break of it.
many of the great tech stocks have massively come down, and now they are showing divergence and a good upside move is gonna come.
FINAL WORDS: US markets will have a boom in their upside movement, as many of them kept on selling their positions, and such the interest rates have started coming down and will become normal within 1-2 years, so from now onwards the next year will be a great run for the US markets.
i will come to my point which i earlier which i had left in the middle, in my previous s&p analysis(link below), i had mentioned if s&p goes further down then recession stage, then at what point will it go down, and what will be the levels furtheron.
but since interest rates have started coming down, and mostly all the other economical news has been factored, i say that now there is a great space that us markets can have there bull run, and they will have, because its so clear that markets are tend to go upside, and they are the ones who react at first.
thank you.

$RLY taking a long here at the lows for chance at large upside$RLY went a lot lower than most people thought was possible (including myself). I've been waiting patiently and watching for some indications that this could be bottoming and it looks like we finally just got some signals.
The big signal that stands out to me is the 2D buy volume being the highest on the chart right at the bottom. That gave me the confidence to take an entry here at $.021.
If this starts moving higher, I think we could see a pretty strong bear market rally to retest resistance at $.30 and potentially even $.45 (the 50% retracement from the highs). The R/R is really good here 1300-2000% upside w/ minimal risk. Taking a small position w/ a shot at big returns.

$DXY continuation of trend ? 👁🗨*This is not financial advice, so trade at your own risks*
*My team digs deep and finds stocks that are expected to perform well based off multiple confluences*
*Experienced traders understand the uphill battle in timing the market, so instead my team focuses mainly on risk management*
!! This chart analysis is for reference purposes only !!
If you want to see more, please like and follow us @SimplyShowMeTheMoney

NZDCAD26 OCT
*NZDCAD
Price has break the resistance of 0.78684 and on 4 H timeframe it is also on 200 EMA support.
So two cases are
- CASE 1 , one is direct hit to the two levels(LEVEL 1 AND LEVEL 2).
- CASE 2 , other is RETEST to the fresh SUPPORT and then continue the RALLY.
STOP LOSS - 0.78390
R:R - 1:08 OR 1:2.5
NOTE - PROBABILITY IS HIGH ON CASE 2 LEVEL OF WINING BUT WE CAN TRY BITH CASES.

Beware, the red ring of death is upon usBehold, another red ring of death is upon us.
For most it's the bringer of pain and destruction.
For few, a guiding angel to incredible buy spots, bringing wealth beyond thy beliefs.

🚨🚨🚀$LUNC #LunaClassic Just Might Actually Make Its Comeback!KUCOIN:LUNCUSDT
$LUNC has obviously been highly speculated on, by "gamblers" and "degens" in the crypto space. I, myself, have even DCA'd very small amounts into it over the past month. While this is, of course, is very possibly a short lived pump, $LUNC has actually made its higher high, above the previous swing-high. RSI's are also showing a strong rise in demand, which may be overheated. But with the higher high in place I do believe it is now safe to speculate (As long as the momentum isn't quickly lost, with a break of the current support-trend) that there may be some real relief in store for $LUNC holders, and ( possibly ) major profits for anyone who has been buying recently.
IMO, if $LUNC can hold these price levels and momentum, then push above the second strong-resistance level (Around $0.00014) and hold that area as support, there could be a very strong rally coming here.
##*This is all my opinion, based on chart data. This is NOT financial advice.*

CEO Appointment of former Lake Resources boss Stephen Promnitz.~180% surge on CEO appointment of former LKE boss Stephen Promnitz. Absolutely insane. The start of something incredible in the lithium-rich home of the Gascoyne/Pilbara region of Western Australia. Announcement made to the market at 9:24am AEST on the 28th of Septmember 2022.
ASX:QXR

Dark Cloud Cover? Hello 3700. We've been hanging out in this area for about a month now it feels like. And based on what I said yesterday, looks like the market needs more time to decide which way to go. So let's think about some things. We are technically still in a bear market and this also has the feel of a bear rally. Why? The day the CPI report came out, we gapped lower and it looked like things were going to fall apart. But obviously we didn't. We got a huge bullish reversal candle. There were just no more sellers and it seemed they were all exhausted from the last few weeks of selling. So of course the buyers are gonna step in. But what happened the next day, did not convince me. The candle on the 14th was a "Dark Cloud Cover". We gapped up and had to come down to at least half way or more of the previous day candle. Which is also a signal to the down side. but we've continued higher. I've also noticed that the volume since the 13th has come down more each day. Another sign of a bear rally. 3800 is not out of the question because it can still make it's way up there and be a bear rally.
So here we are flirting with the 20 day, waiting for the signal to advance for the next move. In all honesty, I don't think the 20 day wants nothing to do with us and we head lower. Next week we should have some action in the markets from all the big tech earnings. I jumped on a couple banks earnings calls last week and many are not painting a pretty economical outlook. IF, we get some reaction from earnings next week and the VIX makes it's way to 40-50 following all the earnings, we can get to 3400, 3200 worse case 2900? I'd say somewhere around the mid term elections we will reverse and head higher. Get our Santa Clause rally in December and end somewhere around 3600 for the end of the year. And who knows, we can move higher from here. Doesn't matter. Be patient. Trade the market in front of you, risk manage and position size accordingly. Happy trading!

S&P - Where to nextPossible price action from the recent rally can end within the pitchfork due to the 50sma resistance level (green line in the middle)
If that breaks and holds S&P could make a possible move to the up side to test the 200ema bringing it up to the 3865 price mark where it will need the bulls to bring everything they have to the party to breakout of the downward trend and keep the rally going.
If the S&P500 can't hold at the 200ema it may be quick reversal to the downside and most likely to retest the recent low

XRP Bull Flag 35% MoveXRP showing a very nice Bull Flag on the Daily Timeframe.
Upside Potential. Chance to Rally.

Bounce then more chop $SPXSPX seems like a decent area to buy some into end of year holidays.
Obviously market could continue to nuke with some sort of event.
NO idea after end of year

NIVIDIA - Long Trade Setup - Near Key Support, Watch For BounceHello Traders, here is a long trade idea for NIVIDIA.
The market is oversold and overdue for a bounce. Yes, there is the potential that price heads lower but with the DXY approaching resistance there is a strong probability that we will see a bounce in the market this week.
NIVIDIA is approaching a key support level at $119, this is an excellent entry for a long trade.
Take profit #1 is at $130
TP #2: $143
For a stop loss: Personally I typically average down in trades like this so please use whatever risk management strategies that you typically use that suits you.
After we bounce there will likely be a rather large sell off so make sure that you don't get trapped in the trade.
Thanks everyone and best of luck trading!

gbp/usd possible continue downonce price increase from 1.0817 to 1.09144( 0.90%) then i would wait on a retracement to
the red zone but the can should close inside that zone. after that i want to see some selling pressure
with a red candle close below my 1.06 zone the i would take my entry at the close of that candle.

Current SPY low is < 1% from the June 2022 lows - Double Bottom?My cycle patterns suggest a rally phase is likely over the next 7+ trading days - but, the trend is very bearish today. It is almost as if the markets are flushing out stop levels - actively seeking a support level near the June 2022 lows.
It will be very interesting to see how the market ends today. If we see a big recovery rally into the close, it may support my cycle patterns predictions of a rally phase leading to what may be a new support level near $365. If it continues to sell downward, then I will be forced to admit my cycle patterns FAILED today. That means I'll have to spend hours studying why this failed and if I can make any improvements to my cycle pattern qualifiers/code.
I will state that my predictive modeling suggests a rally phase is still likely. So, we'll see what happens as the day progresses.
Follow my research.

Big Cycle Pattern Day - Momentum Rally DayThat means the SPY should find immediate support (after it appears a big GAP downward reflecting Europe's recession concerns).
Here's a little hint: Bitcoin will likely rally along with the SPY/ES and others over the next 7+ days.
The strength of the US economy/US Dollar may drive global investors into US assets and safe-havens throughout the end of 2022 - possibly setting up a very strong Christmas Rally phase.
Remember, this was all predicted over 3 years ago by a major cycle event. I have every day mapped out all the way past 2026 and beyond.
Next week should be very exciting. The potential for the markets to rally higher is high. There is a CRUSH day (9-28) that may represent some type of corrective price event, but other than that one day, the momentum appears to be to the upside.
Hope you guys are enjoying these? Please comment or let me know if you find these valuable in any way/form?
Follow my research...

USDJPY made CUP and HANDLE pattern Wait for handle breakout and enjoy the ride down
Not advice, trade safe
Cycle Pattern - Tomorrows Momentum Rally PatternIs it really that hard to believe that tomorrow could shift gears and move into a moderate momentum rally after the Fed raised rates 75bp?
What I find incredibly interesting about these patterns is how they can paint a very clear picture of the opportunities and shifting market trends.
Each day is clearly defined (except for the N/A days). Each day paints a picture of what to expect and potential trend.
Reading all this data as a story or narrative provides us a very innovative way to address allocation levels, risks/opportunities and trends.
Given the market volatility and trending, I would still suggest addressing any potential momentum rally with some caution. Trade smaller amounts and look to pull away from position before the close of trading on Friday.
Follow my research.
