GBPAUD - Trading The Range - AGAIN!Hello TradingView Family / Fellow Traders. This is Richard, also known as theSignalyst.
📈GBPAUD has been hovering within a big range.
Last week, as per our previous analysis, GBPAUD rejected the upper bound of the range and traded lower.
This week, GA is retesting the lower bound of the range acting as a support.
As long as the support holds, we will be looking for longs on lower timeframes, targeting the upper bound of the range.
📚 Always follow your trading plan regarding entry, risk management, and trade management.
Good luck!
All Strategies Are Good; If Managed Properly!
~Rich
Disclosure: I am part of Trade Nation's Influencer program and receive a monthly fee for using their TradingView charts in my analysis.
Range

ETH — Perfect Long Play: Pullback & 1W Breaker Reclaim
After the strong move, price is likely to retrace as longs get trapped and late buyers take profit.
Best scenario: ETH pulls back to the 1W breaker zone ($3,141–$3,456), which previously acted as resistance and could now flip into support.
Watch for bullish reaction and confirmation in the 1W breaker zone.
If support holds, enter long — targeting a return to the range high and then the liquidity zone ($4,108+).
Invalidation if ETH closes below the 1W breaker or loses range low ($2,876) support.
ETH has rallied hard. After such a move, it’s normal for price to pull back and test old resistance as new support. The ideal long is on confirmation of a bounce from the 1W breaker zone, which keeps risk controlled and sets up for a continuation move higher. This approach avoids FOMO and protects against reversal if the breakout fails.

BTC Dominance — Bounces, Chop, and Next Wave Setup
BTC.D reached strong support, confirming euphoria top for now.
Currently, BTC.D is at the first key support (green zone 59.8–61.1%). This is a logical bounce zone where dominance could chop or rebound short-term.
If BTC.D holds and bounces here, expect more range-bound action, potentially retesting 64–65% (red zone).
If this support breaks, the next area of interest is the 54–55% green box. This would open the door for more sustained altcoin strength (altseason continuation).
Ultimately, a decisive break below both green boxes signals the start of a major altcoin expansion phase, with BTC.D trending lower toward 48–50% support.
BTC Dominance (BTC.D) is at a critical inflection point after rejecting at strong resistance and reaching daily support. Bounces from this area are typical as traders rotate profits, but sustained breakdown below support would mark a shift in market regime, favoring alts. Watching for confirmation — the next parabolic move in alts begins if BTC.D loses these green boxes.

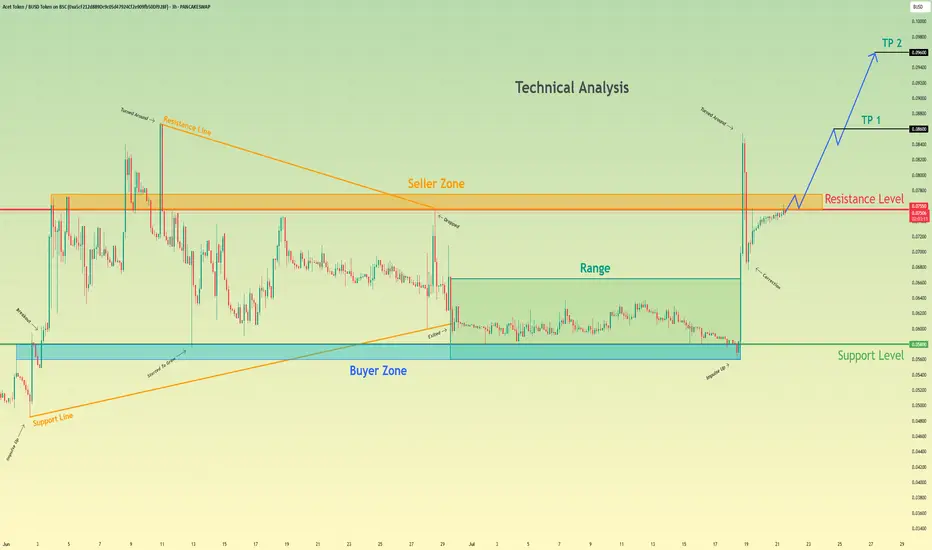
Acet Token will break resistance level and continue to move upHello traders, I want share with you my opinion about Acet Token. Looking at the recent price action, we can see a clear narrative unfolding. The asset initially formed a large wedge pattern, experiencing a trend reversal that led to a breakdown and a period of prolonged consolidation within a defined range between the buyer zone around 0.0580 and the upper boundary. Recently, however, the market showed a strong impulse, breaking out of this range and decisively moving upwards. Currently, the price of act is testing the key resistance level at 0.0755, an area historically defined as a seller zone. The hypothesis is that after this powerful impulse, the asset will manage to break and hold above this resistance. A successful retest of the 0.0755 level would likely signal a continuation of the uptrend, paving the way towards our specified take-profit targets. The first goal is set at TP 1 at 0.0860, with a further extension to TP 2 at 0.0960, capitalizing on the anticipated bullish momentum. Please share this idea with your friends and click Boost 🚀
APTOS Weekly Bottom Formation — Early Signs of Reversal
APT has retested and held the long-term weekly support zone (green box) multiple times, confirming strong demand and buyer defense.
Current price action is pushing off the support with a series of higher lows, suggesting the start of a new bullish cycle.
Scenario A (Bullish):
— If APT holds above $5.40 and weekly closes stay above this green zone, expect gradual momentum toward the $15–$19 resistance (red box).
— First target is $15.30, with extension to $19.50 if trend accelerates.
Scenario B (Invalidation/Bearish):
— If price fails to hold $5.40 and breaks back below $3.40, setup is invalidated. In this case, expect retest of lower support at $3.00 or lower.
Aptos is showing a classic bottoming structure on the weekly timeframe, with clear accumulation at major support. Sellers have repeatedly failed to break the lows, while buyers step in on every dip. This increases the probability of a mid-term reversal toward the upper resistance band. Weekly structure remains bullish above support; only a major breakdown below $3.40 would invalidate the scenario.

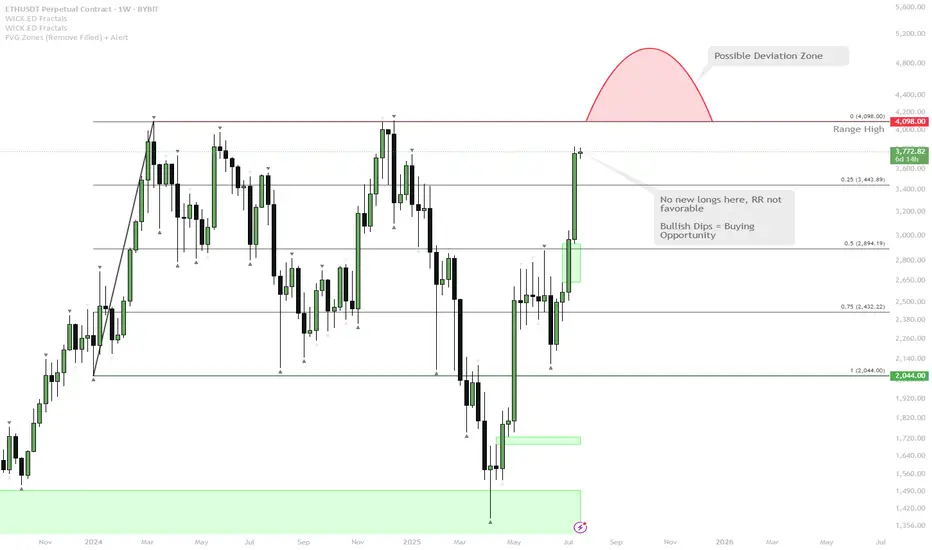
ETH Approaching Major Resistance — Watch for Range High Deviatio
ETH has rallied strongly and is now testing the range highs around $4,100.
The most likely scenario is a direct tap or wick above the range highs — this is a classic spot where the majority expects continuation, but also where deviations (fakeouts) frequently occur.
If price closes above and holds, it could trigger further upside. However, the risk/reward (RR) for fresh longs here is not attractive after such an extended move.
A deviation above range high (quick push above, then close back inside) is possible and would be a bearish signal in the short term.
After this wave, any deep dips in ETH will likely be a high-conviction buy, given the strong bullish momentum.
ETH is showing extremely bullish momentum as it approaches a major weekly resistance at the range high. The obvious play here is a sweep or break of this level, but with the move being so extended, a deviation or fakeout becomes increasingly likely. While momentum is still up, waiting for a dip or failed breakout (deviation) is a better risk/reward play than chasing longs here. Any meaningful pullback will likely present an excellent buying opportunity given the macro strength.
GBPJPY - Trading The Range!Hello TradingView Family / Fellow Traders. This is Richard, also known as theSignalyst.
📈GBPJPY has been hovering within a big range.
This week, GBPJPY is retesting the upper bound of the range and $200 round number.
As long as the resistance holds, we will be looking for shorts on lower timeframes, targeting the lower bound of the range.
📚 Always follow your trading plan regarding entry, risk management, and trade management.
Good luck!
All Strategies Are Good; If Managed Properly!
~Rich
Disclosure: I am part of Trade Nation's Influencer program and receive a monthly fee for using their TradingView charts in my analysis.

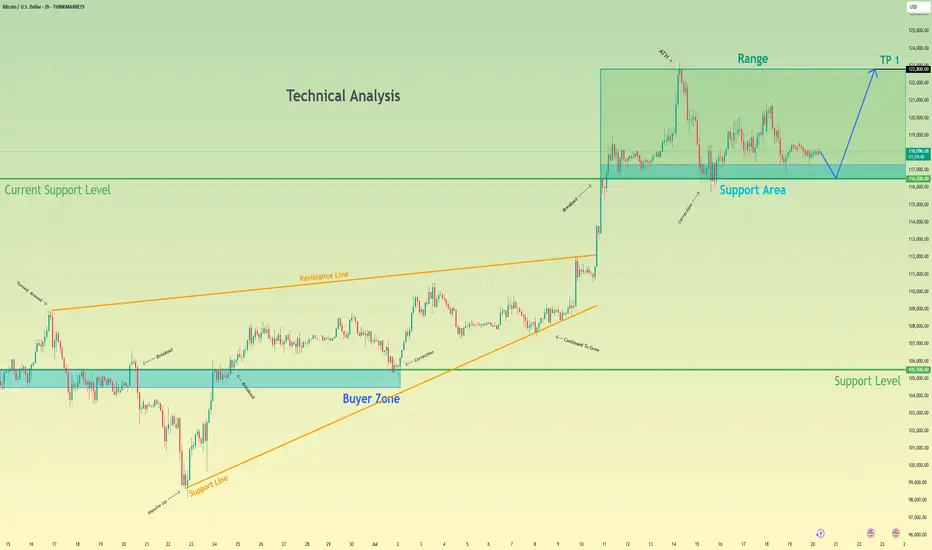
Bitcoin may bounce up from support area to 122800 pointsHello traders, I want share with you my opinion about Bitcoin. Analyzing the broader market context on the BTC chart, the past price action has carved out two significant technical structures: a wide trading range and a larger upward wedge pattern. The formation of this wedge indicates a generally positive market sentiment, though the narrowing price swings suggest a decrease in upward momentum. The foundation of the current structure was established around the buyer zone of 105500 - 104500, a level that has historically proven to be a robust floor. This historical behavior provides a critical reference for our hypothesis. Currently, we are observing bitcoin's price action closely, interacting with the current support area, located between 116500 and 117300. The character of the movement here is largely corrective and consolidative, pointing to a state of temporary equilibrium. This consolidation near the lower boundary of the wedge is a pivotal point. My thinking is that a final, brief dip to thoroughly test the 116500 - 117300 support area is a high-probability scenario. Such a move would effectively absorb remaining sell-side liquidity before a reversal. We can then anticipate an impulsive move upwards across the range. Therefore, the logical take-profit for this long position is set at 122800 points, as this level marks the upper resistance of the range and a natural target. Please share this idea with your friends and click Boost 🚀
Disclaimer: As part of ThinkMarkets’ Influencer Program, I am sponsored to share and publish their charts in my analysis.
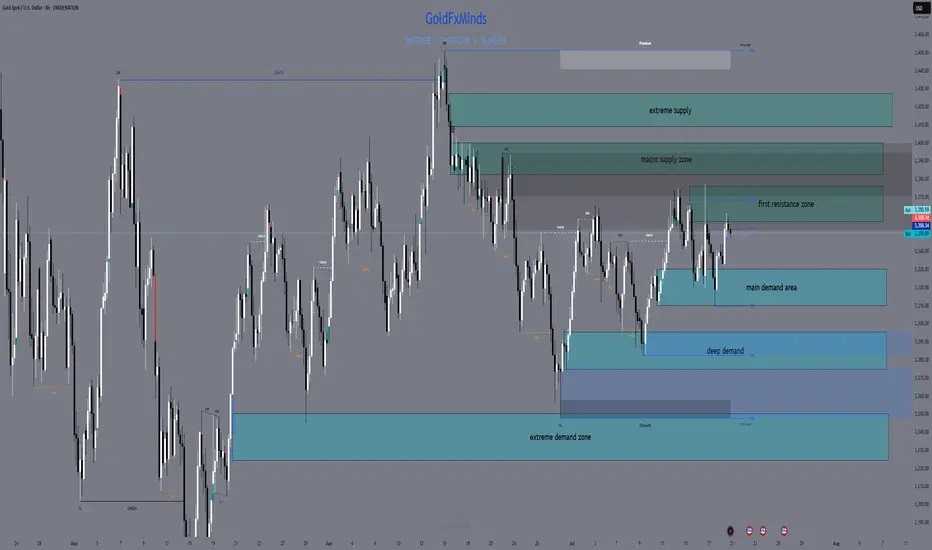
XAUUSD H4 Outlook – Full Structure & Macro | July 21, 2025Hello, GoldMinds! 💙
After a volatile week, gold remains caught in a wide H4 range, ping-ponging between structural supply and demand. Let’s break down the current picture so you can navigate the next big moves with confidence.
🌍 Macro & Bias
Macro context:
Last week’s US CPI print triggered a temporary rally, but gold failed to hold above resistance and quickly reversed as the dollar strengthened. Next week brings Fed Chair Powell’s testimony, global PMI numbers, and jobless claims—all catalysts for new volatility.
Bias:
Neutral on H4:
Gold is consolidating inside a broad sideways range.
The market is waiting for a catalyst to break above 3375 or below 3310 before showing a real trend.
🔸 Structural Key Supply Zones (Above Price)
1️⃣ 3357–3375 | Main H4 Supply
Why it matters:
Aggressive NY and CPI rallies have been sold off here; price rejected every attempt to close above 3375. OB, liquidity cluster, inducement—this is the first real ceiling above price.
Trade logic:
Watch for M15/H1 reversal or exhaustion. No clean break = supply remains active.
2️⃣ 3384–3400 | Macro Supply
Why it matters:
All failed breakouts from early summer were stopped in this block. Liquidity pool and macro OB; every test led to sharp pullbacks.
Trade logic:
Avoid FOMO—only short with confirmation of rejection.
3️⃣ 3410–3425 | Extreme Supply
Why it matters:
The final upper ceiling for now. Any spike here is likely to see big profit-taking and volatility.
🔹 Structural Key Demand Zones (Below Price)
1️⃣ 3330–3310 | Main H4 Demand
Why it matters:
All major dips last week bounced here—bulls are active in this OB. It’s the base of the current “micro-range,” with clear LTF inducement and high volume.
Trade logic:
Look for bullish reversal (M15/H1) before trusting any long from here.
2️⃣ 3295–3275 | Swing Demand / Discount Zone
Why it matters:
The main structure support for July. Strong OB, historic liquidity sweeps—each deep flush has brought responsive buyers.
Trade logic:
Watch for reaction, but don’t knife-catch without a clear structure break.
3️⃣ 3250–3225 | Extreme Demand / HTF Liquidity Pool
Why it matters:
The “final line” for bulls. This zone has absorbed all major liquidations and created swing reversals since early spring.
📊 H4 Structure Logic
Current play:
Gold is stuck in a structural cage between 3375 and 3310.
Until price closes outside these edges, every spike is likely a liquidity hunt.
Pro move:
Only react to confirmation in these zones—don’t force trades in the mid-range!
🧠 Game Plan
Set alerts at each supply & demand zone.
Wait for confirmation: M15/H1 CHoCH, BOS, wicks, or volume.
Let the news come to you: Powell & PMI will likely force a test of an edge; be patient.
💬 What’s your bias for the week? Drop it below and tag a friend!
🚀🚀🚀 and Follow GoldFxMinds for sniper-level gold planning and deep-dive SMC education.
Posted using the Trade Nation broker feed as part of their influencer program for using their TradingView charts in educational content.
— GoldFxMinds 💙
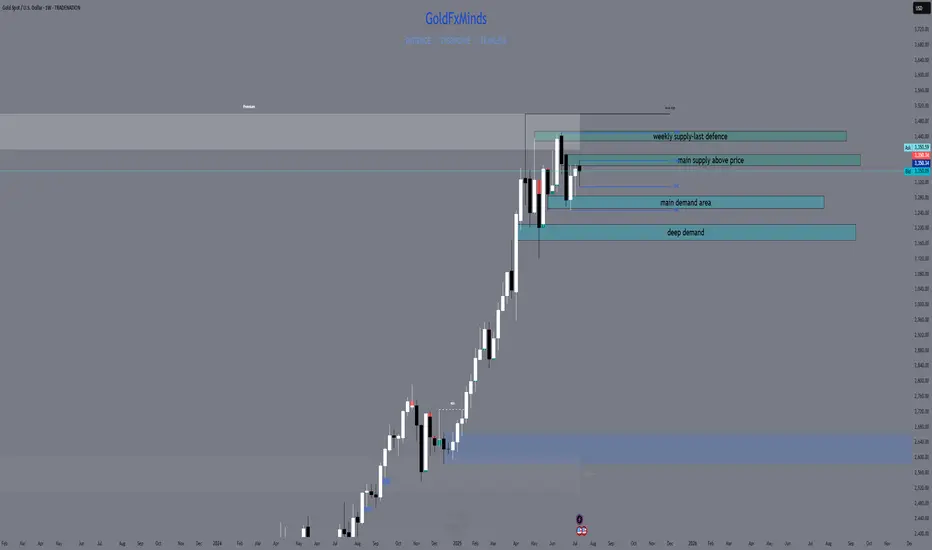
Weekly XAUUSD Outlook | July 21–25GoldFxMinds | Structure-Based HTF Plan
Hello traders,
This week we’re back in key HTF territory. Price is compressing inside a premium structure zone, between clean supply and demand areas. Trend is still bullish, but momentum is weakening — so we focus on structure to guide us.
🟨 Weekly Bias: Neutral | Range Structure in Play
We currently have no confirmed bullish or bearish bias on the weekly timeframe.
Gold remains trapped in a macro range between:
🟥 Upper Resistance Zone: 3355–3380
🟦 Lower Demand Zone: 3280–3240
Last week’s movement created a wick grab near 3375 followed by a strong push down, but without a clean break of structure — meaning we’re still inside a distribution–accumulation trap.
📌 Until we see a clear breakout (above 3380 or below 3280), the weekly bias remains neutral.
This is not a time to force directional trades on the weekly.
Instead, we wait for Daily and H4 confirmation, and position ourselves around the edges of this weekly range.
🔹 Last Week Recap
Weekly candle created a wick into 3377, rejecting just under previous week’s high. No BOS, no liquidity sweep with continuation — just a clear rejection inside supply, confirming premium trap.
Weekly candle closed with a top wick and small body — price is compressing under resistance. Still bullish structure, but not impulsive.
🔹 Weekly Key Structure Zones
🔸 3365–3390 (Supply)
→ Reason: Rejection from prior weekly high (3377), aligned with clean OB and FVG left behind from June breakout.
→ Structure context: No bullish BOS above 3375. This is now an unbroken supply zone with strong wick rejections. Liquidity sits above.
→ Use: Wait for price to tap back in → look for M15–H1 reaction for possible sell if no BOS above 3390.
🔸 3430–3450 (Supply - Last Line)
→ Reason: Unmitigated impulsive candle OB from prior macro swing high. This zone marks the final structure before a full continuation toward new highs.
→ Structure context: If this breaks with a strong BOS, macro structure flips bullish again.
→ Use: Only engage if price clears 3390 with strong volume and closes → watch this for last reaction zone.
🔸 3285–3260 (Demand)
→ Reason: Last bullish OB + FVG combo from early July, unmitigated. Price never retraced to this base since the rally.
→ Structure context: No BOS down yet, so this is still valid bullish origin.
→ Use: If price pulls back aggressively this week, watch this zone for LTF confirmation (CHoCH or BOS bullish). This would be a clean discount buy.
🔸 3210–3180 (Deep Demand)
→ Reason: Higher timeframe CHoCH origin zone, aligns with Fibonacci 61.8% retracement from entire May–July swing.
→ Structure context: Only in play if 3260 fails and we get clean BOS down on Daily.
→ Use: This is your swing buy zone if market breaks structure lower. Strong confluence for reaction.
🔹 HTF Structure Recap
Weekly trend: Still bullish (no BOS down), but compression under resistance
Structure range: Between 3390 and 3260 — price inside premium, no breakout yet
EMA Flow: Bullish but extended. Space for retracement.
RSI: Divergence above 3350 — supporting possible retrace.
🔹 Macro Events This Week
Tuesday: Powell speaks 🗣️ (volatility risk)
Thursday: Flash PMIs (usually directional)
Friday: Durable Goods & Home Sales 🏡
⚠️ Be patient on high-impact days. Let price come into your marked zones — don’t chase inside noise.
🔹 Summary & Plan
We are inside a macro range between 3390 (supply) and 3260 (demand). Structure is not broken — so we play both sides:
Sell Setup: If price taps back into 3365–3390 with no BOS → watch for reaction
Buy Setup: If price retraces into 3285–3260 → look for clean bullish CHoCH to validate
Middle area = chop. Wait for price to get to structure zones — don’t guess.
Thanks for reading 💛
We’ll drop daily and intraday outlooks once price moves closer to one of these structure zones. Until then:
🎯 Trade the reaction, not the prediction.
🔥 If you want these levels and sniper plans every day, follow , like 🚀🚀🚀 and drop a comment if you caught the move!
Stay focused, stay sharp, and never force a trade.
GoldFxMinds
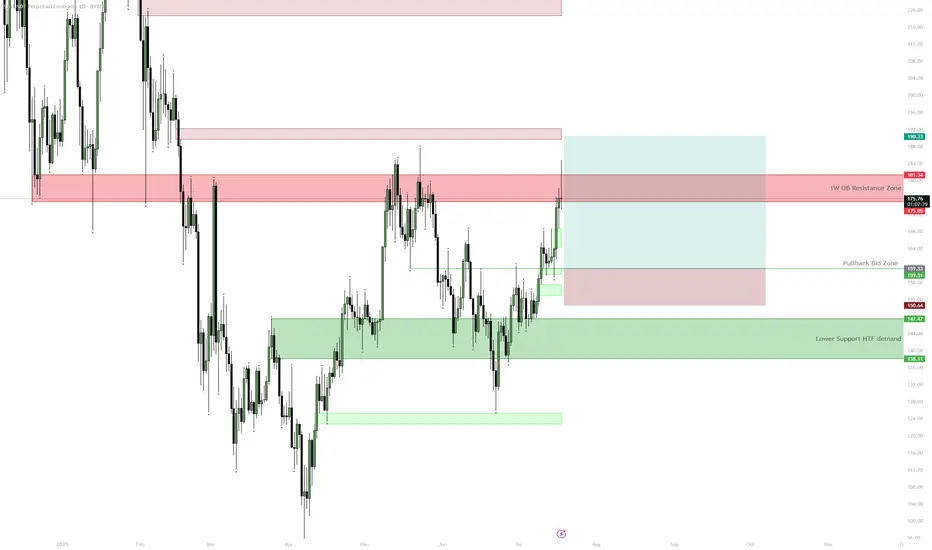
SOL — $180 HTF Resistance | Consolidation ExpectedSOL is approaching a key HTF resistance zone at $175–$181 with 1D RSI close to overbought. Unless price cleanly breaks above this area, a pullback to $160 or even the $138–$147 demand zone is likely before further upside. The setup provides a better risk/reward for longs on pullbacks after consolidation rather than chasing at resistance.
BTC — Chop → Range Low Sweep → Range High1. Watch for push to range mids (119.4–121.3)
2. Anticipate move back to range low (115,750) — buy zone
3. Target range high (125,000) after sweep
If no sweep to RL — scenario invalid

USDJPY - Trade The Range!Hello TradingView Family / Fellow Traders. This is Richard, also known as theSignalyst.
📈USDJPY has been trading within a range between $140 and $150 round numbers and it is currently retesting the upper bound of the range.
📚 As per my trading style:
As #USDJPY is around the red circle zone, I will be looking for bearish reversal setups (like a double top pattern, trendline break , and so on...)
📚 Always follow your trading plan regarding entry, risk management, and trade management.
Good luck!
All Strategies Are Good; If Managed Properly!
~Rich
Disclosure: I am part of Trade Nation's Influencer program and receive a monthly fee for using their TradingView charts in my analysis.

Bitcoin may make correction movement to support levelHello traders, I want share with you my opinion about Bitcoin. Price recently printed a new ATH at 118800 points and then began to show signs of correction. Before this breakout, the price was stuck in a long downward channel, where it bounced inside the buyer zone (103000–103800) several times and reversed upward. After the final breakout, BTC entered a range phase between the support level (103800) and the support area (110300–111300), building energy before the massive move. Once the price escaped this range, a strong impulse up followed, pushing BTC above all major levels and reaching a new high. However, after hitting the ATH, the price started to stall and consolidate. Currently, we can see signs of weakness at the top — the structure is forming lower highs and looks unstable, which may indicate a potential retracement. Now the price is trading above the support area, but I expect a corrective move back toward the current support level at 110300. This level aligns with the top of the previous range and now acts as strong demand. That’s why I’ve set my TP at 110300 level — right at the beginning of potential buyer interest. Please share this idea with your friends and click Boost 🚀
Disclaimer: As part of ThinkMarkets’ Influencer Program, I am sponsored to share and publish their charts in my analysis.

SOL — Breakout Watch & Range Play1. Watch for breakout above trendline
2. Hold support 151–147 for bullish scenario
3. Target: 168.4 (pre month high)
4. Stop: below 125.9 (pre month low)

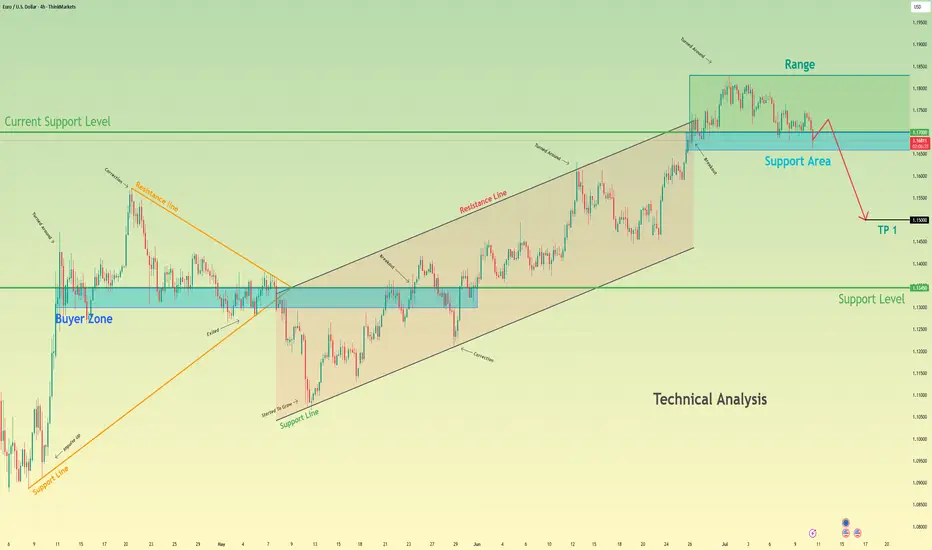
After breaking support level, Euro can continue to fallHello traders, I want share with you my opinion about Euro. After forming an ascending channel, the price steadily moved higher and reached a local range area near 1.1850 points. However, once it entered this zone, the momentum faded. The market started showing signs of distribution, and we saw multiple attempts to push higher being rejected. This range acted as a cap, preventing further growth. Now, the price has pulled back and is trading near the current support level at 1.1700, which also coincides with the support area. This zone has already been tested several times, and each bounce has been weaker than the previous one. That suggests growing pressure from sellers. Looking at the broader structure, the price exited the previous triangle formation with an upward move, but now that impulse has exhausted. The rising wedge is also broken. Based on the behavior at resistance and the weakness around the current support, I expect a breakdown from the range and further decline toward TP 1 at 1.1500 points. If bearish pressure continues, the price could eventually reach the major buyer zone around 1.1345 - 1.1300 points. Given the weakening momentum, retests of support, and lack of bullish continuation, I remain bearish and anticipate a continuation of the downtrend. Please share this idea with your friends and click Boost 🚀
Disclaimer: As part of ThinkMarkets’ Influencer Program, I am sponsored to share and publish their charts in my analysis.
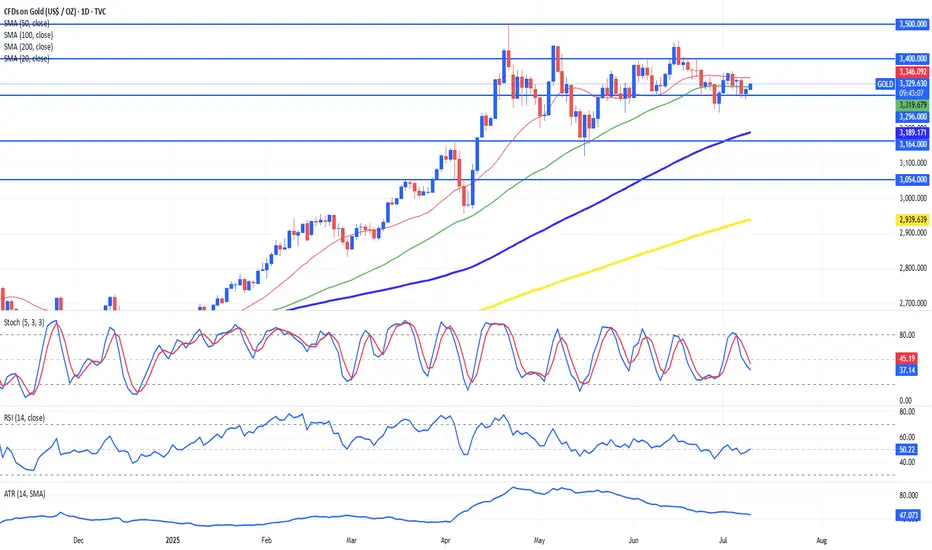
Gold Stuck in Neutral: Range Trading PersistsSince its impressive rally towards $3,500 earlier this year, Gold (XAUUSD) has settled into a consolidation phase, oscillating steadily between $3,250 and $3,400. Prices have consistently gravitated towards the 20-period SMA, reflecting a neutral sentiment among traders. Despite staying above key trend supports (50- and 200-period SMAs), gold has lacked sustained directional momentum.
Technically, indicators confirm this balanced outlook. RSI remains neutral around 49, indicating evenly matched bulls and bears, while the stochastic oscillator similarly shows neither oversold nor overbought conditions. A declining ATR highlights reduced volatility, signaling cautious market participation. Critical near-term support lies at $3,164 and $3,054, while resistance holds firm at $3,296 and $3,400. Traders should anticipate continued mean reversion and look to fade extremes within this established range.
Fundamentally, Gold faces competing drivers. Geopolitical uncertainties and central bank diversification away from the U.S. dollar provide bullish tailwinds. Conversely, resilient U.S. economic data periodically boosts the dollar, restricting gold’s upside potential. Traders should monitor this week's Fed minutes closely, as surprises here could trigger volatility or even a breakout scenario toward $3,500 or a deeper correction below $3,164. For now, expect gold to remain range-bound, reacting sensitively to headlines and macroeconomic cues.
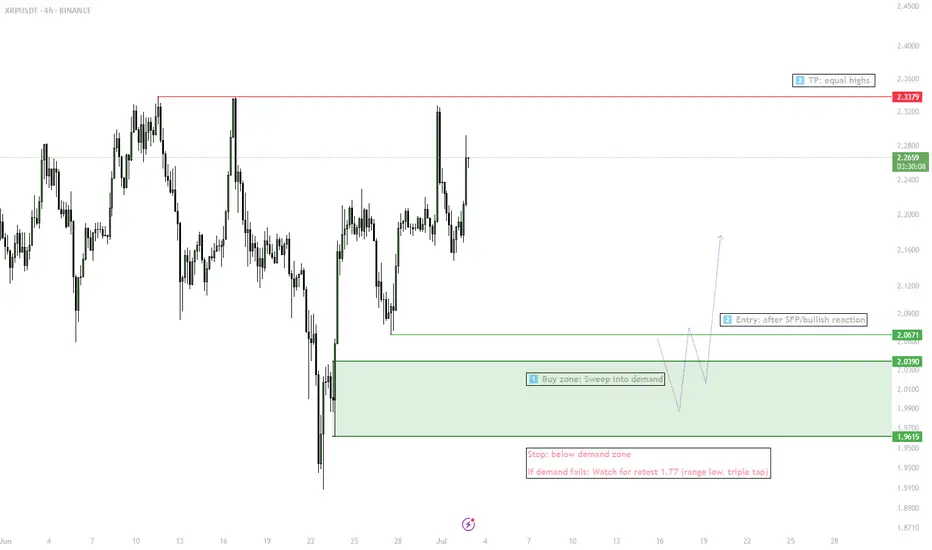
XRP — Liquidity Sweep & Range Play1. Wait for sweep into demand (2.07–1.95)
2. Enter long on SFP/bullish confirmation
3. Target: 2.33 (equal highs)
4. Stop: below demand zone
5. If stop triggered — next watch 1.77 for triple tap setup
US30 - Final Push before PullbackPotentially another push to upper levels of supply potentially 43,150-43,200. Can see this retest before seeing a potential pull back based off larger time frame.

GBPUSD - Over-Bought!Hello TradingView Family / Fellow Traders. This is Richard, also known as theSignalyst.
📈GBPUSD has been hovering within a big range marked in red and blue.
This week, GBPUSD is retesting the upper bound of the range acting as a resistance.
As long as the resistance holds, we will be looking for shorts on lower timeframes, targeting the lower bound of the range.
📚 Always follow your trading plan regarding entry, risk management, and trade management.
Good luck!
All Strategies Are Good; If Managed Properly!
~Rich
Disclosure: I am part of Trade Nation's Influencer program and receive a monthly fee for using their TradingView charts in my analysis.

Bitcoin may rebound from support line of wedge and start to growHello traders, I want share with you my opinion about Bitcoin. Initially, the price was trading inside a well-defined range, moving sideways with repeated rejections from both support and resistance. After several attempts to stay above the support zone, BTC finally broke down and sharply declined below the 104000 level, entering the buyer zone. However, the decline was short-lived. Price quickly rebounded from the lower boundary and formed a strong bullish candle, suggesting that buyers were still active. After this recovery, BTC began forming a wedge pattern, with a gradually narrowing structure between the resistance line and the ascending support line. This kind of price action typically signals a buildup of pressure and potential breakout. Currently, BTC is once again testing the support line of the wedge and hovering near the buyer zone, where it previously reversed. This level has proven significant and is now being retested. Given the current structure, the wedge formation, and price behavior near the support, I expect BTC to rebound from this zone and start climbing back toward the upper resistance area. My current TP 1 is set at 106800 points, which aligns with the mid-level of the previous impulse zone and the inner resistance of the wedge. Please share this idea with your friends and click Boost 🚀
Disclaimer: As part of ThinkMarkets’ Influencer Program, I am sponsored to share and publish their charts in my analysis.

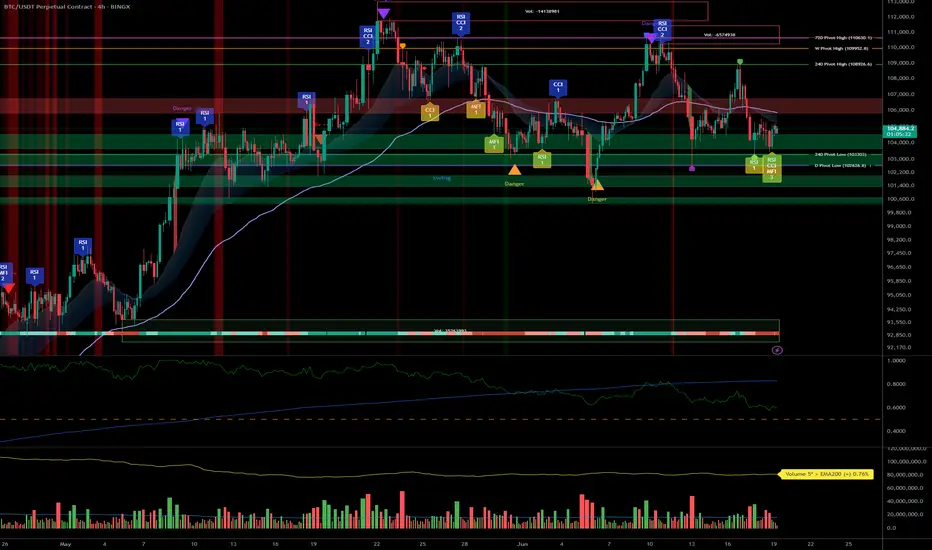
BTC – Bullish bias under review: 102k/103k supports in focus__________________________________________________________________________________
Technical Overview – Summary Points
__________________________________________________________________________________
Momentum : Dominant on all major timeframes (1D, 12H, 6H, 4H). Risk On / Risk Off Indicator signals STRONG BUY except on 15min (neutral).
Support/Resistance : Structurally key pivot zone 102k–106k; major supports 102k/103k. Potential breakout above 106k (swing target 109k).
Volumes : Normal across all timeframes. No excess signals, no accumulation/capitulation peaks.
Multi-TF Behaviors : Horizontal consolidation with bullish dominance. Short-term bearish divergence on 2H–15min, micro-TF in correction only, no panic.
__________________________________________________________________________________
Strategic Summary
__________________________________________________________________________________
Global Bias : Solid bullish structure as long as 102k/103k hold. “Risk On” maintained by sector outperformance.
Opportunities : Entries on pullback/main base 103k–104k; breakouts to watch above 106k.
Risk Zones : Clear invalidation <102k, potential rapid flush to 97k–88k; keep strict stop-loss below 102.5k.
Macro Catalysts : FOMC, Fed projections, Middle East geopolitics keep volatility high, but no shock. Price action leads near-term strategy.
Action Plan : Swing buy on confirmed support, dynamic hedge post-news, monitor volumes/closures on key pivots.
__________________________________________________________________________________
Multi-Timeframe Analysis
__________________________________________________________________________________
1D : Bullish momentum, major supports intact (102k/105k). Risk On / Risk Off Indicator = STRONG BUY, stable volume, no excess. Healthy structure for long swings.
12H : Positive bias, range 102.6k–106k. Risk On / Risk Off Indicator = STRONG BUY.
6H : Presumed accumulation 103k–106k, momentum still strong. No volume weakness.
4H : Range oscillation, structural support test at 103k. Sector outperformance, neutral volume.
2H : First sign of short-term weakness. Divergent with higher TFs but no panic.
1H : Technical rebound towards 104.8k possible as long as 103k support holds.
30min : Short-term trend remains bearish (trend 30min = down). Correction/purge ongoing.
15min : Neutral momentum, supports being tested. No panic or melt-down observed.
Summary : Strong bullish confluence on higher TFs, temporary divergence on micro-TFs. “Range with bullish bias” scenario as long as 102k/103k holds the structure.
__________________________________________________________________________________
Macro and Fundamental Analysis
__________________________________________________________________________________
FED/FOMC (June 18) : Rates unchanged, “data dependent” guidance. Raised volatility but no risk-off shift.
Market Sentiment : BTC technical structure holds, moderate post-FOMC volatility.
S&P500 : Above all key moving averages. Sector momentum (software, uranium, semis) remains dominant.
Energy Level : Weak oil = little macro pressure against BTC.
Geopolitics : Israel–Iran escalation / US posture reinforced. High FX/oil volatility but BTC resilient (>102k), no panic on record.
Economic Calendar : Closely watching BoE & SNB, but low BTC impact odds.
Implications : Post-news phase = ideal for range trading, no rupture event expected within 48h.
__________________________________________________________________________________
Strategic synthesis & R/R guidance
__________________________________________________________________________________
Long on pullback 103–104k, swing targets 106/109k. Optimal R/R (>2.5) if stop 102.5k (D Pivot Low).
Invalidation area : Clean close <102k or heavy downside volume (capitulation via ISPD/volumes).
Risk Management : Dynamic stops, partial hedge post-FOMC during macro volatility.
Conclusion : Bullish structure preserved. Range trading scenario dominant, no extreme signals or panic. Actions: support watch, technical buy on confirmed pullback.
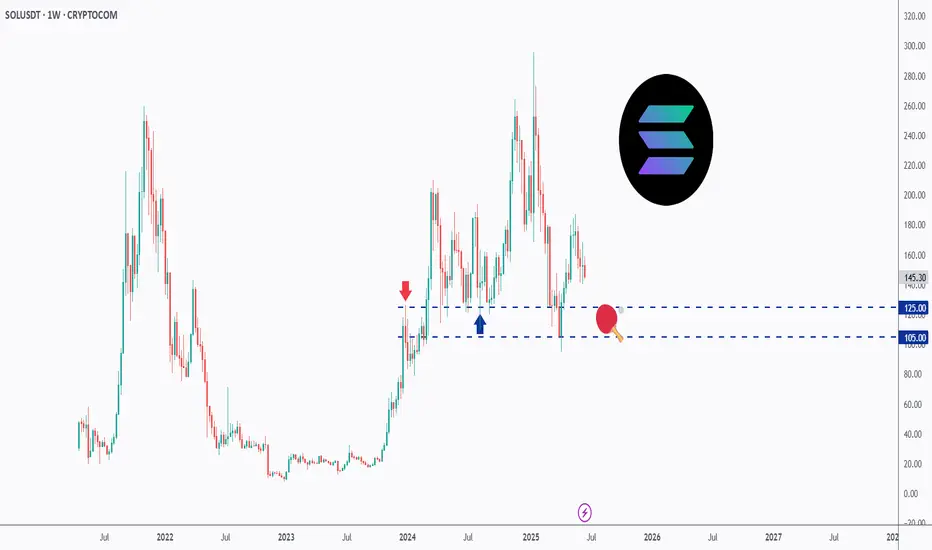
SOL - Playing Ping Pong!Hello TradingView Family / Fellow Traders. This is Richard, also known as theSignalyst.
📈SOL has been trading within a range between $100 and $200 round number.
And it is currently retesting the lower bound of the range which has been acting as a magnet lately.
As SOL approaches the $105 - $125 support zone, and as long as the $105 support holds, we will be looking for longs targeting the $200 round number.
📚 Always follow your trading plan regarding entry, risk management, and trade management.
Good luck!
All Strategies Are Good; If Managed Properly!
~Rich