BTCUSDT. Short and medium term analysisHi traders!
You can consider buying if the buyer protects
the hourly level of 35086.57,
the daily levels of 33390.95 and 31804.2 (associated with exiting the sideways market)
and the medium-term support level for the long-term trend at 24800.
As for selling, there is currently no context.
Take note of the 10D timeframe. After breaking out of the sideways market that lasted from January 2021 to May 2022 and initiating a short-term trend (with two waves), the price returned to the sideways range (with the lower boundary at 26700). If the buyer defends the last closed candle, then technically, the path is open to 40000, 48000, and 59000.
Range

CADCHF - BULLISH MOVE
As We Talked in The Previous Analysis:
On Thursday 19 Oct, The CADCHF Price Reached a Support Level (0.64800 - 0.64950)
The Price Created a Rectangular Range.
The Upper Resistance is Broken.
Currently,
The Price Created a Correction and Touched The Support Level!
and Now it Will Continue its Bullish Movement !
-----------
TARGET: 0.65980🎯

CADCHF - Important Breakout 📈Hi Traders !
On Thursday 19 Oct, The CADCHF Price Reached a Support Level (0.64800 - 0.64950)
Currently,
The Price Created a Rectangular Range.
The Upper Resistance is Broken.
So, I Expect a Bullish Move📈
i'm waiting for retest...
-----------
TARGET: 0.65980🎯

NAS100 29/10/23N1 giving us what we wanted to see from Wednesday, leaving us in the right position fort this week as we look to follow this pair short if the current range continues to give us strong bearish moves. after open we are watching our highs to see if we can catch this lower move before we hit our swing target.
Remember to always read order flow and follow what price is showing you instead of trading based on your desired direction. And, as always, stick to your risk and your plan.
We'll be closely monitoring market openings and price action throughout the week. If you find this analysis useful, let us know in the comments below and hit the boost button to show your support. Here's to a successful week of trading!

Bitcoin's typical weekend activity and "howto" w/Voodoo LevelsVoodoo levels tip: When low volatility is expected (like over the weekend), price on an intraday basis will most likely range between DH1 and DL1 levels.
Exceptions can always happen. But expecting low volatility and mean reversion at the CME open on Sunday is something I continue to bet on.
Enjoy your weekend!

BTC Breaks Out from 200 Days Range Bitcoin has been on quite a journey, spending over 200 days locked in a range-bound pattern. But, as the saying goes, "good things come to those who wait." Bitcoin has finally made a breakout move to the upside, and it's got its sights set on an ambitious target of $40,000. However, it's essential to recognize that it will likely need some time for reaccumulation before testing the range once more and forging ahead. 📈🎯
Breaking Free from the Range:
Look closer how this reaccumulation looks at 1H time-frame :
We are always moving from one liquidity to another
For what felt like an eternity, Bitcoin has been trading within a range, caught between certain price levels. But now, it has broken free, like a phoenix rising from the ashes, and its upward journey has begun. 🌅🚀
The Reaccumulation Phase:
After such a substantial breakout, it's only natural that Bitcoin would want to take a breath and reaccumulate its strength. This period of consolidation is essential to fortify the newfound levels and gather momentum for the next phase. ⏳🔍
Retesting the Range:
Before aiming for the ambitious $40,000 target, Bitcoin is likely to revisit the range it spent so long in. This retest will serve as a confirmation of the new support levels and ensure the foundation is solid for further upward movement. 🔄💪
Trading Strategy:
Observation: Keep a close eye on Bitcoin's price action and how it interacts with the former range boundaries.
Patience: Be prepared for a period of reaccumulation and consolidation. It's during these times that savvy traders position themselves for the next leg up.
Risk Management: Maintain sound risk management practices, especially when dealing with a market as dynamic as Bitcoin.
Conclusion:
Bitcoin's breakout from its long-standing range is an exciting development. However, it's crucial to remain patient and adaptable. The cryptocurrency market can be both exhilarating and unpredictable, so it's essential to be ready for a range retest and subsequent movements.
As Bitcoin sets its sights on $40,000, make sure you stay informed, exercise caution, and be prepared for the journey ahead.
❗️Get my 3 crypto trading indicators for FREE! Link below🔑

Is GBPAUD now in a larger range? On the Daily chart (right panel) you can see the wedge GBPAUD has been respecting until Tuesday when a large sell of caused it to close outside. After a flush down on AUD news Wednesday, it saw strong buying pressure which looks to be resuming today after a drop early London.
I'm now starting to look at the 30m range from 1.9060 to 1.9320 as the way to play this. There is a decent way to go before we get to the top of the range, but it could manage it tomorrow given the 21 day ExMo is 140. At which point I may look to buy a Put for next week, and trade the intra-day price action on Monday as a way to gain exposure to potential downside without having to hold the over night risk on a tradition position.
Overall well worth watching as the Aussie pairs have been moving nicely in recent weeks and we want to capitalise on that while we can.

S&P 500 Index. There is no buyer nowOn the daily chart, the price is at the lower boundary of the sideways range. Yesterday's trading day favored the buyer with decreasing volume.
On the hourly chart, the buyer resumed from the key impulse bar and twice attempted to breach the level of 4259.2 on volume but failed to do so effectively (failed to close an hourly candle above the level).
The buyer has not made a strong presence yet.
As mentioned earlier, local sales yesterday were observed from the level of 4259.2. For systemic sales, it is advisable to wait for the price to interact with the daily candle of October 19, 2023. Or after a successful breakout of the lower limit of the daily range and the seller defending this breakout.
Local purchases can be sought upon the buyer's protection level at the lower boundary of the daily range: 4217.4. Targets are 4259.2, 4269.9.
Good luck in trading!
Disclaimer:
This case study is for educational purposes only and does not constitute investment advice or recommendations.
The trading or investment ideas presented here are for illustrative purposes only and are an integral part of a case study demonstrating the concepts of using volume to analyze or trade within the market scenarios discussed.

TRU/USDT 1D. Secondary trend. Local accumulation range.TrueFi/USDT 1D. Local and secondary trends.
In the main trend - downtrend channel was formed. You can check this if move chart to the left in the main idea.
This channel was broken up in winter 2023, when there was local pump on all crypto market.
At that time, price pumped 360% to 0.13$ zone and from the the pullback has started. It formed quite an aggressive downtrend, which has been broken Jun 2023.
After that falling wedge started to form. The support lvl was formed at 0.0323$, while the decline lasts for 232 days as for now, just an interesting point.
Price formed the range with, as already mentioned, support at 0,0323$ and resistance at 0,0392$(14 - which is "balance").
Price has deviated this ranged locally - reaching the minimums of winter 2022-2023 - then turning back to the range. Now, the price is near the resistance zone locally.
During all that secondary downtrend we've seen 2 volume spikes - 1 on Jun 1 2023, other on Aug 21. As for now the price is consolidating in quite a small range of 25%. It has also broken the resistance of the falling wedge locally.
All the details are on chart. If market allows - locally we can reach the middleterm resistance zone, shown on chart. It's 0.0609$ to 0.0777$ zone. Very logical resistance in terms of numbers.
It may happen only if we break and hold above 0.0392$ lvl zone(current range resistance). Everything is with accordance to the market tendency.
Linear chart is for the clarity(no shadows of candles). Percent to the resistance zones are shown.
There has been also the retest of the broken local falling wedge(on chart).

XRP to .64Previous trading range now broken and confirmed, daily Gaussian channel also broken to the upside and looking to capitalize on profit at .64. No specific time frames but before the end of December is expected.

BTC UPTOBER UPDATE Just a quick update for BTC, after a very strong rally last week price has continued to rally this week also. My initial thoughts for this rally were price would struggle to break through the 32k level which can be seen as the midpoint of the range set from this years lows up to the right shoulder of the head and shoulders reversal pattern confirming the end of the bullrun.
The range shows just how important the 32k level is, it's also aligned with the midpoint of the range. Typically the midpoint is a place to take action, to flip this level for the first time in almost 1.5 years cannot be taken lightly. I would like to see a retest of that level to confirm as new support, only then will I start to get bullish.
I still have a feeling there's one last drop towards yearly open, I have said this a lot in the past idea posts. However, if price finds its feet above the range midpoint it becomes a lot more difficult, maybe the whales have already loaded up their bags? Blackrock and co already stocked up for their ETF's to be approved by the SEC?
I'm not married to this idea of retesting yearly open, it's still my preferred plan. Acceptance above 32k and I will go back to the drawing board.

bearish retest of top rangeThings are moving fast. Too fast.
The last time things moved this fast was before a big blowout.
Looking to get in to a 1x short over the next weeks depending on how chart looks.
Maybe we see a wick up on the next monthly candle and then retrace?
Good luck everyone, good luck to the people who are buying this to hold for longer. It's not back sorry this is not how bull markets start or are being made, .. this is the first lower high and everyone who is still holding this ponzi or still desperate enough to trade this day by day and follow altponzis gets exited.
If youre in a rush to make money youre in a rush to lose money.
patient.

the 10k or 30k bitcoin debatehow both sides see it.
we are currently sandwiched in a range of historical resistance/support flips - the initial 10k resistance flipped support for the bullrun, and the level that held price to ATH now flipped resistance.
bears are aiming for a retest of this area near 10k
bulls are aiming for a retest of the area near 30k
...both are probable
thus far we are unable to break the .75 of the range to 30k with 2 decent rejections.
as the .25 was front ran there is a likely chance we swoop the 15k level.
losing the .25 would most likely open the doors to 10k for a retest of the demand zone that confirmed the covid bullrun
likewise holding the .5 here with the obvious ih&s pattern could see the .75 claimed with the 30k target activated.

CADCHF - Around The Lower Bound Again!Hello TradingView Family / Fellow Traders. This is Richard, also known as theSignalyst.
on Weekly: Left Chart
After rejecting the 0.68 resistance, CADCHF traded lower and it is currently hovering around the lower bound of the range, and support 0.65.
on H1: Right Chart
For the bulls to take over, and activate our buy setup, we need a break above the last high in gray.
Meanwhile, CADCHF would be bearish and can still trade lower inside the green weekly support.
📚 Always follow your trading plan regarding entry, risk management, and trade management.
Good luck!
All Strategies Are Good; If Managed Properly!
~Rich

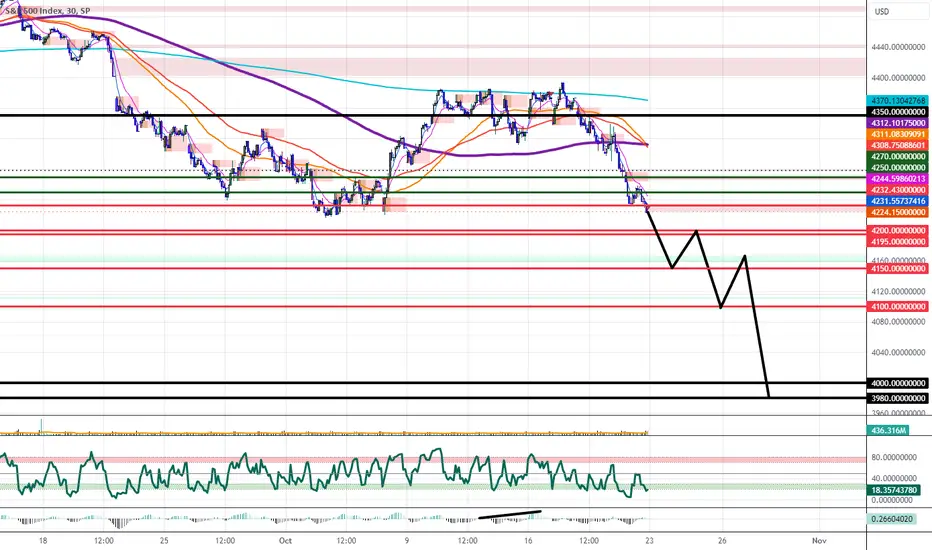
SPX Price Range Projection For This WeekBased on the price levels of interest and how we reacted to them during the last weekly range projection, I suspect we will get price action similar to what I have plotted on the chart and listed in text form below as last week's range breakdown has shifted down our weekly range, and now we are looking to trade lower and perhaps open the week to a gap down in price. I also think the price could just crash below the ranges as the market is in the most bearish stae I'v seen since 2020, but so long as the market doesn't lose control, I think it will likely follow my plot pretty closely this week, otherwise it could just give us a straight line down.
$4,150 Monday
$4,195 Tuesday
$4,100 Wednesday
$4,165 Thursday
$4,000-$3,980
USDCHF 22/10/23UC is another example of bearish price action we know from what we have seen of our other pairs that this is likely to carry over into this week but we will more than likely look to fill some of our high areas, which would match up nicely with what we know of our other pairs for example GU.
Main focus here is to take out a major high or low, as it stands we have a lot of liquid on both sides of the market, so we don't want to get caught up in anything we don't need to be in!
Remember to always read order flow and follow what price is showing you instead of trading based on your desired direction. And, as always, stick to your risk and your plan.
We'll be closely monitoring market openings and price action throughout the week. If you find this analysis useful, let us know in the comments below and hit the boost button to show your support. Here's to a successful week of trading!

GBPUSD 22/10/23Starting our week off with GU, from last week we had a very bullish out to our week and overall we stay within out bearish higher time frame moves, as it stands we would like to see our high tapped into for the bullish swing range we are on to be fulfilled, keeping in mind we are mainly running major lows, coming into our first session of this week iam looking to our liquid high (21700) i may look for an early short from here to run the EQ lows just under market close.
due to news from the weekend i wouldn't be surprised if we see gap open on our USD pairs.
Remember to always read order flow and follow what price is showing you instead of trading based on your desired direction. And, as always, stick to your risk and your plan.
We'll be closely monitoring market openings and price action throughout the week. If you find this analysis useful, let us know in the comments below and hit the boost button to show your support. Here's to a successful week of trading!

S&P 500 IndexOn the weekly chart, there was a sideways range from which a trend emerged (two impulses). Price returned to this sideways range five weeks ago, and no weekly candle has managed to close above the range boundary. There is a high probability that the price will test the lower boundary of the range at 3636.
On the daily chart, the price is within a sideways range, and after manipulation at the upper boundary of the range at point 2, the price reached the lower boundary. After interacting with the price at 4204.3, it may be possible to assess the presence of buyers.
Sales can be considered from the daily candle on 19.10.2023, which serves as protection against exiting the range at the upper boundary of the daily sideways range. For example, when the level at 4278.6 is protected by sellers. Alternatively, sales can be considered after breaking below the lower boundary of the range (4204.3) and protecting the breakdown by sellers.
Buying opportunities can be sought after buyers appear and protection occurs at level 4204.3.
Good luck in trading!
Disclaimer:
This case study is for educational purposes only and does not constitute investment advice or recommendations.
The trading or investment ideas presented here are for illustrative purposes only and are an integral part of a case study demonstrating the concepts of using volume to analyze or trade within the market scenarios discussed.

ETH USD IdeaHello fellow crypto enthusiasts! We've recently entered the world of Ethereum because it seems to be making a lot of noise, practically begging us to buy at the lows and sell at the highs. We're in it for the long haul, so we're mainly dealing with spot positions Long and seizing opportunities to scalp during bearish trends.
It's an exciting time for Ethereum, and we're eager to witness how this distribution phase will unfold. We're going to keep a close eye on the market to see just how high Ethereum can soar. Now, let's talk about our take-profit levels. And here's the exciting part – we've managed to make our positions practically risk-free at this point. Stay tuned, and we'll keep you updated as this thrilling journey unfolds.

GOLD → Strong zone retest. Bounce before further growth OANDA:XAUUSD is breaking out and is about to test a key area of liquidity at the moment. What can we expect to see from gold going forward?
On the chart I have marked such important levels as 1953 and 1946.7. This is a rather strong resistance area forming a global sideways range. After a long retest, the price is highly likely to fail to break this level the first time and may form a correction to the support. But in the near term, based on fundamental factors and market sentiment, we can assume that the growth will continue after the pullback. In the medium term, the price may test the 2000 area, but we are interested in cheaper zones to start with.
Moving averages support the bullish trend.
Support levels: 1928
Resistance levels: 1946, 1953
Since we have a strong trend + distribution, this movement may continue, but after the retest of the mentioned resistance area. We will follow the price reaction to the area to make further conclusions
COMEX_MINI:MGC1! COMEX:GC1! OANDA:XAGUSD COMEX:SI1! CAPITALCOM:US500 TVC:DXY
Regards R. Linda!

EURJPY - Detailed Video Analysis 📹 From Daily To H1Hello TradingView Family / Fellow Traders. This is Richard, also known as theSignalyst.
📈 Here is a detailed update top-down analysis for #EURJPY.
Which scenario do you think is more likely to happen? and Why?
📚 Always follow your trading plan regarding entry, risk management, and trade management.
Good Luck!.
All Strategies Are Good; If Managed Properly!
~Rich

NZDUSD - Trading The Range 🌊Hello TradingView Family / Fellow Traders. This is Richard, also known as theSignalyst.
NZDUSD has been trading inside a big range between 0.587 and 0.605 and it is currently sitting around the lower bound so we will be looking for buy setups.
NZDUSD is in the making of a potential double bottom pattern, but it is not ready to go yet.
🏹 For the bulls to take over, we need a break above the gray neckline at 0.5932
Meanwhile, until the buy is activated, NZDUSD can still trade lower.
📚 Always follow your trading plan regarding entry, risk management, and trade management.
Good luck!
All Strategies Are Good; If Managed Properly!
~Rich

SFPUSDT → Pre-break consolidation could send the price upward BINANCE:SFPUSDT after months of forming a sideways range on the background of the global honey trend finally forms a pre-breakdown consolidation against resistance, which may initiate a trend change
We are interested in the global pattern "symmetrical triangle" - in fact, it is a range within which the price is gaining liquidity. Above the range, after the first breakout of resistance, the second level - 0.6420 is formed and relative to this level an ascending triangle is formed, which can be interpreted as an attack of dynamic buyers on the limit resistance area. On the background of possible BINANCE:BTCUSD strengthening, SFP can get a good bullish potential when the resistance of the ascending triangle is broken. The moving averages act as trend support.
Resistance levels: 0.6420
Support levels: previously broken range resistance
In the long term, I expect a breakout of 0.6420 followed by price consolidation above the level, which will form a bullish potential.
Regards R. Linda!
