ACT: Classic Range Accumulation with Breakout Potential#ACT is showing clean sideways movement with classic deviations—textbook accumulation. Horizontal volume is stacked right in the middle, confirming the range is solid.
This one’s coiling up for a move. Follow me so you’re in before it breaks out. 🚀
Entry: 0.052-0.0536
TP: 0.068
SL: 0.0463
Range

Bitcoin may continue grow inside upward channel to seller zoneHello traders, I want share with you my opinion about Bitcoin. Looking at the chart, we can observe how Bitcoin corrected down to the support level, which also aligned with the buyer zone. From there, the price started to rise. It didn’t take long for BTC to reach the resistance level, which matched up with the seller zone. After breaking through that level, the price began consolidating within a range. Throughout this range, Bitcoin tested the upper boundary several times, but on the last attempt, it reversed and began to decline. The drop continued until it broke through the 86500 level, effectively exiting the range and pushing lower toward the next support. Once the price reached that area, it broke below the level and even dipped under the buyer zone, but quickly reversed and started climbing within an ascending channel. Inside this channel, BTC pushed up to the 83500 level, broke through it again, and maintained bullish momentum. At the moment, Bitcoin is trading within the channel, and I anticipate a potential correction back to the lower boundary of the channel, followed by continued growth toward the seller zone and a break of the resistance. For this scenario, my target is set at 87000 points. Please share this idea with your friends and click Boost 🚀

GBPUSD break or bounce? Thoughts?GU has been moving sideways for weeks now, is it time for a breakout or will it tumble back down to find support?

AUDCHF BEARISHAUDCHF is in a H4 range. Overall price has been bearish so I'd lean more towards sells. I'd wait for price to break the range support before I continue selling to 0.55000.

Bitcoin can make small move up and then drop to support levelHello traders, I want share with you my opinion about Bitcoin. Earlier, price was moving inside a range, where the price repeatedly bounced between the upper boundary and the buyer zone. After multiple failed attempts to break higher, the price finally broke out and started an upward movement, forming a strong bullish impulse. This upward momentum led BTC into the support area, where it consolidated briefly before continuing to rise. From there, the price began to form an upward wedge, respecting both the support line and the resistance line of the structure. Recently, BTC tested the upper boundary of the wedge and rolled down, confirming the resistance. Now, the price is trading closer to the upper half of the wedge but shows signs of weakness near the resistance line. Based on this setup, we might see that the price can one more short-term attempt to grow, followed by a rejection from the upper boundary and a move downward toward the 86500 support level. If the price fails to hold this level, the next stop could be the support line of the wedge. Please share this idea with your friends and click Boost 🚀

USD-CHF Local Short Form Resistance! Sell!
Hello,Traders!
USD-CHF is trading in a
Kind of range consolidating
For a next big move but
Right now we can use the
Moment to trade the local
Range and to short the pair
From the horizontal resistance
Of 0.8855
Sell!
Comment and subscribe to help us grow!
Check out other forecasts below too!
Disclosure: I am part of Trade Nation's Influencer program and receive a monthly fee for using their TradingView charts in my analysis.

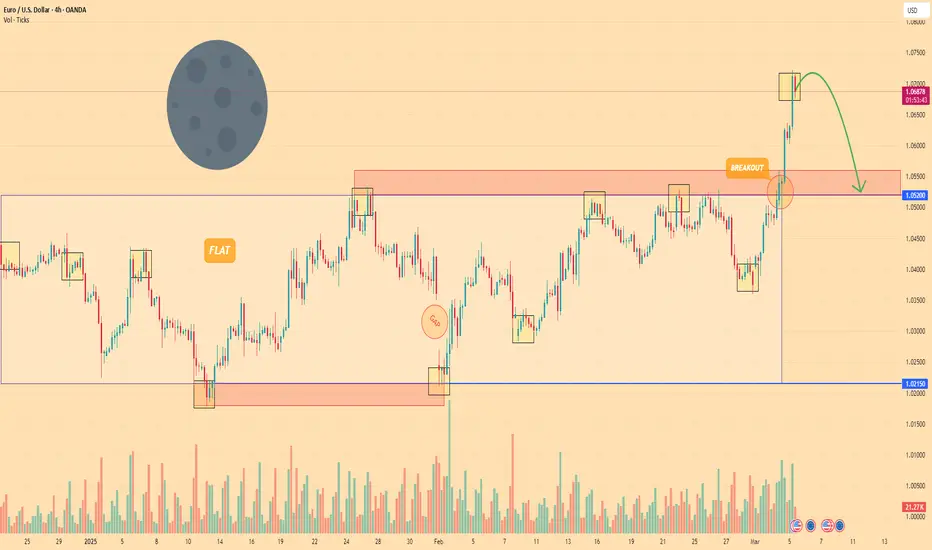
Euro can drop to 1.0650 points, breaking support levelHello traders, I want share with you my opinion about Euro. Earlier, the price was moving inside a range, bouncing between the boundaries and forming a buyer zone near the lower support area. After several rebounds, EUR started to grow and eventually broke out from the range, making a strong upward impulse. The growth continued with a breakout through the support level, which later turned into a support area. From there, the price continued its bullish trend, but after touching the resistance line, it turned around and entered a correction phase. Over the last few sessions, Euro has been forming a pennant pattern, trading between the resistance line and the support line. Now the price is consolidating near the apex of the pennant, showing weak momentum. I expect a false breakout to the upside, followed by a sharp decline from the resistance line. In this scenario, the price would likely break through the current support area and move toward the 1.0650 points - this is my TP1. Given the recent price structure, the correction phase, and the weakening bullish pressure, I remain bearish and anticipate further decline. Please share this idea with your friends and click Boost 🚀

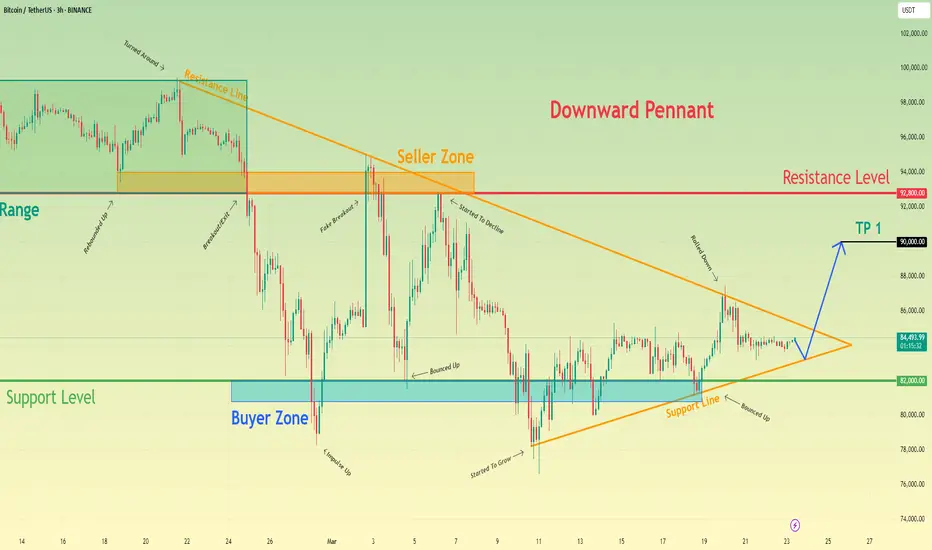
Bitcoin may rebound up from pennant to 90K pointsHello traders, I want share with you my opinion about Bitcoin. Not long ago, BTC was trading inside a wide range, where the price moved sideways and eventually touched the resistance line, from which it turned around and began to fall. After the decline, BTC exited the range, breaking through the lower boundary and sharply dropping to the support level, which aligned with the buyer zone. From there, we saw a quick impulse up, but this movement faced strong resistance inside the seller zone, where a fake breakout occurred — price briefly moved above but then sharply reversed and began another decline. As BTC continued to decline, it formed a downward pennant pattern. Within this structure, we can clearly see how the price respected both the resistance line and the support line of the pennant, bouncing up from the lower boundary several times. The most recent bounce came again from the buyer zone, indicating that bulls are still defending this area. At the moment, BTC is consolidating near the tip of the pennant, and I believe there’s a high probability of an upcoming breakout. My base scenario assumes that we could see one more minor pullback toward the support line, followed by an upward breakout from the pennant. If that happens, the price may reach the 90000 points, which I consider as TP1. Please share this idea with your friends and click Boost 🚀
$SPX @spx6900 Trading RangeSP:SPX - HTF global range is in play at the moment.
I was bearish on SP:SPX for some time, but the speed of the dump exceeded my expectations for sure.
SP:SPX bounced from the very last key level. If the current low is lost, things could get very ugly.
------------
------------
Note:
Long trade projection is the most positive outcome possible.
As always, my play is:
✅ 50% out at TP1
✅ Move SL to entry
✅ Pre-set the rest of the position across remaining TPs
It's important to take profits along the way and not turn a winning trade into a losing trade.

Euro can rebound from mirror line and start to move upHello traders, I want share with you my opinion about Euro. This chart illustrates how the price started trading within a range, where it initially corrected to the buyer zone and reached the mirror line. After that, it began to rise and, in a short time, moved up to the upper boundary of the range, which coincided with both the support level and the support area. Next, the price reversed and dropped back to the buyer zone, breaking through the mirror line. However, EUR soon resumed its movement within the range and eventually reached the upper boundary again. After consolidating near this area for a while, it made a slight correction before rebounding to the mirror line. Later, the Euro broke out of the range and eventually breached the mirror line, reaching the current support level, which aligned with the seller zone. Although it briefly rose after breaking this level, it recently reversed and fell back into the seller zone. At this point, the Euro might test the mirror line before starting to move upward, exiting the seller zone. Based on this, my TP is set at 1.1050. Please share this idea with your friends and click Boost 🚀

Bitcoin can rebound from triangle pattern to 90K pointsHello traders, I want share with you my opinion about Bitcoin. Not long ago, the price was trading within a range, where it quickly entered the seller zone and remained near this area for quite some time. BTC attempted to rise but failed, and after nearly reaching the upper boundary of the range, it dropped sharply. The price broke through the 94000 level, exiting the range as well, and then fell to the support level, which aligned with the buyer zone. Shortly after, the price made a strong upward impulse toward the resistance level before starting a decline within a downward triangle. Inside this pattern, BTC initially made a correction, climbed back to the resistance line of the triangle, and then resumed its decline. Eventually, the price dropped to the 78900 support level, where it touched the triangle’s support line and then began to rise. At the moment, BTC continues to climb near this level, and I expect it to rebound from the support line of the triangle and break above the resistance, signaling an exit from the pattern. If this happens, I anticipate further growth, so my target is set at 90000 points. Please share this idea with your friends and click Boost 🚀

Euro can decline to support area, after which it will rebound upHello traders, I want share with you my opinion about Euro. By analyzing this chart, we can see that the price entered a range before dropping into the buyer zone, which aligned with the lower boundary of the range. After that, it reversed and started to rise, eventually reaching the upper boundary of the range, which coincided with the 1.0515 support level and support area. The price then immediately turned around and fell below but soon bounced back to the support area, consolidating there for a while before breaking lower. Following this, the Euro reversed direction and began to climb, soon reaching the upper boundary of the range and breaking out of this pattern, surpassing the 1.0515 level as well. After this move, it continued to rise within a wedge pattern, eventually reaching the 1.0775 support level, which aligned with another support area, and broke through it too. The price then touched the resistance line of the wedge and made a corrective move toward the support line of the pattern. In my view, the Euro could enter the support area before rebounding toward the resistance line of the wedge. Based on this, I set my TP at 1.1000, as it aligns with this resistance level. Please share this idea with your friends and click Boost 🚀

BTCUSDT Major supports and resistances after FallWe were expecting this fall from 108K$ and now most of target almost hit:
Now we can expect maybe some range here for a while near 77K$ support zone and soon after that more fall is also expected or if the red trendline break to the upside then market is again bullish.
Major supports now:
A. 78000$
B. 72000$
C. 69000$
Major Resistances now:
A. 85000$
B. 89000$
C. 93000$
DISCLAIMER: ((trade based on your own decision))
<<press like👍 if you enjoy💚

BITCOIN - WHERE ARE WE? When zooming out and looking at the Bitcoin chart, despite how crazy the market has been in recent weeks it comes down to a simple market structure with three separate clearly definable ranges:
RED RANGE (Accumulation) - From FEB '24 until the US election BTC chopped in primarily the top half of a range with five separate midpoint retests with progressively shallower rallies that eventually broke out with a catalyst from the political world.
BLUE RANGE (Expansion) - After a 10 month accumulation range the next phase in the bull cycle was expansion, a rally above ATH and into price discovery. An extremely thin inefficiency rally.
Now price currently is at the midpoint of this range and despite the geo-political waterfall of bad news BTC has held up better than I had expected given that usually a rally that goes straight up has no support levels on the way back down. The chart does suggest a retest at $73,700 at some point before deciding which direction to go in after that.
GREEN ZONE (Distribution) - For the last 3 months Bitcoins price has been extremely volatile, bouncing between $91-108K, the range containing price perfectly with weekly retests of the range bottom and a swing fail of the range high. That SFP set off the beginning of BTCs sell-off eventually breaking through the bottom and back into the blue range.
With Bitcoin at the midpoint of the middle range it's a perfect time to have a data release in CPI, A volatile news event that can be a catalyst for a larger market move and with Tradfi selling off, this CPI is the most important of the Trump administrations term so far:
CPI DAY
PREVIOUS: 3.0%
FORECAST: 2.9%
ACTUAL: ??
Bullish - sub 2.8% print. At least the market sell-off is having a positive effect on inflation and isn't painful for no reason. BTC reclaims blue midpoint with a view to retest blue high.
Bearish - 2.9% or higher. Market sell-off hasn't has an immediate effect on inflation so the sell-off is bad in all aspects, except for the Trump admin moving closer to their wish of a weaker dollar and lower interest rates. FWB:73K blue range bottom retest on the cards.


gold still is in trading range and we should BLSHI mean buy at low of trading range and sell at high of trading range

Gold can reach seller zone and then drop to support levelHello traders, I want share with you my opinion about GOLD. Looking at this chart, we can observe how the price moved within an upward channel before reaching the resistance line and making a corrective move down to the support line. After that, Gold climbed to the support level, which aligned with the buyer zone, and eventually broke through, exiting the channel. Following this breakout, XAU began trading within a range, briefly pulling back to the buyer zone before resuming its upward movement. Shortly after, Gold reached the seller zone and consolidated there for some time, as this area coincided with the upper boundary of the range. Later, the price made a correction down to the support level before reversing direction. Since then, the price has been rising steadily, and at this point, it remains in an uptrend. Given this setup, I expect Gold to re-enter the seller zone before initiating a decline toward the support level, which aligns with the lower boundary of the range. Based on this, my target is set at the 2850 support level. Please share this idea with your friends and click Boost 🚀

US Light Crude (WTI) - Buy SetupTechnical Analysis:
The overall trend remains bearish, but the price has stalled at a major support level of 6568.7, corresponding to the September 2024 lows. WTI has been rangebound for several months, with the upper end of the range at 8044.3. Yesterday's Doji candle signals indecision, and today’s early move higher suggests potential upside. While speculative, the risk/reward setup appears attractive.
Fundamental Analysis:
The latest Commitment of Traders (COT) Report indicates increasing long positions in Oil, suggesting that institutional investors ("Smart Money") may be accumulating around current levels.
Seasonal Trends:
Historically, between March 18 – May 21, Oil has delivered positive returns 76.47% of the time, with an average gain of 5.56% over the past 34 years.
Trade Setup:
Entry: 6630 – 6765
Stop Loss: 6462 (below the 2024 low at 6568)
Target: 8044 (upper end of the long-term range)
Disclosure: I am part of Trade Nation's Influencer Program and receive a monthly fee for using their TradingView charts in my analysis.

APT on the move!APT has been trading within a range between $5 support and $7.7 resistance.
Currently, APT is hovering around the lower bound of the range, so we will be looking for longs as long as it holds.
For the bulls to take over in the long term, a break above the $7.7 resistance is required.
Disclaimer:
This content is for informational purposes only and should not be considered financial or investment advice. Always do your own research and consult with a professional before making any investment decisions.

EURO - Price can make correction, after strong movement upHi guys, this is my overview for EURUSD, feel free to check it and write your feedback in comments👊
A few days ago price entered a flat, where it at once declined to support level, which coincided with support area.
The price entered this area and then started to grow, so EUR rose to $1.0520 points in a short time.
After this movement, Euro turned around and fell to $1.0215 support level again, making a strong gap.
Next, price turned around and in a short time rose to $1.0520 level and some time traded near it.
Later, price broke this level and rose until to $1.0720 points, but recently it turned around and started to fall.
So, I think that the Euro can make a correction movement to $1.0525 support area, after movement up.
If this post is useful to you, you can support me with like/boost and advice in comments❤️
Bitcoin may rebound up from buyer zone to 94100 resistance levelHello traders, I want share with you my opinion about Bitcoin. A few days ago, the price was moving inside a downward channel, where it reached the support line and immediately bounced back up to the channel’s resistance. After that, BTC continued its decline, testing the resistance level, which aligned with the seller zone. The price briefly dipped below this level but quickly reversed and rebounded. Eventually, Bitcoin exited the channel and moved into a range, reaching its upper boundary before turning downward again. In a short period, the price dropped to the seller zone, where it consolidated for some time. BTC then attempted to push higher but failed and resumed its decline. Breaking below the 94100 resistance level, the price moved further down, fluctuating between support and resistance lines. Bitcoin eventually fell to the support line, breaking through the 83400 support level, which aligned with the buyer zone. However, this breakdown turned out to be a false move, as BTC immediately rebounded and surged back above that level. Currently, BTC is continuing its upward movement. I anticipate that the price may first test the buyer zone before resuming its growth. Additionally, if it manages to break through the resistance line, it could keep climbing higher. With this in mind, my TP is set at the 94100 resistance level. Please share this idea with your friends and click Boost 🚀

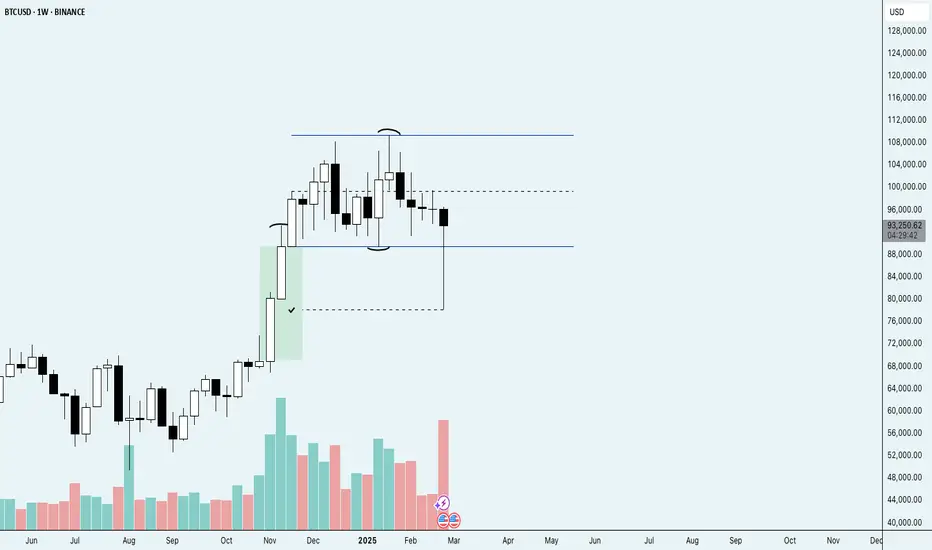
Bitcoin Pressing the RangeThis is a wild candle, not often do we see this much pressure.
If this weekly closes back inside the range, it's pretty clear imo that the trend will simply continue. BTC has cleared the imbalance and already wicked back upside of the range low, wild stuff.
Not bulltarding, just simple TA.
Bitcoin can break support level and continue to fall in channelHello traders, I want share with you my opinion about Bitcoin. Looking at the chart, we can see that the price moved into a range, where it initially surged to the seller zone, touching the upper boundary. After that, it quickly reversed and dropped to the lower part of the range, which aligned with the 93900 level, before bouncing back up. The price made another attempt to reach the seller zone, but this time it broke out of the range and started declining within a downward channel. Inside the channel, BTC initially touched the support line but struggled to gain momentum and continued to fall. Not long after, the price broke through the 93900 level, retested it, and then dropped further to the support level, which overlapped with the buyer zone. It even briefly broke this level, reaching the channel’s support line before making a sharp recovery. Following this bounce, BTC quickly reclaimed the broken support level and is currently trading near the 88100 mark. In my view, Bitcoin could rise to test the channel’s resistance line before resuming its downtrend and breaking the support level again. Based on this, I’ve set my TP at 85000 points. Please share this idea with your friends and click Boost 🚀
