AUD-CAD Wait For Breakout! Sell!
Hello,Traders!
AUD-CAD is trading in a downtrend
And the pair has formed a range
So we are waiting for the breakout
To determine the direction
Of the next move and because
Of the downtrend, the more likely
Direction of the breakout is
To the downside, but as I said
We will follow the direction
Of the breakout when
Entering the trade.
For now the bias is bearish tho
Sell!
Like, comment and subscribe to boost your trading!
See other ideas below too!
Range

Range bound Nikkei, Bullish mean revThe range bound Nikkei is rebounding off support at 25,750 and heading back to the mean at 27,875 and possibly to the resistance at 30,000. The last pivot low has created bullish hidden divergence which could mean the Nikkei breaks out of its range and rallies higher.

NZD CAD LONG TRADE The last wall of sellers was broken with an impulse wave and formed a correction pattern and we have a range that reflects the trend with a large percentage, we will get another impulse wave

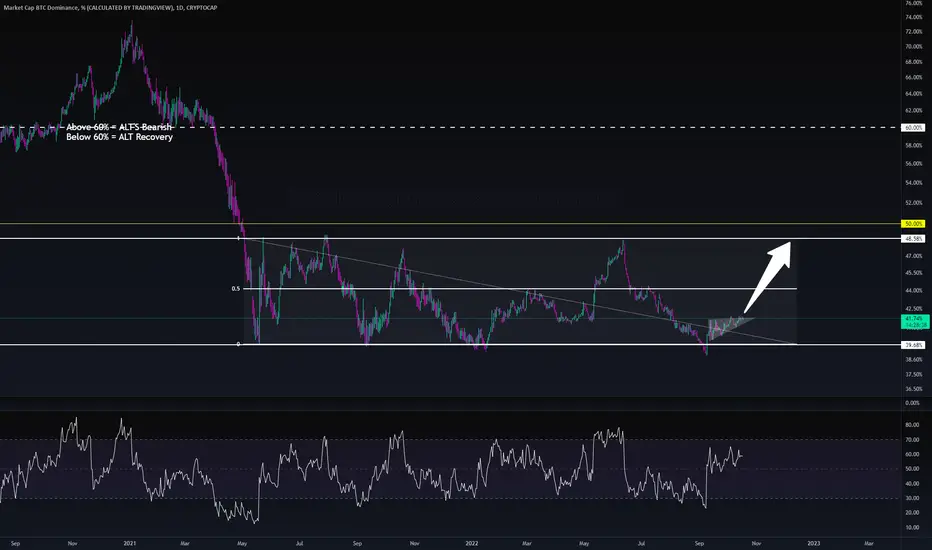
BTC Dominance Is Loving This RangeBTC Dominance Is Loving This Range
Yet again BTC Dom has bounced off this 40% support level - this can be interpretted many ways the most likely in this case is that BTC will likely be holding its cap (possibly even capital coming into it) whilst money drains out of the wider ALT market. With the USDT dominance looking like it might be dropping there could be a migration of ALT capital into BTC. Remember that when this happens this will "double" the impact of the BTC Dominance so not necessarily menaing that the Bitcoin price is going to fly....at all. Remember the dream scenario is always:
BTC Price Rise
ALT Market Cap Rise
BTC Dominance Fall
USDT Dominance Fall
Trading FlowchartThis is how every profitable trader that I know, makes money in the markets.
Know your Weekly, Daily, High, Low & Closing price levels
Know your intraday session opening prices
Look for swing highs and lows on your preferred trading timeframe
Buy High, Sell Higher
Sell Low, Buy Lower
Add to your winners
If the price turns 180º be prepared for sideways markets and take mean reversion trades

BTC - Almost Halfway Through The Accumulation E've been comparing recent BTC capitulation and now accumulation at the lows with the one in 2015. They are very similar in accumulation structure as well a how deep both capitulations went. Don't get me wrong, i don't thing this is a true bottom formation like it was in 2015 leading to the next bull run, but only forming a local bottom that just happens to be very similar as one in 2015. After completing this accumulation i still expect BTC will go into a retracement that can still take us slowly back in 45-50k area, before continuing the falL.
From the comparison with todays price action wth the 2015 one, we can also expect btc to still reach the top of the range, make even higher local high (green box) and still then fall down to the bottom of the range (orange box), before starting a long awaited retracement.
It all depends on a macro picture of the economy by itself. Will see what the stock market does first, but charts do show a local bottom being set for now.
DISCLAMER:
I am not a financial advisor so non of this should be taken as a financial advise. Be well.

What's next for DXY?
Based on the potential 2013 cycle and fed balance sheet - anticipation is that dxy should sideway to avoid extremes - - we can't move down as we have inflation and we can't move agressively a lot more up as we will kill the markets.
Dxy should stay within the projected range with slight downish bias for the next few weeks - but first emaflow entries will produce a buy signal which likely causes a test upwards which will reject and take us lower near the bottom of the green zone.
Highly suggest to check as it includes all the charts that explain the mindset behind this.

Bitcoin May Head To 21Khello traders
Despite the stability of Bitcoin, but there are other cryptocurrencies that fell by large percentages and reached strong demand levels with a very large percentage. The coming days, we will witness an upward trend in the cryptocurrency market
For me, a medium-term investment opportunity, I buy bitcoin and op

USDJPY looking for lift offUS CPI out this week, along with FOMC meeting minutes.
Markets have clearly gone sideways as the bankers meet up and discuss whatever it is that they discuss.

SP500 in a range, not a downtrend any longerI would long from here as we are at the bottom of the range... DXY has topped by the way

ETH - A busy, but important chartOkay yes there's a lot of lines on this one, I puked all my thoughts out onto it and tried my best to explain with text. I categorized this as a Long, however with potential more downside first... here's why.
Summary:
- want to reclaim 50th percentile of the overall fib (and breakout of downward sloping channel, at the least the channel eq)
- want to hold current support @ 1281
- if triangle is in play, target below in yellow back to downward sloping range low
- previous range base was also a significant range form January 2021, interesting is all
- elliot wave counts left out, might upload those later but they're on my YT
- bearish order block above in red (tapped twice)
- 786 fib is a must hold imo if we want no lower
Let me know what you think of Ethereum's current price action - in the comments!
V

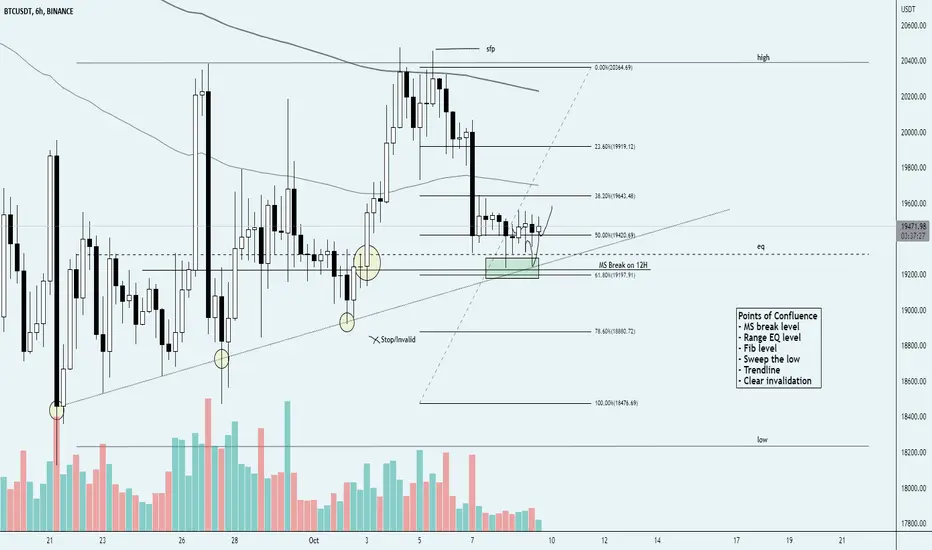
Bitcoin - Entered a Long I shared this chart recently saying I'd enter in green, we wicked inside briefly and I got the bounce I was looking for the reclaim that EQ level.
Criteria for confluence is on the chart in the box, check it out.
Invalidation becomes more likely on candle closes below green and I'll be 100% out of this trade if we go to the 786 fib creating a LL on this trend.
Thoughts otherwise are on the chart.
Let me know your thoughts.
V
✅ETHEREUM LOCAL LONG🚀
✅ETHEREUM will soon retest a key support level
So I think that the pair will make a rebound
And go up to retest the supply level above
LONG🚀
✅Like and subscribe to never miss a new idea!✅

RSR squiggly working out - back down to EQJust an update from previous post since I cannot post an update photo, but we followed the squiggly nicely and the idea is now reached.
Will update thoughts again soon!

Bitcoin - Long Idea (if given)Current trade idea for Bitcoin - BTC/USDT - if I get this I'll take it (green).
Around 2% risk to my invalidation. This would assume the mid-range holds, but I know if/when I will be wrong. I do have confluence for this idea, see points on the chart.
Give me your thoughts in the comments!
Cheers
V

USDJPY range tradingThe range was formed and confirmed after the first two range expansions which would have stopped both the bulls and bears out who were short-term holders.
Since then we have traded within the range and once again expanded the range.
Whilst price is below the Weekly open, I am looking for reasons to get short.

DONT FOMO INTO LONGS JUST YETWe are all looking at the same chart and thinking the same thing. SPY COULD have a serious bounce on the 200ma with a POSSIBLE bullish divergence on MACD and RSI. Many have already begun to FOMO into a possible year end rally as we have been rallying hard the past few days. This year is also a midterm election year (midterm election years usually have a rally beginning election time into the middle of the following year). However, this years year end rally is still not confirmed and going bullish so early would be disrespectful to the insane bear market we are having. Expect a retest of the 200ma in the coming weeks with the price coming back down to ATLEAST between 265 to 260, if not lower. If it holds, there is a definite possibility we could be testing 400 at the end of the year to beginning of 2023. However, for this upcoming month I am expecting us to be range bound. There are so many big earnings with banks reporting in the third week and big tech reporting in the last week of the month. Expect for us to have a better direction beginning of November.
Also, do not be surprised if we do not bounce at the 200ma. This bear market is no joke. If earnings are bad and we break down, be ready for a possible 320. Also note Credit Sussie CEO will deliver their turnaround strategy on OCT 27, aligning perfectly with with the end of big tech and bank earnings. How the market reacts to their strategy will also weigh into the direction the market will take to close the year.
Till the breakout in either direction is confirmed, be smart and play the range that will form.

BTC - Range Getting Narrower! UPDATEHello TradingView Family / Fellow Traders. This is Richard, as known as theSignalyst.
BTC has been ranging for a couple of weeks now between the upper blue zone 22500 and lower green zone 18000.
Lately, BTC is getting stuck inside a narrower range, inside the red trendlines .
So from a short-term perspective, as BTC approaches the upper red trendline, we will be looking for sell setups, and as it approaches the lower red trendline, we will be looking for buy setups.
In short, we will be trading the range. Until eventually it would be broken upward or downward.
UPDATE:
Now BTC is approaching the upper red trendline, so let's see if the bulls will be strong enough to break it upward. In this case we want an H4 candle close above it.
Or the bears will reject it and trade lower. In this case, we want a short-term bearish reversal setup to form and get activated on lower timeframes.
If we break above the 20500, then a short-term bullish movement till the 22500 in blue would be expected.
Which scenario do you think is more probable and why?
Always follow your trading plan regarding entry, risk management, and trade management.
Good luck!
All Strategies Are Good; If Managed Properly!
~Rich


BTC - Range Getting Narrower!Hello TradingView Family / Fellow Traders. This is Richard, as known as theSignalyst.
BTC has been ranging for a couple of weeks now between the upper blue zone 22500 and lower green zone 18000.
Lately, BTC is getting stuck inside a narrower range, inside the red trendlines.
So from a short-term perspective, as BTC approaches the upper red trendline, we will be looking for sell setups, and as it approaches the lower red trendline, we will be looking for buy setups.
In short, we will be trading the range. Until eventually it would be broken upward or downward.
If we break below the 18k, then further long-term bearish impulse would be expected.
If we break above the 20500, then a short-term bullish movement till the 22500 in blue would be expected.
By break, I mean a momentum candle close from H4 or Daily.
Which scenario do you think is more probable and why?
Always follow your trading plan regarding entry, risk management, and trade management.
Good luck!
All Strategies Are Good; If Managed Properly!
~Rich

JICPT| USDCNH on the way to test 7.2Hello everyone. My latest published idea with the title of USDCNH is likely to test 7.01, is absolutely right. Now the upper boundary of the range(7.01) has been conquered. What's next?
On the fundamental side, CNH is expected to be weaken due to the loose monetary policy to support the economy. I think China and Japan are the two major powers in the world keep or lower the interest rate. China's CPI is 2.5%, well below that of US. Also, China's export is losing its momentum. so the weaker CNH will help to maintain its competitive in the market place. However, China aims to make Renminbi the next global currency. So, CNH(offshore Renminbi) is required to be stable to attract foreign investors. So the question is where is the possible level government would step in?
I guess 7.2 is the key level we need to focus on. The level is the previous high created during the pandemic back in 2020.
On the technical side, the range works until it's been firmly penetrated. The upper boundary of the new range is coincided to be 7.2.
Let's see how it approach the key level. What do you think? Give me a like if you're with me.

SPX Sell 927/22 Good WinSmall Sell on SPX with a gain but nothing big
3708 entry
3716.50 SL
3691.90, 3680, 3673.70 targets
Since we're ranging I decided to sell the highs. we did make it to my first target which was basically the weekly opening price and I adjusted my SL into profit.
Price pushed back up to take today and yesterday's high out and ran back down to target 1 again. Added back on near my SL but already at BE with no complaints.
Second entry

$HUM, $XLV, Healthcare sector worth watching nowIf you have been invested in healthcare stocks or ETF's you may want to take profits between now and the end of October. I am keeping an eye on this chart for some good trades. It is a low volume stock with very low options volume, so be very selective with your entry time/place and your option price. Daily trading ranges can be large or small, so give extra consideration to time frame and holding time in your trade plan.
Please note on the chart:
* Linear regression channel shown from 2019
* Yellow dashed lines showing 370-470 trading range
* Light yellow rectangle shows two-year range which was recently broken higher
* White line (channel center) regularly acts as support or resistance, price is wavering along this line
* RSI only had one instance of going over 67 (white oval) or under 33 since 2019, and that resulted in sharp reversal, for now it is moving lower
* Stochastic %D has completed three peaks since dipping below 30 and is now turning down
Price was weak on Monday and closed lower, but still in its recent range (sideway. I am looking at a few possibilities for trades:
* If the market rallies this week HUM may stay under the white line and selloff down to 457, 435
* If the anticipated October leg down occurs, then price may move up to analysts' 550 price target (also top of channel)
* Price has been sideways for two weeks, so it should move higher/lower soon
