AUDUSD midweek sell updateAUDUSD provided this really great sell opportunity. I hope whoever was trading AU caught a similar move and if you didn't, I hope this video can give you some perspective! AUDUSD was trading in a range. Price wasn't ready to go longer on Monday. Tuesday gave it some fuel to go even higher. AKA right into the discount zone of the AU range. I marked out some selling areas such as the imbalance and Friday highs to look out for CLEAR rejection, that price won't be going higher. then a dump! perfect for an entry when the dump is happening. or placing the trade on the nearby OB that was around 6 pips away. the reason I showed both scenarios is it really depends on the pair and its movement on where you'll take the trade. sometimes the dump can be of 20-30 pips. and I don't take trade with such a huge SL cuz its unlikely to satisfy my min RR (for my strategy). Hence, I would place a sell limit on the OB of the sell off instead to secure a better RR. sometimes, that can mean missing out on the move. and that's ok. the price DOESN'T ALWAYS return to the OB and that's the part and parcel of trading.
I hope this explanation made sense if you were watching! thank you !!!
Range


BTC short term analyze...rangeshello guys
Bitcoin is in a range and has hit more than 3 times both from the top and from the bottom, so there is a possibility of breaking this range.
On the other hand, in the lower time frame, it forms a smaller range, which is smaller than the previous range and is in the lower range of the larger range. It strengthens the possibility of failure from below.
I suggest you to wait for failure and do not enter the trade early
always do your own research.
If you have any questions, you can write it in comments below, and I will answer them.
And please don't forget to support this idea with your like and comment.

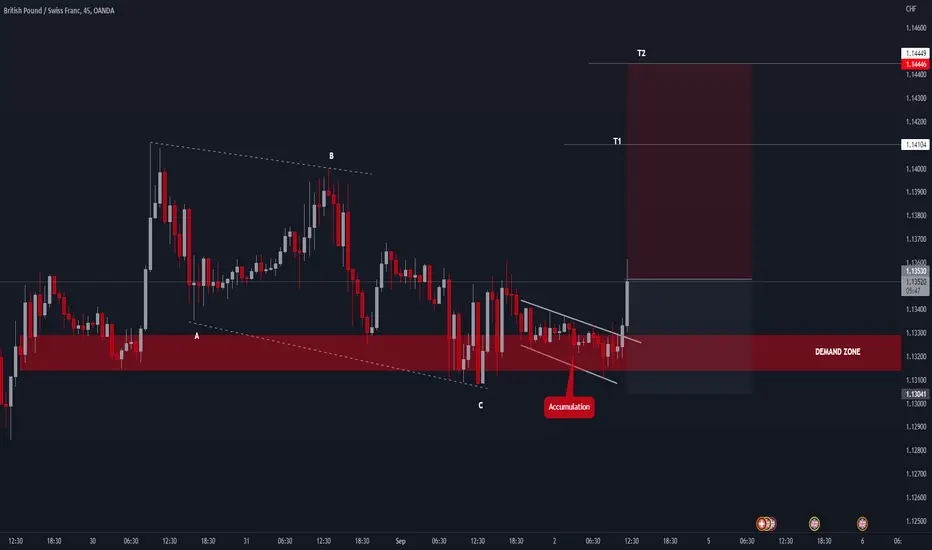
US OIL LONG Hello traders, in today's session I bought USOIL
the reasons
The presence of a strong bullish wave and a corrective wave that broke the bottom, so most of the time we get a wave similar to the strong wave
Reaching the price of the Demand area
Accumulation

Cryptocurrency getting ready to pump sin usdt
wave analysis
price action
range
break out
impulse wave
purification analysis

BITCOIN - MULTI YEAR ACCUMULATION RANGE?To stay this strucure of huge consolidation channel we need to keep uur current low and print stron higher low.
We have place to one more lego down just slightly below 19 k where bulls will have to absorb all the selling pressure.
If that holds I think we will have choppy month or longer even after breaking main trend line.

A quick Bitcoin scalp - three tap setupQuite an easy pattern to spot -commonly referred to as a Triple Top as well by some resources- and a very powerful one to trade (unless you are a breakout trader! 😁).
Both the bigger range and the smaller range have printed a swing point which got swept/deviated then retested.
I believe we target the equal lows at the bottom of the bigger range next.

Bitcoin Detailed Top-Down Analysis - Day 58Hello TradingView Family / Fellow Traders. This is Richard, as known as theSignalyst.
58 out of 500 days done.
I truly appreciate your continuous support everyone!
Let me know if you like the series, and if you would like me to change or add anything.
Always follow your trading plan regarding entry, risk management, and trade management.
Good Luck!.
All Strategies Are Good; If Managed Properly!
~Rich


NZD USD Analysis The impulsive wave is bearish, a correction is formed to continue the bearish wave
wave A and B formed. Now wave C has started. It may reach the range area, the correction ends and the downtrend continues.


EURGBP - potential setupsFX_IDC:EURGBP
Hello everyone!
🛎 Let check the trading idea for EURGBP
🤗 Not making anything difficult everything is pretty straightforward.
👉 1. Price goes ABOVE the selected range on the picture. Long positions to activate. 🟢
👉 2. Price goes BELOW the selected range. Short positions to activate. 🔴
----------------------------------------------------------------------------------------------------------------------------
⚠️ Important Notes:
1. Always follow your trading plan regarding entry, risk management, and trade management. ❗️❗️❗️
2. Timeframes: up to H4
----------------------------------------------------------------------------------------------------------------------------
😉 If you like the idea there was a like 🚀 and sign up so you can continue receiving great ideas like this one and also for us to make pattern the idea! 🤝
💪 Profitable lock for everyone! 🙏

USD/JPY Attracts More Buyers!Technically, the USD/JPY pair is positive as long as it remains above the R1 (138.20). Upside barriers are represented by R2 (138.90) and 139.07.
Additionally, the uptrend line functions as dynamic support; only a new lower low and a legitimate breakdown below this line might render the upward scenario incorrect and herald a bearish reversal.

BITCOIN brief gain in the range area 📖💡🚀Hello 🐋
Based on the chart, the price is in the rang phase close to the support area ✔️
so
for now, we expect to see brief gain for the price 👌🚀
and
our main focus for the support are
$18350 to $18780 areas 📖💡
after that
based on the Theter dominance and a good deal of other information from the chart, we will enter to the long or short position 📖💡🐋
Please, feel free to share your point of view, write it in the comments below, thanks 🐋

EUR/USD Range!The H1 chart shows that the pair only experienced a false breakdown below the pivot point of 0.9980, through the previous low, and now above the previous highs.
The weekly R1 (1.0070) is being challenged by EUR/USD, and it may soon reach the important level of 1.00900. If the price can't stay below parity, it might try to continue its upward trend.
Good Luck!


The Heiken Ashi Algo Oscillator (Range Trading technique)You're watching this video because you keep getting stop-hunted. You feel like every time you enter a trade to the market it immediately goes the other way and you get this little spike out the top or the bottom of a candle that knocks you out of your position and takes out your stop loss. This is most likely due to Market manipulation on your charts which is making you think that price is moving up or down and instead you have just entered a trade at the beginning of the consolidation or distribution phase. Don't worry you're not alone this happens to a lot of novice and intermediate Traders. I really wish there was an indicator that would tell you as soon as you have entered into a ranging Market but usually you can't tell that until you've looked at your charts for a couple of hours and realize that price hasn't moved above or below a certain number.
Well you're in luck because I just finished coating an indicator that will tell you that you have entered into a consolidation or distribution phase at the beginning.
In today's video I'm going to show you how to do range trading using the Heiken Ashi Algo Oscillator available for free on Tradingview.
Usually after price makes a big rally to the upside or to the downside you can expect that price is going to go into either consolidation or a distribution phase.
On your charts this will look like where price runs flat for what could be an extended period of time. The rule of thumb is that after a very strong move to the upside or downside the consolidation period can be lengthy. If there is a short rally to the upside or downside then the consolidation or distribution phase would be a short period of time.
So lets get into adding the indicator, and setting up your chart to trade in ranges using alerts from the Heiken Ashi Algo Oscillator.
Open up TradingView
Go to your indicators tab and search for Heiken Ashi Algo Oscillator and add it to your chart.
In the settings make sure you've turned on the following:
Range
Range Break Long
Range Break Short
Support Levels
Resistance Level
There are a number of other alerts available in the Oscillator but we don't need them for this purpose. And as always, use the default settings.
When you get a RANGE signal (Which looks like a line between two left and right arrows.) You want to grab your Parallel Channel Tool.
You should have already set your support and resistance levels when you opened your chart for the day so look left of your candle. There should be a support or resistance alert right there. On my chart I have a Resistance level.
So I'm going to use this line at the top of my parallel Channel
Take your parallel channel tool And place it on that support resistance level just left of the candle .
I'll drive it far to the right and make sure it's straight and click again.
now drag it down to the closest support level and click again.
You have just drawn your range.
Also on my chart you can see here that I have 1 range indication and then just after it I have a second range indication. When you get a second one you disregard the first one because price has now entered into a new range.
What you are looking at is the Centerline of your range. In this particular instance the first Range Line is lower than the second one so to correct this I have to take the top of my parallel Channel and drag it up until the dotted line is at the close of the candle with the new Range signal. do this by driving the top of the box and not changing the bottom of a box. In this case you can see how the bottom of the parallel channel is still sitting on my support and resistance level to the bottom but the top of the parallel Channel is above my support and resistance level And this is fine.
The way you use this is by imagining your parallel channel has three levels.
Level 1 = The top line
Level 2 = The midline
Level 3 = The bottom.
Also you must respect any Support and Resistance levels traveling THROUGH the Parallel Channel
What you are looking for is any candle that closes its majority size across one of these lines here are some examples:
Please watch the video for a perfect visualization of how to do this.
Directions of Trades in Range Trading. Follow the arrows.
You ONLY trade to the INSIDE from the top or bottom of the channel.
You also trade either up or down FROM the midline, depending on the majority close of the candle.
Again also respect your support or resistance levels when a candle is crossing them.

CHRUSDT rangebound CHR has been moving through the same range since mid may between the quadruple bottom at $0.15 all the way up to $0.285 separated into 4 quarters that can be traded between fairly reliably.
NOT FINANCIAL ADVICE


LINK/USDT LONG hello traders
The price is now at selling levels, but the behavior is buying, so the expectation is that the price will rise to the range area

