Range

ETH /USDT UPDATE I was sharing an analysis of Ethereum and I expected that a range would form in this area, if the price would reverse the first major correction, if the decline would continue, we got a range that is a signal to the upside to break the tops
Previous analysis can be found::


ETH/USDT ANALYSIS The price of Ethereum is now at a gathering area. It is not preferred to trade in these areas, but it is the key to the next movement. It is preferable to wait for a signal of reversal or continuation of the trend


GBPNZD I Trade Plan for THIS WEEK! Welcome back! Here's an analysis of this pair!
**GBPNZD - Listen to video!
We recommend that you keep this pair on your watchlist and enter when the entry criteria of your strategy is met.
Please support this idea with a LIKE and COMMENT if you find it useful and Click "Follow" on our profile if you'd like these trade ideas delivered straight to your email in the future.
Thanks for your continued support!
Brian & Kenya Horton, BK Forex Academy

USD-JPY Local Short! Sell!
Hello,Traders!
USD-JPY is trading in a range
Between the horizontal resistance
And the horizontal support
And now the pair is set to retest the resistance
From where a move down is likely
Sell!
Like, comment and subscribe to boost your trading!
See other ideas below too!

Buy the support - Range Strategy (+ 3000 points)Hey everyone,
I'm very happy to share with you my first chart posted on TradingView. This is a bullish setup on USOIL based on several elements that i've found through technical analysis. Usually the winning rate of this type of trade is around 70%, so if having a correct management of risk its a very profitable idea.
Buy Setup USOIL :
- price ranging between 90 and 120
bounce on important support
- Ema bounce
- bullish engulfing
aiming for 124 lvl

How To Trade Probability Ranges The Critical Rule of 1/3Using the Rule of Thirds to Master Probabilities in trading and investing ranges
--------------------------------------------------------------------------------
Stocks typically remaining in consolidation ranges 70% of the time while trending the remainder.
Using the rule of thirds, we can use statistics, prior price action and the probabilities of success to determine when to enter trades where the odds are stacked in our favor.
1) We start by finding a stock that is in a consolidation range, and identify the nearest important support and important resistance levels based on your targeted trading timeframe.
2 ) We take the range between the support and resistance levels and divide it into thirds, so we have three zones within the consolidation range.
3) When going long, you want to BUY the stock when it is within the bottom third or the zone from support to the 1st third level. Once you buy, your objectives are to hold during the middle third of the range, and sell during the top third.
When you buy in the first third, this gives you a 66 percent chance of success. If you buy in the second third of the range, you only have a 50/50 chance of success. Going long in the top third of the range, gives you only a 33% chance of success because you are already close to the resistance level.
When going short, the sequence and odds are reversed. You sell during the top third of the range, hold during the middle third and exit in the bottom third. This again gives you a 66% chance of success when you enter in the top third, 50/50 chance if you enter in the middle third, and a 33% chance of success if you enter in the bottom third as you are already close to the support zone.
****Using this simple trick, you can quickly evaluate trades based on probabilities and selectively enter trades where the odds of success are the highest and avoid likely losing trades. The rule of thirds also also gives you the confidence to continue to hold trades based on previous important ranges, and provides clear levels where the stock is likely to either reverse or start trending.
Hope It Helps to your Trading & Investing Success
Marc

Bitcoin in 1 Minute - Day 21Hello TradingView Family / Fellow Traders. This is Richard, as known as theSignalyst.
Quick Brief:
BTC is still stuck inside the red range and we are expecting a couple of days more inside it until we eventually break the range upward or downward.
Meanwhile, we will be trading the range, and we can clearly see that the range is getting contracted forming a symmetrical triangle which usually happens before an aggressive breakout happens.
But of course, a breakout of the symmetrical triangle would be an early alert and might result in a fakeout, the real breakout would be above or below the red horizontal range.
21 out of 500 days done.
I truly appreciate your continuous support everyone!
Let me know if you like the series, and if you would like me to change or add anything.
Always follow your trading plan regarding entry, risk management, and trade management.
Good Luck!.
All Strategies Are Good; If Managed Properly!
~Rich

NZDJPY Short Term Buy IdeaH4 - Currently it looks like the price is moving inside a range.
Price respected a key support zone and is bouncing higher.
Bullish divergence.
H1 - Bullish convergence.
Currently it looks like a pullback is happening.
Until the key support zone holds I expect the price to move higher further in the short term after pullbacks.


USDCAD might do wonders!!!no comment. At this time of the day, i do not expect such movement in price, but technically speaking this might be another sell setup, following the london open sell that occured in the morning.


EURUSDI set this up as a short on confirmation, reacting off of resistance. However it may also be setting up a range between 1.04633 and 1.03863. I think it could range there until midweek and by then a re-analysis would be necessary.
Scalpers will almost certainly have opportunities long to 1.04633.

JICPT| BTC is probably heading to $15500 for another range move!Hello everyone. There is a lot of news circulating in the crypto market, from the sudden crash of Terra luna to the 3AC liquidation. It seems buyers are reluctant to get in after 70%+ drop of BTC based on the volume market in the chart.
Where could it go?
It could be on the way to test $15500 by measured move. In the short term, I don't see any rebound happen soon as there is no huge volume and reversal candle patterns formed.
What do you think? Give me a like if you're with me.

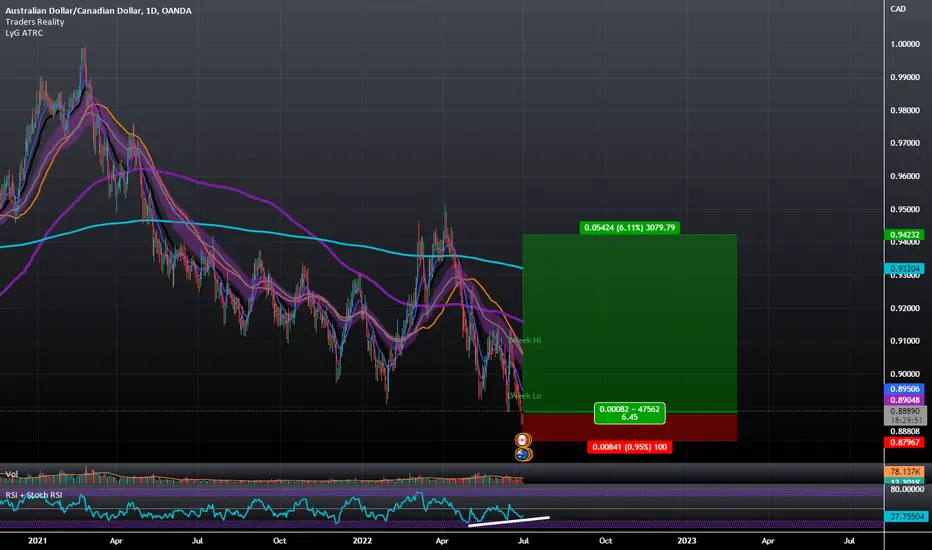
AUDCAD Daily Bullish Divergence within RangeDaily Triple Bullish Divergence on the RSI seems to be hinting towards a future scenario where the AUD will see a Bullish Rally against the CAD to the top portion of the range it's formed down here.
BTC what's gonna be?At this time I expect 2 scenarios:
Form a Cup and Handle Pattern and break the neckline.
Continue to Range and breaks the top of the TR.
That aside we have a gap of CME ~ 28000$ that soon or later will be filled.
Cm your opinion.

DAX Will Keep Falling! Sell!
Hello,Traders!
DAX is trading in a downtrend
And the index has been stuck in a range
For quite some time, but we are bearish biased
Thus, after the bearish breakout we will be expecting
The index to go further down
Sell!
Like, comment and subscribe to boost your trading!
See other ideas below too!
