ES Range Expectations on the CPI ReleaseToday we're again looking at ES e-mini futures for an expectation of the amount of range we could do on this CPI Inflation data release. We take a look at both the upside and downside to get a view on where the boundaries of normality would be to aid us in framing intraday trades.
Yesterday's PPI Inflation data gave us a large grinding day as we reverse some of those moves from the recent volatility. Lets see where we end up!
Range

Gold can rebound from seller zone and continue to fall in rangeHello traders, I want share with you my opinion about Gold. Looking at the chart, we can see how the price a few moments ago reached the support level, which coincided with the support area and also entered to wedge, where at once rebounded from the resistance line to the support line. After this movement, the price started to grow from the support line and soon reached the resistance line of the wedge pattern again, but then it fell back. Then price broke one more time at the 2360 level and exited from the wedge, after which started to trades inside the range. In the range, gold quickly rose to the top part, which coincided with the resistance level and seller zone. Price even entered to this area, but at once turned around and dropped to the 2360 level, after which repeated movement up to the seller zone. Next, XAU turned around again and fell almost to support level, after which in a short time backed up, but a not long time ago rolled down from the seller zone. So, in my opinion, Gold can enter to seller zone one more time and then continue to decline inside range. For this reason, I set my TP at 2400 points. Please share this idea with your friends and click Boost 🚀

12/08/24 Weekly outlookLast weeks high: $62,761.55
Last weeks low: 49,017.27
Midpoint: $55,889.41
Quite the week in crypto just gone. From our first sub $50,000 BTC since mid February thanks to the JPY rate hike , a single day decline of -16% on Monday to then a strong recovery of +28%, a lot of volatility.
The two peaks for the week coincide with the 4H 200EMA resistance level , which is a problem for the bulls as now that the final hours of Sunday trading dipped price below the 1D 200EMA , Bitcoin has a difficult week ahead to break back above those moving averages.
A big news event week coming up could continue the high volatility we've seen in recent weeks:
- US PPI 13th
- US & UK CPI 14th
- JPY & UK GDP 15th
For this week I will be looking closely at the news events that could cause volatility and perhaps give a sign of trend direction going into the September FED rate cut .

Euro can leave pennant and continue to decline nextHello traders, I want share with you my opinion about Euro. Looking at the chart, we can see how the price some time ago started to trades inside range and at once reached the top part, after which started to decline. The price quickly fell to the 1.0815 support level, which coincided with the buyer zone, and some time traded between this level. After this, the Euro dropped lower 1.0815 level, breaking it, and also exited from the range, after which the price entered to upward pennant. In this pattern, EUR at once made a strong upward impulse from the support line to the resistance level, breaking the 1.0815 support level one more time. Next, the price broke the 1.0930 level, which coincided with the seller zone, and rose until to resistance line of the pennant, after which turned around and in a short time declined lower than the 1.0930 level, breaking it again. After this, the EUR tried to rise back, but when it entered to seller zone, it made a correction movement to support line of the pennant pattern. But a few moments ago it rebounded from this line and at the moment EUR trades near the resistance line. So, I think that the price can fall to the support line, after which bounces up to the resistance line and then continues to decline, exiting from the upward pennant as well. Therefore I set my TP at 1.0850 points. Please share this idea with your friends and click Boost 🚀

Bitcoin can exit from pennant and continue to grow to 63K pointsHello traders, I want share with you my opinion about Bitcoin. Observing the chart, we can see that the price some time traded in the range, where it fell to the resistance level, which coincided with the seller zone, and then rebounded up to the top part of the range. Then BTC turned around and dropped lower than the 66700 level, breaking it and some time traded in the seller zone. Later price continued to decline inside the downward pennant, and fell until to the 55000 support level, which coincided with the buyer zone and even broke this level. Next, BTC fell to the support line of the pennant, turned around, and in a short time rose to the 55000 level, broke it again, and continued to grow. But a not long time ago it made a correction to the support line of the pennant and then rebounded up to almost the resistance line, where at the moment continues to trades near. In my opinion, Bitcoin can make small movement down and then rebound up, higher than the resistance line, exiting from the pennant pattern. For this case, I set my TP at 63000 points. Please share this idea with your friends and click Boost 🚀

Believe it or not, Bitcoin is still in the gameDespite Bitcoin showing a bear market in recent days, it remains within a range and fluctuating within a demand zone. Our point of interest is still very high, but still valid for the price to take a break before the jump. if you can look the general structure, we can see that where I marked the green circle, there is a lot of buying pressure. This is also an area of interest that I had marked as a potential rebound point. We will see what happens in the coming days.
Thank you for your support.
-Mike

Bitcoin can continue to decline inside downward channel to $58KHello traders, I want share with you my opinion about Bitcoin. By observing the chart, we can see that the price entered to the range, where it soon reached the 68300 resistance level, which coincided with the seller zone with the top part of the range and then started to decline. In a short time, the price fell to the bottom part of the range, which coincided with the current resistance level, and at once turned around and quickly rose to the 68300 level. Then BTC exited from range and even rose a little higher than the 68300 level, but soon made a correction below, after which in a short time rose back. Next, the price turned around and started to decline inside the downward channel, where firstly it broke the 68300 level and later declined to the 64000 level. Soon, BTC broke this level too and fell to the support line of the channel, but a not long time ago it rebounded and started to grow. So, in my opinion, BTC can make a small movement up and then continue to decline inside the downward channel. For this case, I set my TP at 58000 points, which coincides with the support line of the channel. Please share this idea with your friends and click Boost 🚀

TONUSDT. Looking for sales opportunityHi traders and investors!
It might be time to open short positions on TON.
Daily Timeframe Analysis
On the daily timeframe, the price has formed a sideways movement. The buyer's vector 4-5 has reached all its targets. Yesterday, the seller brought the price back into the range, and the daily candle closed below the upper boundary of the range at 7.675. Additionally, a seller's zone has formed at the upper boundary of the range (red rectangle on the chart). The lower boundary of the range is at 4.5983. The current seller's vector 5-6 has a potential target of 5.18. The nearest obstacles are 6.58 and 5.9777.
Hourly Timeframe Analysis
On the hourly timeframe, there is a downtrend. The last selling impulse started from the level of 7.5862. This level also serves as the seller's defense of the breakout from the range on the hourly timeframe (marked as RPL on the chart). Currently, the price has interacted with the 50% level of the last selling impulse (7.2243) but has not been able to overcome it so far.
Selling Strategy
It is reasonable to look for selling opportunities based on the idea of realizing the seller's vector 5-6 in the range on the daily timeframe. Possible levels to look for sales if defended by the seller include 7.5862 (hourly timeframe) and 7.675 (daily timeframe).
Alternatively, after a new selling impulse appears on the hourly timeframe, identify the seller's areas of interest and look for selling opportunities from the defense of these areas.

Bitcoin Testing and Testing Demand ZoneBitcoin is once again seeking to fall into our equilibrium zone (purple zone). Bitcoin has tested this zone several times, and if we look at the overall structure, Bitcoin continues to bounce within a range.
Our plan remains in place. Remember that markets need to make pauses or retests before taking action. Additionally, we must consider that markets, in general, have been bearish—we are in a bear market. However, the points of interest I have marked are based on historical prices and significant liquidity, so we can expect aggressive movements once the price reaches the indicated zones.
Thank you for your support, and don't fear these bear markets; on the contrary, we should average in and take advantage of the opportunities they offer us.

pepe → tiny correctionhello guys!
Chart Overview:
- after the price made a symmetrical triangle, it broke the top line
- it is forming a range or rectangle right now!
Trend Analysis:
- Pepe is in compression now
- we can consider an upcoming downward!
Price Patterns:
- There are two potential correction zones within the rising trend:
1. Around the $0.0000107 level.
2. Between 0.0000099 and $0.0000094.
Bullish Trend Confirmation:
- if the range area breaks down it will confirm the downward movement
✎Actionable Insights:
- you can take a risk and enter the short position right now and put two previous area as a target!
- or you can wait until the range breaks down then get a short position until the blue area will be touched!
___________________________
✓✓✓ Always do your research.
❒❒❒ If you have any questions, you can write them in the comments below, and I will answer them.
❤︎ ❤︎ ❤︎And please don't forget to support this idea with your likes and comment

High probable GBPUSD Trade for NFP [02/August/2024]We are expecting Bullish Move for FX:GBPUSD
Best NFP Trade for FX:GBPUSD
Today is : 02/August/2024

GOLD → Retest resistance before a breakout. What's next?FX:XAUUSD has been strengthening since the opening of the session and is testing the 2400 zone. The market is getting bullish again, but at the same time it is at a strong resistance. The focus is on 2393.0.
There is no news today and the overall situation is stable. Gold has no obvious reasons for a possible strong fall. Markets are waiting for the confirmation of the progression of US deflation with the subsequent hints on the soon reduction of interest rates. The fact itself is favorable for gold.
Technically, the focus is on the edge of the range 2393. Consolidation of the price above this area may well influence further growth, but it is necessary to follow the descending resistance, because it will be difficult to pass this area from the first time.
Resistance levels: 2400, 2430
Support levels: 2393, 2384, 2377
Technically and fundamentally everything is quite positive. We should expect a retest of resistance with subsequent growth, but it is not excluded that before the active recovery phase there may be a retest of support, for example: 2387, 2382 or 2377
Rate, share your opinion and questions, let's discuss what's going on with ★GOLD ;)
Regards R. Linda!

XAUUSD 28/7/24This week, we are looking at some great potential moves in gold. At first glance, it may seem like we have no plans to buy, but we have a much stronger bias for long positions than short ones. The key point is that until we have a clear structural narrative, we simply follow what we see, which currently indicates short moves.
We have a clear sign of momentum on the daily timeframe, leading us to think the pullback could continue and go lower into some more key areas. In terms of price moving lower from its current position, we have identified some clean-cut zones of supply to watch. These zones are marked out above the current price. The first zone is the candle responsible for the run of the last major low and the order block that caused a minor reaction, ultimately inducing buys into failing positions.
You can see the trend line we have highlighted, indicating the current trajectory for price action. If this trajectory continues, the higher areas of supply might not be tapped into. However, we are looking for a longer move here if the price allows it. Watch the zones above if the price starts to rise.
My main move to watch is running the liquidity low above our demand zone and then shifting up, giving us a clear bullish move into the daily high liquidity target. If we turn bullish, this target will be taken. Until we hit either the supply or demand zones, we have nothing to do except wait.
Trade safe and follow your rules.

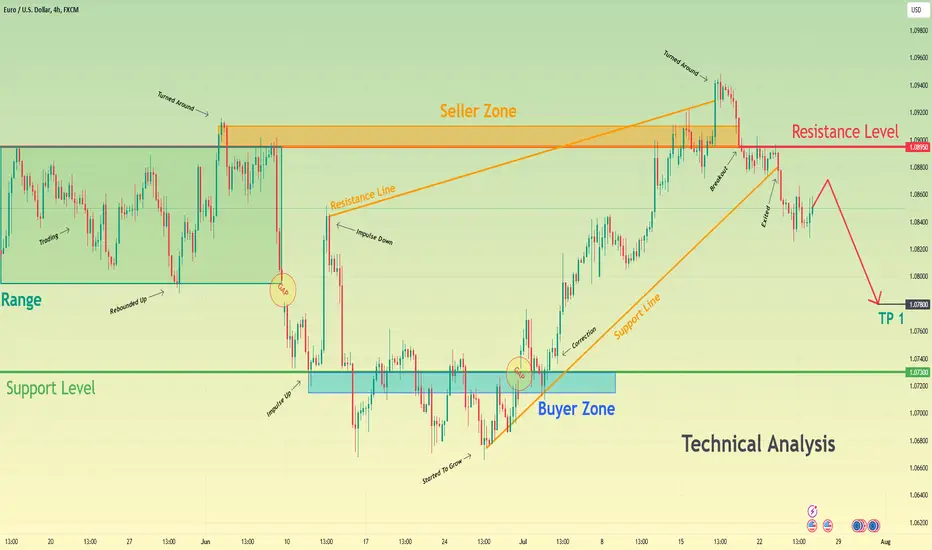
After exiting from wedge, Euro can continue to decline to 1.0780Hello traders, I want share with you my opinion about Euro. Observing the chart, we can see that the price some days ago entered to range, where it reached the top part, which coincided with the resistance level also and then started to decline. After the price dropped to almost the bottom part of the range, it turned around and rose until the seller zone, where it turned around and made a downward impulse to the support level, which coincided with the buyer zone, exiting from the range and making the first gap. After this, the Euro rebounded up from the 1.0730 level and entered to wedge, where it turned around and dropped from the resistance line to the support line, breaking the support level. Then price in a short time rose higher this level, breaking it and making a second gap, after which quickly rose to the resistance level. Next, the price broke this level and rose to the resistance line, after which EUR exited from the wedge, turned around, and dropped to the support line, breaking the 1.0895 level. Recently price also exited from the wedge and now continues to decline, so, in my opinion, the price can make a small movement up and then continue to fall. For this reason, I set my TP at 1.0780 points. Please share this idea with your friends and click Boost 🚀
HelenP. I Bitcoin can start to rise and break trend lineHi folks today I'm prepared for you Bitcoin analytics. Some time ago, the price rose to support 1, which coincided with the support zone, and then rebounded and fell to support 2. Soon, BTC broke this level too and fell even lower than the support zone, but later price backed up and some time traded near support 2. Next, BTC declined to the trend line, after which it turned around and started to grow. In a short time, the price rose higher than support 2, but then made a correction to this level, after which continued to grow. Then Bitcoin reached support 1, and broke it, after which started to trades inside consolidation, where it firstly made a correction to the support level and then rebounded up to the top part of the range. After this, the price some time traded near the top part and a not long time ago dropped to a support level, breaking the trend line. Just now, BTC continues to trades near the support level, so, I expect that BTCUSDT will fall to the support zone and then rebound up, higher than the trend line, breaking it and continuing to move up. For this case, I set my goal at 67000 points. If you like my analytics you may support me with your like/comment ❤️

GOLD → False break of bullish range support ↑FX:XAUUSD is forming a false breakdown of the previously mentioned range - 2390 - 2400. The return to the buying zone is forming, buyers can push the price to 2450
A reversal swing pattern is forming in relation to the support, which is evidence of buyers' strength. The fundamental background is still unstable, there are many nuances from the Fed and the US presidential race, the geopolitical background in the Middle East and Eastern Europe is relatively stable. Today there is no news and in general we can bet on the work of technical analysis.
Technically, if the bulls hold the defense above 2400-2405, then in the medium term we should expect an upward movement towards local liquidity zones as well as towards the upper boundary of the range.
Resistance levels: 2405, 2412, 2420
Support levels: 2400, 2392
The market confirms the presence of the range, it is not excluded that the price may go down, but at the moment the situation looks like the bulls are actively defending the lower boundary of the range, which determines the short-term and medium-term prospects....
Rate, share your opinion and questions, let's discuss what's going on with ★ GOLD ;)
Regards R. Linda!

THE OPEN NETWORK (TON 4H) The Open Network (TON) is designed as a distributed supercomputer, or “superserver,” intended to provide a variety of products and services to contribute to the development of the decentralized vision for the new internet. A decentralized and open internet, created by the community using a technology designed by Telegram. With an increasing TVL and a growing ecosystem the future looks good for TON.
The TON chart is a very interesting one. Over the last few month it has performed very well despite the overall market conditions.
A near 300% increase since FEB compared to 45% for BTC, and has maintained most of its gains when compared to other altcoins.
The TONBTC chart is one of the strongest out there, massively outperforming BTC in the recent months to maintain a bullish trend.
Both BTC & USDT pairs are above the 4H 200 EMA.
CERTIK top 10 on every category ( Fundamental 80, Operational 92.19, Governance 94.73, Market 95.94, Community 95.38, Code 97.31).
My trade idea based on these points is simple:
- Flipping the 4H 200 EMA as support.
- Flipping the range MIDPOINT as support.
- Respecting the diagonal support trendline.
- After breaking out of the bearish trendline, now retesting it as support.
-The STOP LOSS comes into play once all of the above areas of support and confluence are broken, the trade is obviously invalid at this level once losing market structure, range midpoint & Key S/R level.
The overall trade R:R I feel is good at this point purely because of the clear support areas at this level. I think a lot of this trade will require BTC to behave and continue its recovery, it may be bearish for the BTC pair but not the Stable pair.

GOLD → Retest of the liquidity area in front of the bullrun ↑ FX:XAUUSD in the correction phase. The market is testing the support and liquidity zone within the counter-trend correction. The dollar may continue its downward phase, which would be a bullish leverage for the gold market
In the week ahead it is worth paying attention to the S&P PMI to be released on Wednesday, GDP and Initial Jobless Claims on Thursday and PCE on Friday.
Trump, as the presidential race progresses, has a growing chance of winning. If that happens, gold and cryptocurrencies will benefit on that backdrop. There is not much news today, so gold may test the liquidity area hiding behind 2390-2400. It is also worth paying attention to the new range of 2492 - 2390. Accordingly, if the bulls hold the defense above the lower boundary of this range, we will get a new trading plane.
Resistance levels: 2411, 2420, 2430
Support levels: 2392, 2386
When trading gold, I recommend to always pay attention to the behavior of the dollar index, as it plays the main role in the market. Accordingly, if the dollar will begin to decline to the support with the purpose of breakthrough, in this case we should expect further growth in the gold market
Rate, share your opinion and questions, let's discuss what's going on with ★ GOLD ;)
Regards R. Linda!

HelenP. I Euro can rebound up from support zone to $1.0915Hi folks today I'm prepared for you Euro analytics. If we look at the chart we can see how the price reached support 2, which coincided with the support zone and soon broke this level. After this movement, the price tried to grow but failed, made the first gap, and fell to support 2, which coincided with the trend line. Then Euro turned around and in a short time rose higher than support 1, which coincided with one more support zone, after which fell to this area, and some time traded inside. Later price broke support 1, and entered to consolidation, where it made a second gap and then made a correction to the support level. After this, the EUR rebounded up to the top part of the range and then turned around and dropped to the support level, thereby breaking the trend line. Now price continues to trades near this level to this day and I expect that EURUSD will rebound up from the support zone to the trend line, That's why I set my goal at 1.0915 points, which coincided with this line. If you like my analytics you may support me with your like/comment ❤️

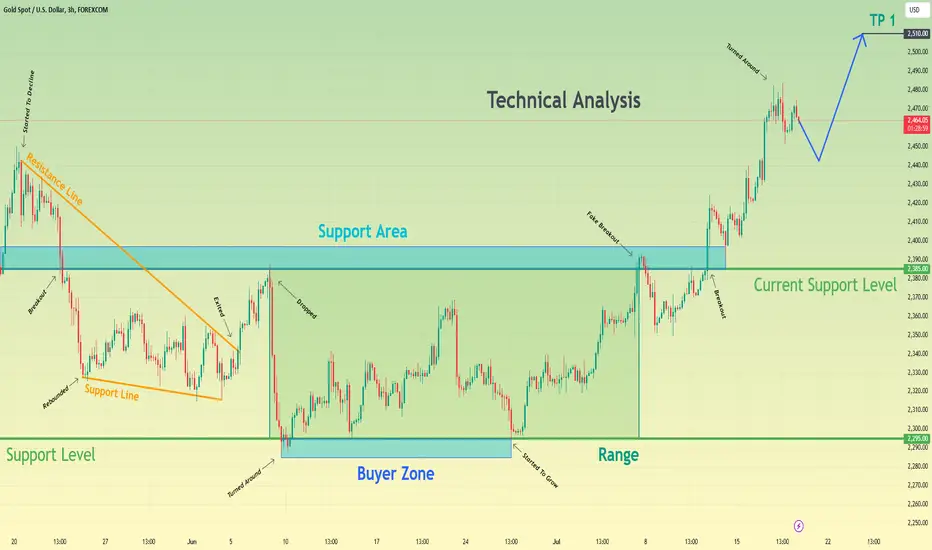
After impulse up, Gold can small correct and continues to riseHello traders, I want share with you my opinion about Gold. By observing the chart, we can see that the price rebounded from the current support level, which coincided with the support area, and then entered to wedge, when it turned around from the resistance line and started to decline. In a short time, the price fell to the support line of the wedge, breaking the 2385 level. Then the price rebounded from the support line and continued to decline in the wedge and some time later it turned around and made impulse up to the current support level, thereby exiting from the wedge, after which dropped to the 2295 level and started to trades inside the range. In range, Gold tried to grow from the 2295 level, but later it fell back, after which at once started to grow to the current support level. When the price reached the 2385 level, it exited from range and made a fake breakout of the 2385 support level. After this movement, Gold made a strong impulse, thereby finally breaking the 2385 level and rising to 2483 points, but recently started to decline. So, I think that Gold can make small correction firstly and then continue to move up. For this case, I set my TP at 2510 points. Please share this idea with your friends and click Boost 🚀
BTCUSDT. What would increase the likelihood of a new ATH?If the seller reaches the range of 54,000-55,000 (taking liquidity below 59000), and the buyer returns the price back into sideways movement (above 59,000), then the likelihood of seeing new buyer momentum with a new maximum significantly increase.

ES Range Expectation for PPI and the Friday SessionToday we're looking at ES e-mini futures for an expectation of the amount of range we could do. We take a look at both the upside and downside to get a view on where the boundaries of normality would be to aid us in framing intraday trades.
Yesterday's CPI Inflation data provided us with the 2nd large range day in a row (big range days tend to cluster) and today we're about to get the PPI data that usually follows the day after but is a bit more forward looking on inflation expectations. In short it could be another catalyst for another large range day.

Dow Jones Dollar Index daily TF The Dow Jones has exhibited a bearish trend for the past nine days, following a break from its bullish channel. Historically, during its last two bullish channel periods, the index experienced a bearish phase lasting 7 to 8 days before finding support and moving higher. I anticipate a similar pattern this time, expecting the index to reach one of my areas of interest before initiating a downward swing. Once it undergoes a healthy pullback and begins to decline, a close below 12,963 will signal a significantly bearish outlook.
