EURJPY LOOKING FOR A PUSH INTO 126.000The 124.750 highlighted region is looking to give way relatively soon. On Friday we saw a breakout of the counter trendline followed by a retest which managed to hold back above, currently the top highlighted region is providing some strong resistance however, once we do see a strong push to the upside the probability of pushing higher into the target region of 126.000 is highly likely.
Confirmations on the 8hr and Daily timeframe are needed in order to enter the market. The moving averages are crossed over to the upside and continuing to provide dynamic support for the Euro .
Great risk/reward ratio of 1:1.87 once all technical factors fall into place.
Rangebreakout

GBP/CHF: Swing-Setup! What a CHANCE after this Breakout!#BullsHey tradomaniacs,
welcome to another free signal!
Important: Wait for a confirmed S&R-Flip aka. a bounce of the Range @ 1,26 and place a Buy-Stop!
-----------------------------
Type: Swingtrade
Buy-Stop: 1,26146
Stop-Loss: 1,24941
Target 1: 1,15990
Target 1: 1,27470
Targt 2: 1,28
Target 3: 1,291
-----------------------------
LEAVE A LIKE AND A COMMENT - I appreciate every support! =)
Peace and good trades
Irasor
Wanna see more? Don`t forget to follow me.
Any questions? PM me. :-)

GBP/USD: Swing-Setup! Range-Breakout with a great opportunity!Hey tradomaniacs,
welcome to another free signal!
Important: Wait for the retracement down to the trendline and wait for a trigger!
-----------------------------
Type: Swingtrade
Buy-Limit: 1,27110
Stop-Loss: 1,26155
Target 1: 1,284
Target 2: 1,29
Targt 3: 1,29508
-----------------------------
LEAVE A LIKE AND A COMMENT - I appreciate every support! =)
Peace and good trades
Irasor
Wanna see more? Don`t forget to follow me.
Any questions? PM me. :-)

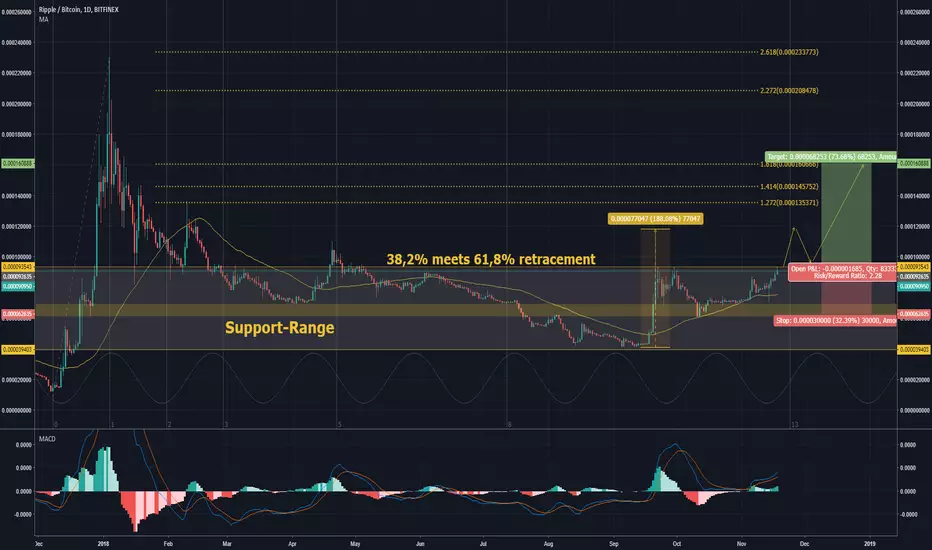
RIPPLE: the new king of cryptomania? Beautiful BUY-CHANCE!Hey tradomaniacs,
welcome to another signal!
Important: Wait for the Breakout and buy the retracement!
Type: Swingtrade
Buy-Limit: 0,0001
Stop-Loss: 0,000062635
Target 1: 0,00014
Target 2: 0,000160888
Peace and good trades
Irasor
Trading2ez
Wanna see more? Don`t forget to follow me.
Any questions? PM me. :-)
GBPUSD 4H RANGE TRADE HITS EXTENDED TPThis is a range trading/breakout training example
GBPUSD falls to bottom of range
Bearish range bottom breakout
Sell Stop @ 1.3065
Sell Take Profit @ 1.3015 = 50 pip profit
Macd confirmed direction

EURAUD 4H RANGE TRADESPrice was at top of range
Price fell from top of range
May retest top of range
Range breakout long
Buy Stop @ 1.6360
If price falls back towards ma's
Sell Stop @ 1.6045
Sell Take Profit @ 1.5935
Watch Macd for direction
Find a SL

GBPUSD 4H RANGE TRADESPrice at top of range
Price failed to break above the 100 sma and range top
Macd over bought
Short bias
Long trade if breakout range top
Short trade
Sell Stop @ 1.3090
Sell Take Profit @ 1.3005
Watch Mace to cross below Red signal Macd line and zero level

EURUSD 4H RANGE TRADESPair may be in a Bearish continuation breakout
Support levels shown
Sell Stop @ 1.1599
Sell Take Profit 1 @ 1.1586
Sell Take Profit 2 @ 1.1552
Place your own SL
Bearish continuation may fail
Price will move back into range
Buy Stop @ 1.1635
But Take Profit @ 1.1675
Place your own SL

USDCAD 4H RANGE BREAKOUT TRADEPair has broke out of the bottom range
Sell Stop @ 1.2990
1st Take Profit @ 1.2940
2nd Take Profit @ 1.2905
SL @ 1.3035

QTUM/DOLLAR 2H DARVA BOX STRATEGYStep #1: Identify at least two Darvas boxes that are on top of each other
The first trading rule is to let the market develop at least two Darvas Boxes. Basically, the two Darvas boxes are showing that the market is starting to move in steps to the downside. So at this point, the market also should be making lower highs followed by lower lows, which is the basic definition of an downtrend.
In the real world, you’ll notice that the Darvas boxes don’t perfectly stack on top of each other. You’ll rarely find a series of Darvas boxes where the following box has the bottom perfectly aligned with the top/bottom of the previous box.
You will notice that the price range of the second Darvas box can move into the space of the first Darvas box which still qualify for a valid Darvas box.
Note* Big candle wicks are ignored when drawing the Darvas box. Use the closing price instead.
Step #2: Draw a support line in the middle of the first Darvas box
We’ve noted that there is no such thing as perfection when dealing with the price action. And since the Darvas boxes tend to overlap, another characteristic is that in most of the cases the top/bottom of the current box won’t exceed the middle of the previous Darvas box.
In this case, we can anticipate that the third Darvas box will develop its top around the middle or bottom of the second Darvas box.
Step #3: How to sell QTUM: Sell when we test the middle or bottom of the 2nd Darvas Box
We want to buy low and sell high because that’s the rule number one to make consistent profits.
We sell QTUM as soon as the middle or bottom of the 2nd Darvas box is tested this will ensure that we sell on a retracement in an already proven downtrend.
Step #4: Place your protective Stop Loss above resistance level in the second Darvas Box
Our improved cryptocurrency sell strategy comes with the advantage of providing us with a very tight stop loss. We can hide our protective stop loss within or above the second Darvas box.
A break above the second Darvas box will invalidate the whole price structure and it’s wise to get out of the trade as soon as possible.
Two things can measure the success of a trading strategy.
First, how tight the stop loss is and secondly the stop loss placement needs to be logical not just a random price coming out from over-optimization.
Step #5: Take profit needs to be 2 or 3 times more than your stop loss
Opening a trade is just the beginning; you also need an exit strategy to maximize your profits. It’s often said that it’s more important where you take profits than your entry strategy
The professional traders place more weight and attention on the exit strategy because that’s how they make money. Probably, this is one of the oldest trading secrets that smart money doesn’t want you to know.
Note** the above was an example of a SELL trade using the Free QTUM cryptocurrency strategy. Use the same rules for a BUY trade – but in reverse.

DASH SPIKE & LEDGE REVERSAL CRYPTO STRATEGYStep #1: Dash cryptocurrency price needs to show a steady rise that suddenly accelerates to the upside.
When this reversal pattern is complete, it will resemble a cup with a sharp bottom.
This sharp acceleration usually is the last stage of a bull cryptocurrency market, and it’s followed by a sharp reversal if all the trading criteria for a valid Spike and Ledge are met.
In technical analysis, professional traders also refer to this last spike as being an exhaustion reversal bar that has a high probability of signaling a reversal in the Dash price.
Now, before we can trade successfully, we need to understand that this key climax reversal bar needs to follow specific trading rules.
More specifically, this exhaustion reversal bar needs to follow three rules, which we’re going to highlight next.
Step #2: The exhaustion reversal bar needs to be bigger than the previous bar
Relatively speaking the exhaustion bar, which should be the last bar within the downtrend, needs to be bigger than the previous bars. However, this is not mandatory.
Ideally, the bigger the climax bar is in comparison with the other bars within the bullish trend, the more profitable the reversal pattern becomes.
Step #3: The climax bar needs to develop at a key sup/res level or after breaking a key swing low/high
We can’t stress enough the importance of location in trading.
Many times you’ll notice that a chart pattern will fail, but that’s not because that price pattern has stopped working. It’s often the case that you don’t have the patience for these patterns to develop at the right location.
In order for the Dash cryptocurrency trading strategy to work we need to wait for the exhaustion bar to show up at the right location.
Step #4: The exhaustion bar develops after several bullish impulsive bars
We need to make sure that the exhaustion bar occurs after several bullish impulsive bars.
These impulsive bullish bars will make the appearance of a bullish trend that will trap many sellers once the tide turns. And that’s how retail traders trade the markets, but to trade profitably, you need to trade against the retail mindset.
Step #5: After the upward spike, wait for the market to enter into a short period of consolidation or channeling.
Usually, after the Dash cryptocurrency price had that last spike up the market will take a pause to digest the recent move, and it will start moving into a short period of consolidation or channeling.
Simply, draw two parallel lines to contain this price range.
Now, this is what we refer to as being the “Ledge.”
The Spike and Ledge reversal pattern satisfies all trading conditions outlined above which mean that we can move forward and describe how to sell Dash coin.
Step #6: Sell Dash coin when we break below the Ledge
A short trade is entered on the breakout of the Ledge.
This is an easy entry method, but in order to avoid the short-term noise and the usual false breakouts, we need also to wait for the breakout candle to close below the Ledge.
Step #7: Place your protective Stop Loss above the Exhaustion bar
The initial protective stop loss is placed on the other side of the reversal pattern.
You hide your stop loss above the exhaustion bar.
Step #8: Your Take Profit needs to be two or three times bigger than your risk aka your stop loss.
As a general rule, you do want your take profit to be bigger than your stop loss. This is very important to your long-term survival in this business.
However, you can achieve your profit target goals by using your preferred strategy when it comes to exit the market. We encourage you to experiment different exit strategies and see which one yields better results.
Note** the above was an example of a SELL trade using our favorite Dash strategy. Use the same rules for a BUY trade – but in reverse.
PM me if you want to read the complete strategy

ETHEREUM CLASSIC CRYPTO REVERSAL STRATEGYStep #1: Identify a clear trading range zone followed by a breakout above the resistance level.
The principal idea behind the Fakeout – Shakeout reversal pattern is that we’re looking for an area of consolidation or range trading followed by a false breakout that is QUICKLY sold by the institutional money.
A trading range is defined by price moving back and forth between clear support and resistance levels.
A valid Fakeout only needs enough bullish momentum so we can break above the trading range.
Step #2: Identify the starting point of the Fakeout movement.
What we’re looking to do next is to just wait for the buy off to fail.
The way we’re going to know that this is a false breakout is if the market starts recovering and breaking below the starting point of the buy-off.
Simply, mark on the Ethereum Classic chart the bullish candle that started the buy off. It doesn’t necessarily have to be the first bullish candle. What we look for is for the most prominent bullish candle within the upward movement.
The critical thing to watch is for the Ethereum Classic price to recover fast and not spend too much time on the upside.
Note* The stronger and faster the recovery happens, the stronger the reversal pattern becomes.
A legitimate breakout should not retrace so deep. If it does, according to our amazing reversal pattern, it signals that this was a false breakout and a bull trap.
The Fakeout – Shakeout reversal pattern satisfies both of our trading conditions which mean that we can move forward and outline what the trigger condition for our Ethereum classic cryptocurrency strategy.
Step #3: Place a sell stop order below the candle’s high identified at Step #2
The best entry technique to use when purchasing Ethereum Classic is to closely monitor the charts right when the expected reversal is occurring. You must focus first on identifying the starting point of the fakeout movement.
The fakeout movement is designed to fool traders into believing the market will go up when the real intention of the smart money is to really move the market down.
This type of fakeouts happens all the time in any market and on all time frames.
This entry strategy has only a very small window of opportunity, so you want to make sure you’re ready to pull the trigger when the trade signals show up.
We refer to this recovery as the Shakeout phase. The buyers who got caught on the wrong foot and got tricked are about to be taken out, which in turn will fuel more the downside.
Step #4: Place your protective Stop Loss above the “Fakeout high”
You also need to concentrate on seeing the logical places where to hide your protective stop loss.
Trading without a stop loss is a receipt for disaster, so always use an SL.
The initial stop loss is placed at the swing high developed during the Fakeout – Shakeout phase.
Step #5: Take Profits when the bearish momentum fades away
The easiest way to take profits is to wait until the rally starts losing the bearish momentum.
The simplest way to gauge when the bearish momentum fades away, is when the price either starts to consolidate again or when big bold bullish candle start to develop on the Ethereum Classic chart.
Alternatively, you can trail your stop loss and enjoy the opportunity to potentially make bigger cryptocurrency profits. You have to monitor new swing high points as they are formed and then just trail your protective stop loss above these swing points.
Note** the above was an example of a SELL trade using the Ethereum Classic beginner’s guide. Use the same rules for a BUY trade – but in reverse.
PM me if you want to read the complete strategy.

GBPUSD 4H BREAKOUT SHORTPair has broken out of range box.
Sell Stop @ 1.3380
1st Take profit @ 1.3305
Price may have a bullish bounce here
2nd Take Profit @ 1.3205

AUD EMPLOYMENT NEWS TRADEAUD Employment News is coming our today at 9:30 pm EDT
If AUD weakens then price may fall back to the 50 sma
Sell Stop and Take Profit shown on chart

DOUBLE RANGE XRPUSD RIPPLE2H RANGE - Price at bottom of range
15M RANGE - Bearish Breakout
Sell Stop @ .7870
Take Profit @ .7640

EURUSD: Range breakout, LONGPrice broke out of the channel with a strong green bullish bar! Momentum shifted to the upside for now. I closed my short positions and I’m starting to enter long positions from here.
Watch price action closely to draw new support and resistance areas and trendlines to know where price is at to manage your risk.

USDCAD 4H SHORT RANGE BREAKOUTPrice has been in a range
Price broke bullish out of range but failed and returned back into range
Price approaching range bottom for possible bearish breakout
Range bottom @ 1.2820
Sell Stop @ 1.2815
Take Profit @ 1.2775

EURJPY 4H RANGE BEARISH BREAKOUTPrice had bearish breakout
Re-entry with Sell Limit @ 131.80
Re-entry with Sell Stop @ 131.55
Take Profit @ 131.00
Be prepared if price re-enters the range for long trade to 50 sma
Watch Macd for direction

USDCAD 1H RANGE TRADE SETUP FOR NFPPair has been in a range for awhile
NFP News is tomorrow morning which should help price breakout of range
Long Trade
Buy Stop @ 1.2933
Buy Take Profit @ 1.3000
Sell Trade
Sell Stop @ 1.2795
Sell Take Profit @ 1.2735
***This information is not a recommendation to buy or sell. It is to be used for educational purposes only.***

GBPUSD 4H SHORT TRADENFP may not effect this pair too much
If price goes up from here Sell Limit @ 1.8165
If price continues to drop Sell Stop @ 1.8025
Take Profit is @ 1.7925
Stop loss @ 1.8231
Or if Macd crosses above Red signal line
Also you can exit early at 1.8115

USDCAD 4H RANGE TRADESPair has been in a consolidation pattern above the 50 sma.
Buy stop @ 1.2918 if prices pushed for a higher high in the up trending pattern
Long Take Profit @ 1.2995
Sell Stop @ 1.2795 if price drops below the 50 sma
Sell Take Profit @ 1.2730
I will follow the Macd for a stop loss either direction.
If Macd crosses either the Red Signal Line or the Zero level line against open trade
Or a hard stop of 26 pips above/below the candle that opens your trade

1 year base breakout SSW looking to breakout from 1 year base on a 10% short float with big volume. Some value here too trading at half its book value of 14.33 and with a price/earnings ratio of only 8.3 + strong earnings momentum over the last 5 quarters, also paying dividends 7.1% (forward) yield, dividend growth rate 5yr + 27.59%.
With that said i think with a break of this range over $8 could see strong momentum towards $11-12

With BB squeezing, ICX is getting ready for rally?Hello Friends,
We have made 100% in ICX in the last rally, now it is consolidating and BB is squeezing. The price is in range for some time. Considering the above I would go long now or on dips till 2800 SATs for 4700 SATs and more.
My sl is below the BB range on 4 hrs.
Please note : this is my trade and no recommendation to buy or sell. Trade at your own risk.
Good luck with your trades.
