EUR - Where to next?EUR - Where to next? $ OANDA:EURUSD FX:EURUSD
On the docket today is US Unemployment Claims - Which should shift the markets to either direction and at end of the week PMIs
EUR: Currently within range
Highs: 1.09992
Lows: 1.09095
A break of the highs I expect EUR to re-test the previous highs of 1.10555. However, if we are to break this trendline up and the range lows we are in, then I expect us to test the next support of 1.08510.
Have a great day ahead,
Trade Journal
Rangebreakout


PANW ranging - indications of a downtrendPANW has been ranging between 181 and 192 for around a month, at a high position.
We now expect it to go to the downside with a possibility of dumping to our targets.
More details are shown on the chart.
Good luck!

Nifty in Range after Gap downAaj Nifty Gap down khula, Recover kia and phir 1ghnte baad sara din 40 point ka range mai raha. Ab next day aggar same level khul ke 15mins wohi trade karta rahe toh upar side gap cover karne jasakta hai.
SL: Built up ke neechay ya Range ke i.e. 17395-173400. Aur neechay b nikle built up ke baad toh same.

LDO SHORT HTF LDO. SHORT. HTF LAYED OUT, play the range dont worry about the middle action but confirmation on the way down is key,

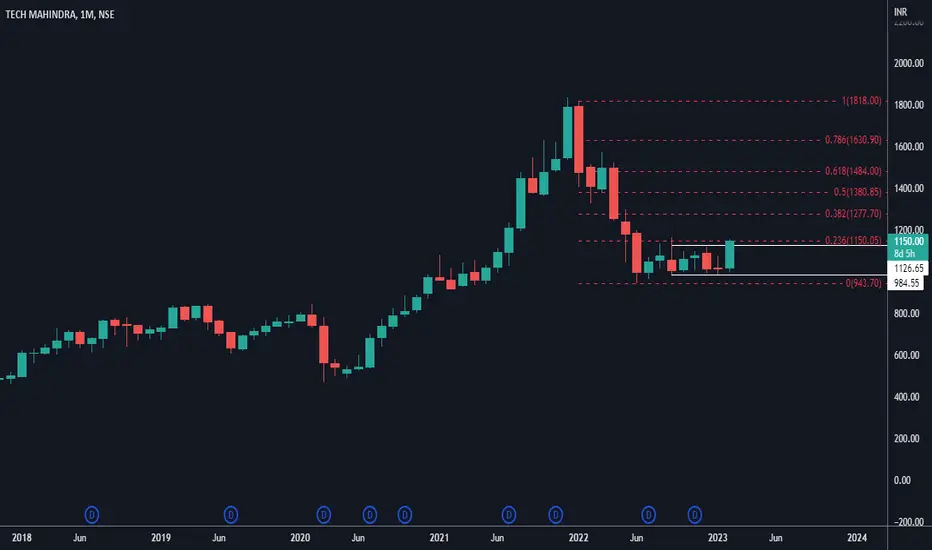
TECH MAHINDRA monthly range breakout PREMPTINGtech mahindra range breakout preempting
it index is strong and most negative news are priced in
on monthly basis its forming a marubozu candle
my sl is 940weekly closing basis
target 1277 1484
after falling forming range
on weekly basis range breakout has occur and this week i will be consider for confirmation if it closes above 1127 on weekly basis
$FLOW - wants to BLOW aboveHello my Fellow TraderZ,
This is good to see many #ALTS are rising which were lagging in the First leg.
$FLOW has finally broke the Range in which it was consolidating for few days. What a Daily close above the Resistence with SOLID Green candle with Huge VOLUME.
Let it retest the Resistence flipped Support, then we have three TPs : $1,54 - $1.74- $2.1.
Again, trade any token with tight SL as #BTC is at major Resistence.
CHEERS!!!

Ethereum - Looking To Buy Pullbacks In The Short TermD1 - Price has broken above the top of the range and is holding above it.
No opposite signs.
H1 - Higher highs.
Until the two strong support zones hold my short term view remains bullish here.

Cant wait for price to stop ranging? Do thisFirst of all you are going to need this indicator
Its the Heiken Ashi Algo Oscillator. Click the image below
There are times when price is ranging. When this happens you simply need to see what is the channel where the RSI values are hitting and you want to know WHEN is the RSI breaking out of that channel
In this oscillator the HIGH and LOW part of the RSI Range is the +10 and -10
If price is ranging in between as it is consolidating you dont want to sit there for several hours.
So in this video you can see how to set an alert telling you when the RSI breaks out of the RANGE.
This way, once the alert is set, you can go live life.........
See you next time at the CoffeeShop

INDUSINDIndusind is trading inside range of 1117-1175 from past one month & twice in past one month it reversed from 1168-1173 zone.
Although it looks like it ll break past upper end of the zone this time, but it would be better to trade only above 1175.
If it breaks past 1175 then its a buy with mentioned stoploss & targets.

HDFCBANKHDFCbank was trading in a range from past 1 month & it broke out of it today with good volumes.
Could be bought with mentioned stoploss & target.

AUDUSD - Ready for NFP? AUDUSD - Ready for NFP?
Great set ups brewing for NFP this afternoon. A break to either direction.
Consensus expectations is +200k.

Is Volatility the New Normal? Hi I'm Goose and I'm apparently obsessed with the VIX this week. I would say I've reached a point of borderline stalker, going through historical data, working up average all time range theories, and ultimately writing a script that will give me a bar count inside and outside of a date and price range and the percentage of time during that period that the VIX has gone wild. I used this script compare these statistics across the daily chart in different sections of time. Now, I did this because I am anticipating a return to mean with the VIX any moment now. I'm tapping my fingers and getting impatient. And not because I'm waiting for a rally, I mean, a rally would be cool, but because this has gone on long enough really.
So I decided to compare the 2008 Crash historical data with the more recent Covid data. If you haven't read the in's and out's, the timeline and the reasons why, go do that right now. Or just watch The Big Short a couple of times for the cliff notes. But for the sake of this chart, I marked up some of the important moments during what is now known as the Housing Crisis/Great Recession. Theoretically I could have made arguments to drag this period out to 2014, but comparably it makes little sense and frankly, even further drives my theory, so I ended the period when the market had recovered its 50% losses from pre crash peaks. Keep in mind, current markets recovered and S&P Futures made a new high in just under 6 months from the Covid Crash. So this is already an unfair comparison. And that is kind of my point. Comparable factors like unemployment and U.S. Homeownership are actually contradictory for the most part if you omit the summer of 2020. And if you're in the group, as I am, that believes low unemployment numbers promote higher inflation numbers, then we could argue inflation begun, albeit transitory, in May and July of 2018 when unemployment dropped below 4% and really got a foothold in 2019. All it needed was a supply chain interruption. And I know Covid takes the blame for that, but that had started also. China trade, pine beetles, metal shortages, coffee , etc... So when Covid whooped the employment numbers 10 points from March at 4.4%, to April at 14.7%, it basically created a sling shot effect with equities. Come August of 2020 when those numbers rapidly dropped to 8.4% we made brand new highs. And within a year we had dropped back to where we started in the upper 4% range. I know I'm on a tangent, but why is this important? Because in the Covid Market, we turned those numbers around in 1 year, as opposed to the 5 years it took to recover AFTER the end of the Recession and its 5 year recovery. Soooo... That's why I'm not counting that period, and why I'm calling out VIX on is behavior.
So lets get to my point. Is the new normal volatile AF ? As it currently stands, and based on a range of $10-$20 dollars which I determined to be fair visually for the initial part of this work up, the VIX has spent 5% more days above the standard range. Now 5% isn't a deal breaker. We can find dramatic headlines that will excuse random volatility but I will argue we are at a crossroads. If we continue to stay above $20, we risk having to work hard and longer to get that figure back down. Remember calculating your GPA , but in reverse. Eventually the shock and awe of a +$30 VIX won't induce the same FOMO reaction and things may get really weird. When VIX goes into the new year, the powers that be will need to reign her in to avoid decoupling on any given Wednesday instead of just low liquidity holidays. My theory actually goes further down the rabbit hole when I narrowed down a true 50% average range, wait for it.... $10 - $16.75! YES! The overall, from inception, average high of range sits at $16.75. And pop on the tin foil hat because with that range, both the Housing Crisis/Great Recession AND the Covid Market are sitting at 91% above range. I checked that 3 times to be sure and I did not include that in the frame of this chart as it already had enough scribbling all over it, but if you explore to the bottom of the chart you will see a smashed up mess of it. So if your listening Market Makers, shut it down, shut it down now. And if that is what you are setting up to do as I have already speculated in a previous work up, well done! Keep it up. I know for a fact that the VIX is heavily relied upon by many successful traders in many different products for directional bias, let's not ruin it shall we...
On this chart you will see the table bar counts for inside and outside of price range for the specified period as well as the total bar count and the percentage of bars outside of that range.
That means up OR down so the period between the Recession and Covid has 12% outside of range, but you will notice that it goes below the range as well. When the price range was moved down
beneath the lows to $8, it lowered the percentage by 3 points.
I have also labeled some fun facts that occurred during the historical period to show a bit about why I choose the dates that I did.
Leave a comment for a heated debate, or to tell me how cool I am, or that I'm just a silly Goose.
en.wikipedia.org
www.statista.com
data.bls.gov

Dollar Index Short Term Sell IdeaH4 - Price has broken below the bottom of a range and is holding below it.
Lower lows.
H1 - Bearish trend pattern.
Currently it looks like a pullback is happening.
Until the two strong resistance zones hold my short term view remains bearish here.

PRINCR PIES, RSI SUPPORTmy support got supported by today's price action.
already that support was previously was supported to times.
this was a bear trap. and now the stock is ready to give a range breakout!
have a look at the increasing volume too.
RSI IS SHOWING A FALLING WEDGE PATTERN!
great time to enter!!

HAVELLS, RANGE BREAKOUT!!we could see in further few days to increase volume and give a range breakout. havells is a great company.
the major black line is the actual trend the stock should follow.
currently its undervalued.
great for swing trades.
one can take a target till 1420.

Mahindra & MahindraMahindra & Mahindra breaking out of consolidation range & facing multiple resistance level of 1280-1282 with very good volumes.
Could be bought with mentiond stoploss & targets.

MARUTI - The FalconMaruti consolidated for a month in range & today it broke out of the range with very good volumes, looks like it ll fly like falcon.
Could be bought with mentioned stoploss & targets.

HEROMOTOHeromoto made inverted head & shoulder on hourly charts with good volumes, also breaking out of one month range with volumes.
Could be bought with mentioned stoploss & targets.

BTCUSDT ANALYSIS 4HBITCOIN
Price is still consolidating between our support and resistance zones. On a lower time frames I expect to see bullish move.

Bank Nifty - In a RangeAll details are given on chart. If you like the analyses please do share it with your friends, like and follow me for more such interesting breakout charts.
Disc - Am not a SEBI registered. Please do your own analyses before taking position. This post is only for educational purposes and not a trading recommendation.

EURGBP - potential setupsFX_IDC:EURGBP
Hello everyone!
🛎 Let check the trading idea for EURGBP
🤗 Not making anything difficult everything is pretty straightforward.
👉 1. Price goes ABOVE the selected range on the picture. Long positions to activate. 🟢
👉 2. Price goes BELOW the selected range. Short positions to activate. 🔴
----------------------------------------------------------------------------------------------------------------------------
⚠️ Important Notes:
1. Always follow your trading plan regarding entry, risk management, and trade management. ❗️❗️❗️
2. Timeframes: up to H4
----------------------------------------------------------------------------------------------------------------------------
😉 If you like the idea there was a like 🚀 and sign up so you can continue receiving great ideas like this one and also for us to make pattern the idea! 🤝
💪 Profitable lock for everyone! 🙏

Crude oil making another push against resistanceUSO (largest crude oil ETF) has been in a wide trading range for the past 2 months between 71 and 79.
It's failed at all previous breakout attempts, but the more it tries and the longer this range carries on, the more likely the breakout becomes. No trade yet, but we're watching this zone to see if we can finally get some price expansion and volume on a move over 79.
