AUDJPY - potential setupsFX_IDC:AUDJPY
Hello everyone!
🛎 Let check the trading idea for AUDJPY
🤗 Not making anything difficult everything is pretty straightforward.
👉 1. Price goes ABOVE the selected range on the picture. Long positions to activate. 🟢
👉 2. Price goes BELOW the selected range. below. Short positions to activate. 🔴
----------------------------------------------------------------------------------------------------------------------------
⚠️ Important Notes:
1. Always follow your trading plan regarding entry, risk management, and trade management. ❗️❗️❗️
2. Timeframes: up to H4
----------------------------------------------------------------------------------------------------------------------------
😉 If you like the idea there was a like 🚀 and sign up so you can continue receiving great ideas like this one and also for us to make pattern the idea! 🤝
💪 Profitable lock for everyone! 🙏
Rangebreakout

Gold Futures - potential setupsCOMEX:GC1!
Hello everyone!
🛎 Let check the trading idea for Gold Futures
🤗 Not making anything difficult everything is pretty straightforward.
👉 1. Price goes ABOVE the selected range on the picture. Long positions to activate. 🟢
👉 2. Price goes BELOW the selected range. below. Short positions to activate. 🔴
----------------------------------------------------------------------------------------------------------------------------
⚠️ Important Notes:
1. Always follow your trading plan regarding entry, risk management, and trade management. ❗️❗️❗️
2. Timeframes: up to H4
----------------------------------------------------------------------------------------------------------------------------
😉 If you like the idea there was a like 🚀 and sign up so you can continue receiving great ideas like this one and also for us to make pattern the idea! 🤝
💪 Profitable lock for everyone! 🙏

Dollar Mid Year Macro UpdateIn January I reviewed the long-term technical and fundamental positions of the big four: Bonds, Equities, Commodities, and the Dollar. Those pieces are extensive in terms of both fundamental and technical outlooks and are linked below.
January 2022 Observations: Bottom Line: It’s a range trade until it ain't no more. Impetus for a range break could be provided by the Federal Reserve increasing rates significantly faster/slower than current expectations or faster/slower than other central banks. Externally, a flight to safety resulting from disruption in emerging markets, armed conflict in Europe, or significant new domestic fiscal stimulus are all possibilities. When thinking about the Dollar its worth remembering that currency is a relative game. It's not only the domestic economy and monetary/fiscal policy, but those factors relative to the same factors inside our largest trading partners.
-The 88.25 - 103.82 range is the most important chart feature. Moves inside the bounds of the range are noise, and while they may represent trading opportunities mean little in macro terms.
Where is the market now? Since January, flight to quality, an ultra-aggressive Fed tightening cycle, conflict in the Ukraine and EM turmoil have all combined to produce a roughly 14% rally. In May, price thrust above the resistance along the top of the 102-104 zone. Over the last few weeks, the market narrative changed and profit taking ensued, resulting in the market moving back toward the breakout zone. The decline built a bull flag (easily seen on the daily perspective chart). Now the recent thrust higher suggests that the correction may be complete.
-DXY has finally moved modestly above the top of the range that has contained price since 2014.
-The breakout needed to be confirmed by a completed test of the broken range top but last week’s thrust higher strongly suggests a successful test.
-Monthly MACD remains on a bullish trend signal.
-Volatility (VOL) MAY finally be turning higher, but has yet to move above the downtrend that defined its trend since 2003.
How far might a breakout carry?
-The overbought line of the parallel trend channel that has defined the advance since 2011 intersects price in the 113-114 zone.
-Horizontal resistance in the 121 zone is extremely strong and is nearly 12% higher,
-Measured move targets generated by the length of the range and the Point and Figure counts suggest potential targets in the 118-120 zone.
-Above 120-121, the 1985 165 resistance comes into play.
A Note on Tactics: I have a preference toward systemizing discretionary behaviors. My approach to trading breakouts generally falls into this category.
After a breakout (In any perspective) there are generally three main behaviors that I monitor for (and many variations on the themes) and three general trading reactions to those specific behaivors. I like to build trading plans around those three behaviors.
Behavior 1: The market thrusts, closes above resistance and rallies without setting back to test the breakout zone (This appears to be what is unfolding now). This behavior is the most bullish of the three. Plan: Buy bullish thrusts from bull flags and corrective patterns in the lower perspective time frames.
Behavior 2: The market sets back to the top of the broken range, preferably in a corrective manner and then rallies. Plan: Buy thrust out of the lower time perspective pattern that develops on a decline to test the breakout.
Behavior 3) The market fails and falls back into the range. Plan: Sell breaks of the bear flags that develop as the market breaks lower. Failed breakouts often produce significant reversals.
Sometimes the behaivors are muddled and no clear pattern develops. If that occurs, no worries… find another market to trade.
Triple Screen: A bit of a mess in that the weekly momentum is so overbought, but often when a market breaks out from a long-term range overbought momentum is actually a sign of strength. Importantly, the trend in price is ALWAYS more important than the state of momentum.
Monthly: Price is clearly trending higher. MACD is on a long term buy signal and trending higher.
The momentum in this perspective is higher both in terms of momentum and price.
Weekly: Price trend is clearly higher and momentum is overbought and is attempting to turn lower. With monthly momentum higher, pullbacks in this perspective can be used to enter monthly perspective/macro positions.
Daily: The short term overbought has been relieved. The pullback from the high has been entirely consistent with corrective behavior.
Fundamentally:
If you believe that DXY will turn lower, you must simultaneously believe that the Euro is ready to turn higher as it has an almost 60% weight in the index. I suspect, given Europe's challenges, that a wave of fiscal stimulus to offset the winter energy shock will serve to further weaken the currency. Less farfetched is the idea that JY (14% weight) might strengthen somewhat. But it’s much smaller weight will produce far less DXY gravity than the Euro.
The same change of narrative that produced the rally in risk assets has pressured DXY. Markets seem to believe that the easing of inflaiton (a slower rate of change) means that the Fed is nearing the end of its tightening campaign and, perhaps will begin cutting rates in reaction to a slowing economy. But the easing of financial conditions created by the rallies in risk assets and still strong employment gives the Fed plenty of room to continue increasing rates. I think they have been abundantly clear that they are determined to bring inflaiton under control, even in the face of a much weaker economy. In my mind, Powell needs to decide if his legacy is Arthur Burns or Paul Volker. My guess is he chooses Volker. Volker = stronger DXY.
Fiscal impulse in the US should remain negative. The prospect of a split congress significantly decreases the likelihood of substantive new spending bills.
In relative terms the US Fed remains one of the most aggressive tighteners on the planet. The combination of rate increases and quantitative tightening create a powerful bullish relative mix for DXY.
Many analysts suggest that weakness in DXY has created a rally in risk assets. I believe they have causation backwards. During periods when global risk assets struggle, weakness in risk assets and flight to quality creates flows into DXY. When risk assets do better, as they have over the last few weeks, the DXY weakens as flows reverse to risk. If/when risk assets begin to decline again, flows will again become DXY favorable.
Conclusion:
-The market appears to be breaking out of the broad range that has contained price since 2014.
-Monthly price and momentum trends are clearly higher.
-VOL has yet to break above its long-term downtrend but I suspect that is coming soon. A break above the downtrend would imply a long cycle of higher price.
- I have built my second half trading plan around the three behaviors covered above, but I have a strong preference for bullish entries.
-Without a Fed pivot, which I view as highly unlikely, fundamentals continue to strongly favor DXY strength.
-Fresh weakness in risk assets will buttress the bullish thesis.
Finally, in my opinion, succesfull trading requires strong opinions that are loosely held. I wake up each day questioning my positioning and thesis, because… things change.
Good Trading:
Stewart Taylor, CMT
Chartered Market Technician
Shared content and posted charts are intended to be used for informational and educational purposes only. The CMT Association does not offer, and this information shall not be understood or construed as, financial advice or investment recommendations. The information provided is not a substitute for advice from an investment professional. The CMT Association does not accept liability for any financial loss or damage our audience may incur.

Is $DE ready to move higher from here?Notes:
* Very strong up trend
* Great earnings track record
* Was basing for about a year before volatility kicked it around to both the up and down side of the base
* It's currently back within that base (between 394.4 and 323.5)
* Last weeks close had strong volume coming in (above average)
* Recently came back above the $357.1 mark on the weekly, which seems to be a battle ground for bull and bears (with higher than average volume)
* Was consolidating tightly all of last week with increasing volume and broke out of that consolidation on Friday with abnormally high volume
* Currently offering an early entry and a pocket pivot
Technicals:
Sector: Industrials - Farm & Heavy Construction Machinery
Relative Strength vs. Sector: 1.02
Relative Strength vs. SP500: 1.18
U/D Ratio: 1.2
Base Depth: 53.52%
Distance from breakout buy point: -16.72%
Volume 208.01% above its 15 day avg.
Trade Idea:
* You can enter now as the price is just breaking out of consolidation with higher than average volume
* If you want a better entry you may be able to get one around the 361.9 area if it comes back within the consolidation range
* This stock usually has local tops when the price closes around 13.34% above its 50 EMA
* Consider selling into strength if the price closes 13.14% to 13.54% (or higher) above its 50 EMA
* The last closing price is 8.67% away from its 50 EMA

ETHUSD - Potential ideaBINANCE:ETHUSD
Hello everyone!
🛎 Let check the trading idea for ETHUSD
🤗 Not making anything difficult everything is pretty straightforward.
👉 1. Price goes ABOVE the selected range on the picture. Long positions to activate. 🟢
👉 2. Price goes BELOW the selected range. below. Short positions to activate. 🔴
----------------------------------------------------------------------------------------------------------------------------
⚠️ Important Notes:
1. Always follow your trading plan regarding entry, risk management, and trade management. ❗️❗️❗️
2. Timeframes: up to H1
----------------------------------------------------------------------------------------------------------------------------
😉 If you like the idea there was a like 🚀 and sign up so you can continue receiving great ideas like this one and also for us to make pattern the idea! 🤝
💪 Profitable lock for everyone! 🙏

GBPUSD - potential setupsFX_IDC:GBPUSD
Hello everyone!
🛎 Let check the trading idea for GBPUSD
🤗 Not making anything difficult everything is pretty straightforward.
👉 1. Price goes ABOVE the selected range on the picture. Long positions to activate. 🟢
👉 2. Price goes BELOW the selected range. below. Short positions to activate. 🔴
----------------------------------------------------------------------------------------------------------------------------
⚠️ Important Notes:
1. Always follow your trading plan regarding entry, risk management, and trade management. ❗️❗️❗️
2. Timeframes: up to H1
----------------------------------------------------------------------------------------------------------------------------
😉 If you like the idea there was a like 🚀 and sign up so you can continue receiving great ideas like this one and also for us to make pattern the idea! 🤝
💪 Profitable lock for everyone! 🙏

XAGUSD - potential setupsFX_IDC:XAGUSD
Hello everyone!
🛎 Let check the trading idea for XAGUSD
🤗 Not making anything difficult everything is pretty straightforward.
👉 1. Price goes ABOVE the selected range on the picture. Long positions to activate. 🟢
👉 2. Price goes BELOW the selected range. below. Short positions to activate. 🔴
----------------------------------------------------------------------------------------------------------------------------
⚠️ Important Notes:
1. Always follow your trading plan regarding entry, risk management, and trade management. ❗️❗️❗️
2. Timeframes: up to H4
----------------------------------------------------------------------------------------------------------------------------
😉 If you like the idea there was a like 🚀 and sign up so you can continue receiving great ideas like this one and also for us to make pattern the idea! 🤝
💪 Profitable lock for everyone! 🙏

RTX - potential setupsNYSE:RTX
Raytheon Technologies Corporation , an aerospace and defense company, provides systems and services for the commercial, military, and government customers worldwide.
It operates through four segments: Collins Aerospace Systems, Pratt & Whitney, Raytheon Intelligence & Space, and Raytheon Missiles & Defense.
------------------------------------------------------------------------------------------------------------
👉 1. Price goes ABOVE the selected range on the picture. Long positions to activate.
👉 2. Price goes BELOW the selected range. below. Short positions to activate.
⚠️ Important Notes:
1. Follow your risk management rules.
2. Timeframes: up to 1D
Good luck and profit to all

ETH Daily MM examples and successful BOSee ETH chart for very nice measured moves (MM). Great TL , TCL and midline examples and a successful range break example (most fail). This one likely succeeded due to bigger dominant pattern - coming off lows and we have an idea where we are headed. Will that UPPER TL hold?? See linked charts for more PA information.

GBPCHF Short ideaAfter long consolidation, it breaks through range and implies it will continue to go downtrend till the nearest median line.

$ETC - Bounce from 60 period SMA on the 4 hour chart - LONGA simple idea along the lines of my last couple if you've seen, we've had a large expansion when ethereum classic started to get a lot of attention surrounding the merge narrative and mining moving over, a range was set on the break down from that rally and price has managed to break out and is currently come back down to retest it, also lining up with a bounce from the 20 period SMA which I like.
this is a good level to buy imo and i think we go to at least 40.6ish which is towards the top of the prior consolidation before breaking down
tldr
buy 37.6
target 40.6
stop 36ish (below a prior wick and 20 period SMA)
follow me on the tweeter :)

Potential setups for GBPCADFX_IDC:GBPCAD
👉 1. Price goes ABOVE the selected range on the picture. Long positions to activate.
👉 2. Price goes BELOW the selected range. below. Short positions to activate.
⚠️ Important Notes:
1. Follow your risk management rules.
2. Timeframes: up to H1
🧐 Pay attention to the trend line on the 4 Hour timeframe 😉

Is this recent rally a bull rebound of a bear retracement? To make an assessment if the market has turned bear, during the closing second quarter on 29th June 2022, we discussed on the topic “Using S&P to Identify Recession
and on the 19 Jul, 2 weeks ago the tutorial posted here, we studied and expecting this current rebound, topic “Nasdaq a leading indicator of Dow Jones, S&P & Russell”.
In today’s tutorial, I thought of doing a recap between the two videos and explore if the current market and its development, if it is a bull rebound heading to break another new all-time high or if it is a bear retracement?
I have included both the video links below.
Before we get into this topic, please also take some time to read through the disclaimer in the description box below.
Disclaimer:
• What presented here is not a recommendation, please consult your licensed broker.
• Our mission is to create lateral thinking skills for every investor and trader, knowing when to take a calculated risk with market uncertainty and a bolder risk when opportunity arises.
Tutorial example:
Micro E-Mini Nasdaq
0.25 = US$0.50
1.00 = US$2
(12,900 - 11,900) x US$2
=US$2,000
(Note: Opposite is also true)
• During the closing second quarter in June, on 29 Jun - “Using S&P to Identify Recession
• On the 19 Jul, 2 weeks ago - “Nasdaq a leading indicator of Dow Jones, S&P & Russell”

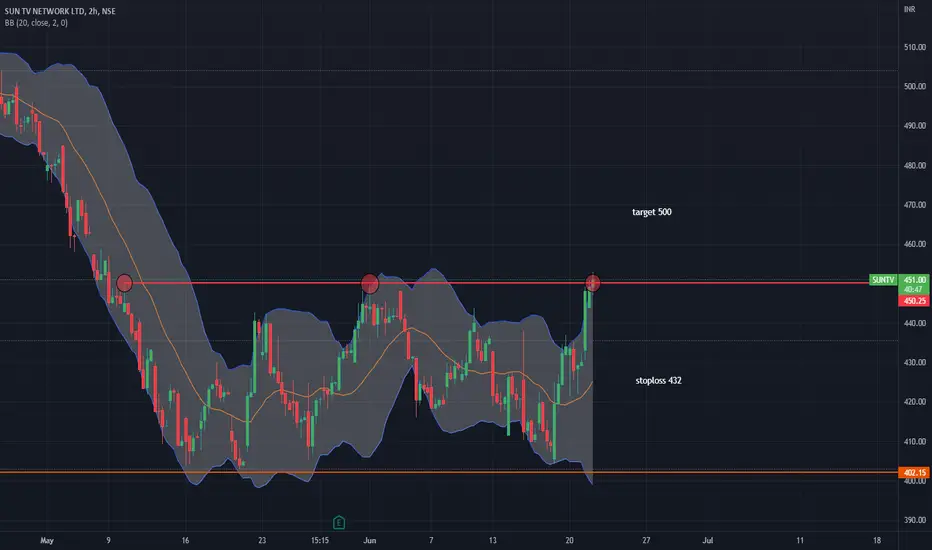
SUNTVSuntv trying to break out from iits 3 months of range trading, it failed thrice in 3 months to sustain above it. Lets see if it trades above 453 & sustains ..
then could be bought with stoploss of 440 & targets of 475/500 in very short period of time.

SUNTVSuntv breaking oout of 10 days of trading range breakout with good volumes.
Could be bought with mentioned stoploss & targets.
MFSLMFSL broke out of mutiple resistance zone 830-835 with decent volumes.
Could be bought with mentioned stoploss & targets.

SOL/USDT : Short-term bullish signsBINANCE:SOLUSDT BYBIT:SOLUSDT
Hello everyone 😃
Before we start to discuss, I'll be so glad if you share your opinion on this post's comment section and hit the like button if you enjoyed it!
$SOL has formed a short-term range bound and it's very possible to have a breakout above it.
But there're two things to look for before getting into any Long on $SOL.
- The higher S/R zone.
- The higher S/R line.
Despite the bullish bias on market from day-trading sight, It's better to wait for a hold above $38...
With any confirmation above $38, You can enter Long with a final target of $43.
Invalidation after taking a Long position should be a dive below the marked S/R zone!
Hope you enjoyed the content I created, You can support us with your likes and comments!
Attention: this isn't financial advice we are just trying to help people with their vision.
Have a good day!
@Helical_Trades

AdaniEntAdanient broke out of its range on daily charts with decent volumes.
Could be bought with mentioned stoploss & targets.

Biil Williams Aligator Indicator Explanation on BTC MarketCapHello Friends.
Today we will explain Aligator indicator on BTC Marketcap Chart.
this post has 2 purpose:
1)BTC marketcap analyze
2)Learn how Bill Williams Aligator indicator works
First lets see how this indicator works:
The Alligator indicator is composed of three smoothed moving averages.
It is named ‘alligator’ because it mimics the feeding habit of the animal and can help traders
pick out the best times to ‘feed’ on the pips available in a trending market.
Here are the lines that constitute the Alligator indicator:
Alligator’s Jaw
This is a 13-period smoothed moving average.This line is typically visualised in blue.
Alligator’s Jaw = SMMA (median price, 13, 8)
Alligator’s Teeth
This is an 8-period smoothed moving average. This line is typically visualised in red.
Alligator’s Teeth = SMMA (median price, 8, 5)
Alligator’s Lips
This is a 5-period smoothed moving average. This line is typically visualised in green.
Alligator’s Lips = SMMA (median price, 5, 3)
Trading Rules:
When the lines are intertwined or converging, it implies that the market is ranging (the ‘alligator’ is sleeping).
The longer the alligator sleeps, the hungrier it will wake up; prolonged consolidation will imply a massive breakout.
The alligator’s lip will be the first to move (crossing above or below the jaw) when it is waking up, which denotes the
Begining of a new trend.
An upward movement implies an uptrend might be forming, whereas a downward movement implies that a potential downtrend is starting.
A trend will be confirmed when the alligator’s teeth cut through the lips.
This will be the signal to buy in a confirmed uptrend or to sell in a confirmed downtrend.
The signal to take profits will come when the lines start to converge again, which will mean that the alligator is now about to repeat the sleep cycle.
Now lets see what happened in BTC marketcap According to this Strategy:
We can see awakening of aligator from 9 march 2020 untill 12 april 2021.
it shows a strong uptrend and aligator lines divergence.
I show it with a Green Ellipse in chart.
after that aligator go to sleep for a while from 12 april 2021 to 18 jan 2022.
so we can see a Range in price and aligator lines converging.
I show that with a Yellow Ellipse in chart.
after that we see aligator lips and teeth breaks jaw and aligator awake in a downward trend
so we approch a bearish market and i show that with a Red Ellipse.
no one know how much this cycle last.
after this section i think aligator go to sleep again and after that awake upward.
please protect your capital and know about market cycles.
we could see new bottoms so we must manage our risk.
after that when diffrent conditions confirm uptrend we can buy again.
Remember:
Buy expensive but confident
!!!NOTE!!!
MY POSTS ARE NOT TRADING AND INVESTING ADVISE.
SO DO ON YOUR OWN OPINION AND CONSIDER MARKET RISKS.
Thank you all for reading this article hope that be useful for you.
share me your opinion in comment please.

AuropharmaAuropharma breaking out of its range on the upside with okayish volumes.
Could be bought with mentioned stoploss & targets.

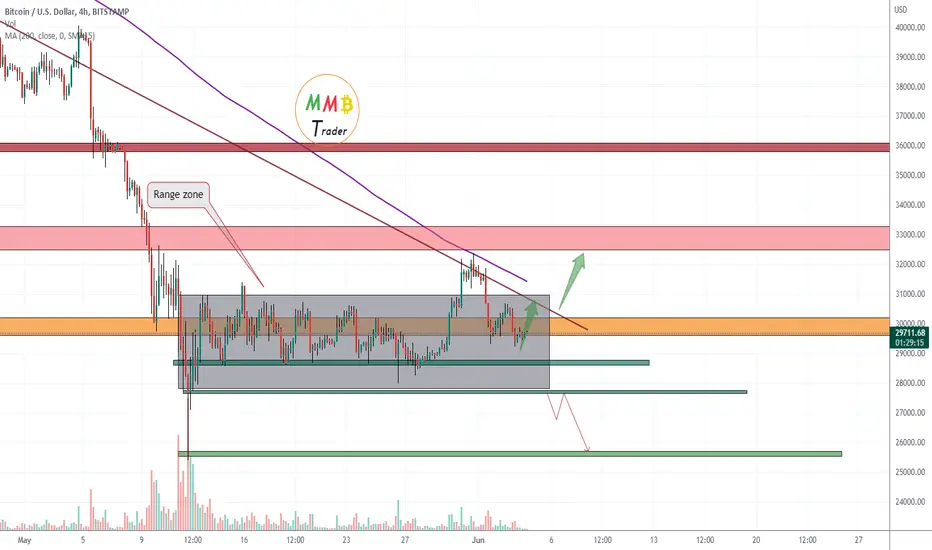
BTCUSD wait for Range zone breakout The range zone here will soon end and we are looking for a breakout to the upside and pump after that like the green arrows on the chart.
Notice: only if range zone support breaks more dump here is expected.
<>
XAUUSD Price Action BreakdownGold has been in a range for almost two weeks with price bouncing back and forth between 1867 and 1829 (about 37 points). I think that the NFP report will bring in volume to push price out from this major range and could possibly continue the bullish trend on the daily TF. As long as the level of support holds around 1843 or 1838, we could see more bullish momentum as the week comes to a close. For now, I have mapped out some scalp trade opportunities going into the Asian session and possibly the NY session tomorrow.

Bitcoin Break out!No Comments! Just take a look at the chart.
A reminder: We are in a bear market. Do not expect much of any crypto. In my opinion it's just a relief rally.
