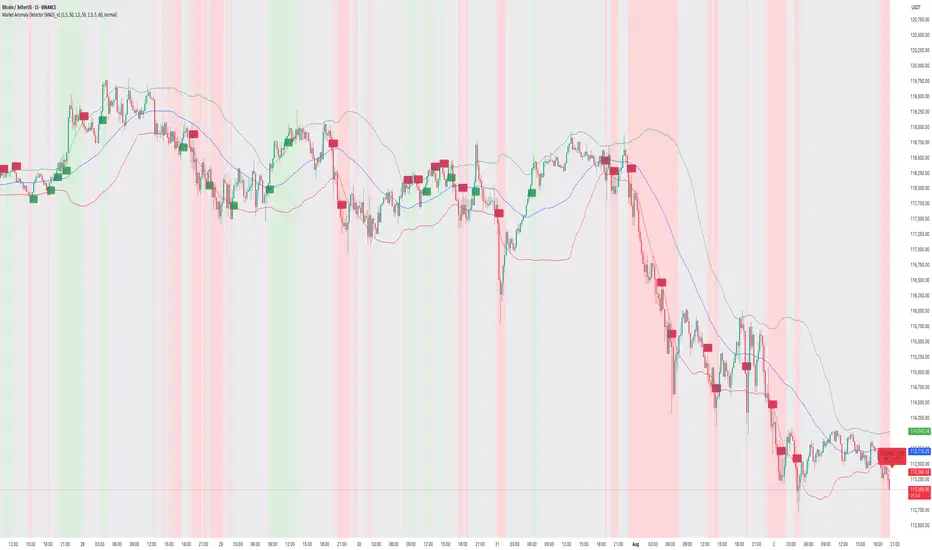
How to Capture Reversals/Breakouts with MAD IndicatorBTC/USDT 15M – Market Anomaly Detector (MAD) Captures Reversals & Breakouts
⸻
Description:
On this BTC/USDT 15-minute chart, the Market Anomaly Detector (MAD) is actively highlighting high-probability market turning points and anomaly zones.
Key Observations from the Chart:
1. Green & Red Zones = Expected Price Range
• Green Line (Upper Band): Expected top of the range.
• Red Line (Lower Band): Expected bottom of the range.
• Price usually travels green → red → green, forming a natural oscillation.
2. Buy/Sell Signals = Breakout + Reversal Detection
• Buy Signal: Triggered when price closes above the green line or recovers from below the red line.
• Sell Signal: Triggered when price closes below the red line or rejects from the green line.
• This reverse psychology logic helps catch false breakouts and stop-loss hunts.
3. Performance on This Chart:
• Signals aligned with key reversals during the sideways-to-downtrend transition.
• The strong downtrend in the second half of the chart shows multiple accurate sell signals, confirming trend continuation.
• Sideways movements had minimal false signals due to cooldown + volume filter.
4. Unique Advantage (USP):
• Statistical approach using Z-Score & Standard Deviation.
• Multi-filter confirmation with RSI, volume, and higher timeframe trend.
• Visually clear anomaly zones:
• Green background = Bullish anomaly
• Red background = Bearish anomaly
• Gray background = Neutral range
Takeaway:
MAD helps traders anticipate anomalies rather than react late, offering high-probability trade entries and reversals in trending and volatile conditions.
Rangetrading
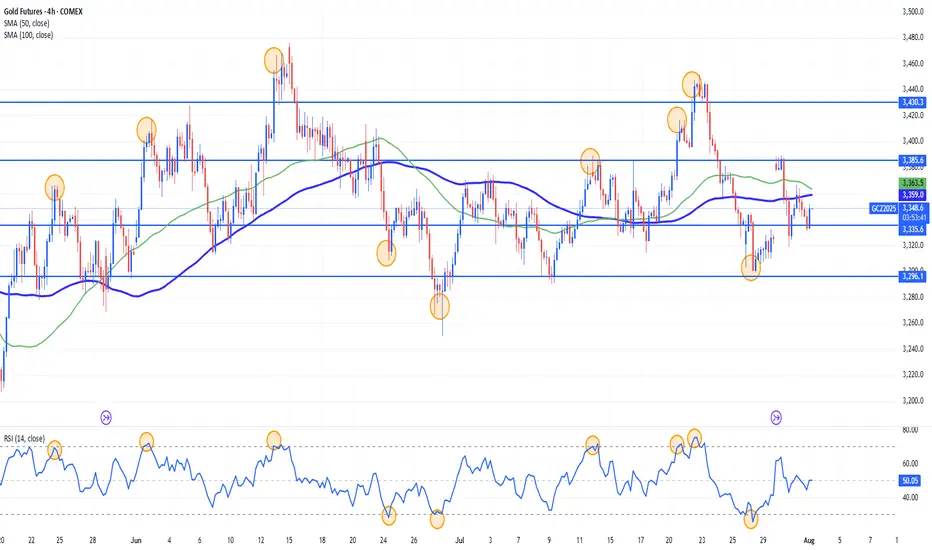
Gold Range-Bound and Ripe for Mean Reversion Plays?Gold has been locked in a sideways, range-bound regime for months, largely oscillating between the 3400 and 3160 levels. This lack of clear directional trend stems from conflicting fundamental forces: on one hand, sticky inflation and resilient U.S. data have bolstered the U.S. dollar and yields, weighing on gold. On the other, global growth concerns and geopolitical tensions continue to underpin demand for the metal as a safe haven. The push and pull of these opposing themes has created an environment of indecision and choppy price action.
While long-term investors may find this frustrating, range traders and mean reversion strategies are thriving. With technical boundaries so well-defined, short-term oscillations within the range are offering repeated opportunities for disciplined entry and exit.
Currently, XAUUSD is trading just under the 3296 level after a recent rejection from the 3350s. The bearish structure suggests a potential leg down toward the 3160–3180 support zone. However, absent any major economic surprises or geopolitical shocks, this could merely be another deviation from the mean rather than a true breakdown. Indicators like RSI and Stochastic Oscillator are already hinting at early signs of bullish divergence.
If price holds above or near 3160, the setup for another mean-reversion trade back toward the mid-range (around 3296 or higher) could unfold. In the current environment, fading extremes rather than chasing trends remains a strategy of edge, as depicted by the 14 period RSI.
Short AUDCHFRR 1:1.5
Reason:
Selling pressure observed on Range Top.
Target Range Bottom
AUDCH Sell Trade based on William's Alligator and William's %R on Daily Time frame for bias and 1hr time frame for trade idea.

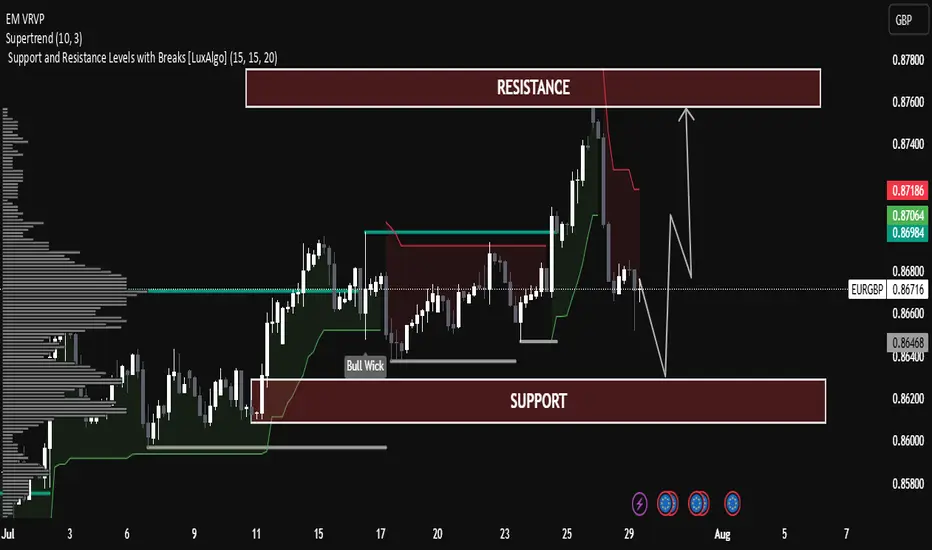
EUR/GBP Technical Analysis – Range-Bound Structure EUR/GBP Technical Analysis – Range-Bound Structure with Potential Rebound
The pair is currently trading within a well-defined horizontal channel between:
Support Zone: 0.86400 – 0.86200
Resistance Zone: 0.87800 – 0.87600
Price is currently near the mid-level (0.86756), showing consolidation after a rejection from resistance.
Supertrend Indicator:
The Supertrend (10,3) is currently bearish (red line above the price), indicating short-term downward pressure.
Price recently broke below the Supertrend line near the highs, suggesting a correction is underway.
Volume Profile (Left Side):
Significant volume has been transacted around the current market range (Point of Control).
This indicates strong interest and fair value, often leading to sideways movement before the next breakout.
Bull Wick Highlight (Mid-July):
Indicates buying pressure from lower levels, acting as historical demand near 0.86400.
🔄 Price Projection & Scenario Planning:
✅ Scenario A: Bullish Rejection from Support
If price retests the support zone (0.86400 – 0.86200) and forms a bullish rejection (e.g., pin bar or engulfing), a bounce is likely.
Target: Resistance zone 0.87600 – 0.87800
Confirmation: Bullish candle + break of 0.86900 resistance.
❌ Scenario B: Bearish Breakout Below Support
A break and close below 0.86200 may trigger a deeper correction.
Next possible downside target: 0.85800
Volume drop and strong red candles would support this.
🔧 Technical Summary:
Indicator Status
Structure Sideways / Range-bound
Supertrend Bearish (Short-term)
Support Zone 0.86200 – 0.86400
Resistance Zone 0.87600 – 0.87800
Bias Neutral-to-Bullish (above support)
🧠 Educational Note:
This chart is a great example of range trading—where traders look to buy near support and sell near resistance, especially when there is no strong trend. Patience and confirmation signals (like wick rejections or volume spikes) are key in such setups.
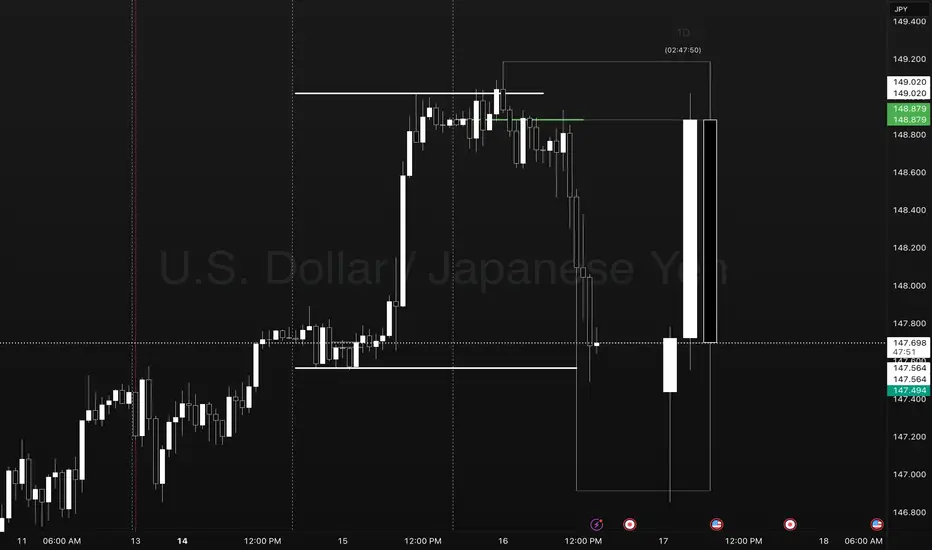
Pump Coil Dump Day 1-2-3 USDJPYUSDJPY Reversal Trade.
Points to Notice
Day 1 - Sets the new week high and low. Establishes a new week closing price as a target for a day 3 setup.
Day 2 - Typically expands Mondays range in the direction of the underlying oder flow. This occurs as a pump/ dump leading to the Asia and London coil sideways.
Day 3- We take note of the previous day high and low to observe price going into the NY session. In this case Price gave signs of a coiling reversal into the evening setting up for the move below Day 2 closing price.
Ideally what you want to see in this template is traders faked into a breakout move in the direction of the pump. This can present as a candle close above yesterdays high or closing price.
After trapping traders in we see the change in order flow creating a new lower low. This is the confirmation to look for an entry at the previous days closing price.
We set a stop at the high of day 3 level or at the previous days high with a target at the previous days low. In extreme cases we may see a setup that expands to the LOW level.
THE ONLY IMPORTANT DATA POINTS.
- PREVIOUS DAY HIGH AND LOW
- CLOSING PRICE
- LOW HOW LEVELS
- DAY COUNT
MARKETS ONLY DO TWO THINGS
- BREAKOUT, FAIL, REVERSE
- BREAKOUT, RETEST, TREND.
ONLY LEVELS THAT ARE TRADED
- PREVIOUS DAY HIGH (STOP LOSS)
- PREVIOUS DAY CLOSING PRICE (ENTRY)
- PREVIOUS DAY LOW (TARGET) CMCMARKETS:USDJPY FX:EURUSD OANDA:USDJPY
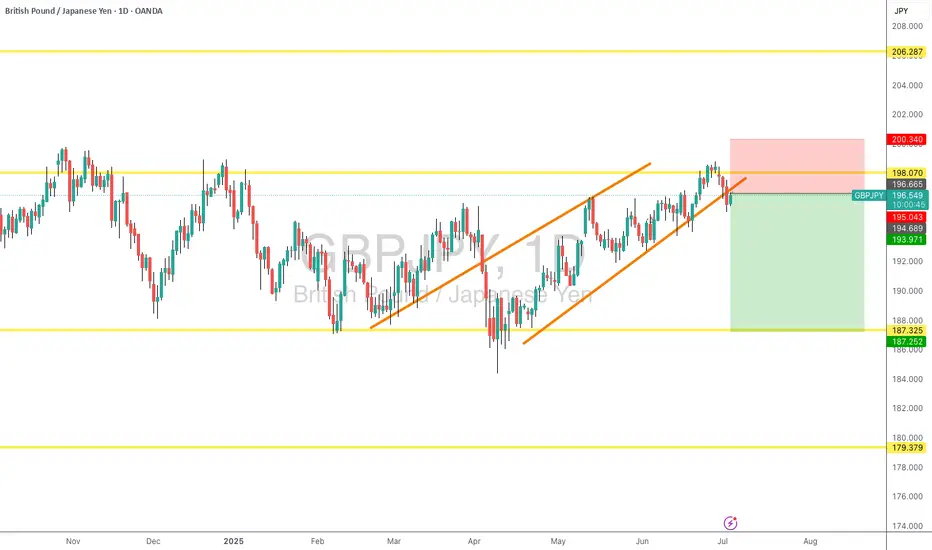
GBP/JPY SELL SETUP - Range Resistance RejectionGBPJPY is showing classic range-bound behavior with a clear rejection setup at key resistance.
📊 Market Analysis
Timeframe: Daily
Bias: Bearish (within established range)
Pattern: Range-bound market with resistance rejection
🎯 Trade Setup
Entry: 196.400 - 196.800 (on rejection candles)
Stop Loss: 199.200 (above range high)
Take Profit 1: 192.500 (mid-range)
Take Profit 2: 189.500 (range support)
📈 Technical Reasons
✅ Multiple rejections at 198.480 resistance level
✅ Range-bound market structure intact
✅ Bearish rejection candle formation
✅ Risk-reward ratio 1:2 to 1:3
🔍 Key Levels
Resistance: 198.480 (range top)
Support: 189.365 (range bottom)
Invalidation: Break above 199.200
⚠️ Risk Management
Position size: 1-2% of account
Watch for any break above resistance with volume
Weekly bias remains bullish - be ready to exit if range breaks up
💡 Trade Plan
Looking for price to respect the established range and move back toward support levels. This is a counter-trend trade within the range structure.
Remember: Trade your plan, plan your trade. Always manage risk first!
TV Today Network is currently near its key support zone.This is the 4 hour chart of TV TODAY.
Stock is trading in an ascending channel.
Post a corrective phase of 8–11%, the stock typically rebounds with a return of 11–14%, aligning with the upper and lower boundaries of the ascending channel.
VRVP is indicating two significant price levels—₹170 and ₹160—where notable volume accumulation has occurred, suggesting potential support or resistance zones at these levels.
If this level is sustain, then we may se higher prices in the Tv Today.

Crude oil futures Trade the range In this video I look at the current range that we are in and I have laid out a plan in the scenario that we break that range to the upside and what we could possibly expect .
I have given some reaction zones where I anticipate price to react when we reach there .
I have used Fibonacci, volume profile, and vwap in this video .
Thankyou for your support

EURJPY Analysis: Range Bounces & BreakoutHello traders!
EURJPY is in a daily range and is offering three trading scenarios.
The first scenario suggests the pair may react bearishly from the currently approached zone, setting up a bounce opportunity that could drive price lower toward the 162.130 area.
The second scenario anticipates a bounce toward the 158.400 area, if price reaches the support zone of the range.
The third scenario anticipates a breakout above the resistance zone, followed by a retest, which could present a strong opportunity for continuation toward the 169.300 area.
Discretionary Trading: Where Experience Becomes the Edge
Discretionary trading is all about making decisions based on what you see, what you feel, and what you've learned through experience. Unlike systematic strategies that rely on fixed rules or algorithms, discretionary traders use their judgment to read the market in real time. It's a skill that can't be rushed, because it's built on screen time, pattern recognition, and the ability to stay calm under pressure.
There's no shortcut here. You need to see enough market conditions, wins, and losses to build that intuition—the kind that tells you when to pull the trigger or sit on your hands. Charts might look the same, but context changes everything, and that's something only experience can teach you.
At the end of the day, discretionary trading is an art, refined over time, sharpened through mistakes, and driven by instinct. It's not for everyone, but for those who've put in the work, it can be a powerful way to trade.


Gold Setup: Range or Rip? Here's the PlaybookGold’s been on a tear lately — driven by safe haven demand as real yields soften and global uncertainty lingers.
But here’s where things get interesting...
We’re now watching what could be a textbook head and shoulders pattern start to take shape.
📊 Current Range:
Right now, price is stuck between 3380 and 3280 — and it’s acting like it knows it.
⚡ Possible Scenarios:
🔁 Scenario 1: Range Play
Short near 3380
Long near 3280
Let it ping-pong and catch the edges.
📈 Scenario 2: Breakout Long
Confirmation above 3380
Look for momentum follow-through into 3420+
📉 Scenario 3: Breakdown Short
Break below 3280
Eyes on the 3220s for a potential flush
🧠 The key? Drop to the lower time frames near these zones and wait for clean setups during active sessions — especially NY open or post-data volatility.
💬 How are you playing this? Breakout or bounce? Drop your take 👇
#gold #tradingview #futures #technicalanalysis #metals #xauusd #tradingstrategy #macro

XRP - Choppy Market, Will We See $1.5 Again?After finishing the 5-wave structure in early 2025, XRP had a rough patch, trading between $3 and $2 and offering some pretty neat swing trade opportunities. Now, two months later, the big question is: will this range continue, or is a breakout on the horizon? Let’s break down the key levels and high-probability setups.
Short Trade Setup
Resistance Zone:
The weekly level and the 0.618 Fibonacci retracement are both around $2.5763 to $2.5792, aligning nicely with each other.
The anchored VWAP from the all-time high at $3.4 adds extra resistance at about $2.63.
Setup Details:
A low-risk short trade can be considered at the weekly level, with a stop-loss set above both the anchored VWAP and the swing high.
Target: The monthly open, aiming for an R:R of about 4:1.
Support Backup:
Additional support in this range comes from the 0.618 Fibonacci retracement (from a low at $1.9 to a high at $2.59), the weekly 21 SMA at $2.28, and a weekly level at $2.0942 just below the monthly open.
This support between the weekly level at $2.0942 and the monthly open is crucial for maintaining bullish momentum. If it holds, the bearish short setup stands; if it breaks, things could get tricky.
Long Trade Setup
When to Consider a Long:
If the support zone mentioned above fails, look for a long trade opportunity at the swing low around $1.77.
Support Confluence:
Primary Support: The swing low at $1.77, with lots of liquidity around that area.
Additional Layers:
The monthly level at $1.5988.
The weekly level at $1.5605 sits just below the monthly.
The 0.618 Fibonacci retracement from the 5-wave structure at $1.5351.
Anchored VWAP from the low at $0.3823, aligning with the weekly level.
And don’t forget the psychological level at $1.5.
Setup Details:
This long trade setup would offer an attractive R:R of roughly 6:1, targeting back to the monthly open for an approximate 33% gain, with a stop-loss placed below the $1.5 mark.
XRP's current trading range has provided some good short and long trade setups, a long opportunity at the swing low ($1.77-$1.5) could be the next big play. Whether you lean towards short or long, finding these confluence zones helps in making more informed, high-probability trade decisions.
If you found it helpful, please leave a like and a comment. Happy trading!

Quotes Dropping? Here’s How to Find Support & Gain Best DealHave you ever found yourself wondering how to make sense of fluctuating quotes?
What if I told you that the powerful key lies in understanding the power of expected range volatility?
Ready? Let me 5 min to introduce you how understanding expected range volatility can give you the edge you need to succeed.
The expected range volatility (ER) provides a framework for understanding how much the asset could move within a specific timeframe. Statistically, price movements within the expected volatility corridor have a 68% probability, based on CME market data and a Nobel Prize-winning calculation formula. This means that traders can rely on these insights as a powerful filter for making more precise entry points into trades.
Key insight: when the market is quiet, and we approach certain price levels, there’s a 68% chance that the price won’t break through those boundaries.
The ER formula is available on the CME exchange's website, and in just a few minutes, you can input the data to get incredible results. It’s truly amazing!
I remember the first time I stumbled upon the ER tool. It felt like finding a gold mine in the trading world! I was amazed that such a powerful resource was available for free, yet it remained unnoticed by 95% of traders.
At that moment, I began to explore the trading community and was shocked to see how underestimated this tool was. I couldn’t find a single author who utilized such valuable data in their analysis.
But once I began to focus on expected range volatility and the data provided by the CME, everything changed. Since that I never make intraday trades without ER data was checked.
Limitations:
• Market Dynamics: Short-term price movements can be unpredictable due to various factors like market sentiment, news, and economic events. The Expected Range provides a statistical estimate but does not guarantee outcomes.
• Assumptions: The formulas assume that price movements follow a log-normal distribution , which may not hold true in all market conditions.
So, what about you? Do you utilizing the power of expected range volatility in your trading strategy? Share your thoughts in the comments below! And if you want make deeper insights , don’t forget to subscribe us.
In the world of trading, knowledge is power.
No Valuable Data - No Edge!🚀💰
Fri 4th Apr 2025 AUD/USD Daily Forex Chart Buy SetupGood morning fellow traders. On my Daily Forex charts using the High Probability & Divergence trading methods from my books, I have identified a new trade setup this morning. As usual, you can read my notes on the chart for my thoughts on this setup. The trade being a AUD/USD Buy. Enjoy the day all. Cheers. Jim

Bitcoin (BTC/USD) Technical Analysis & Trade Setup Market Structure & Key Levels:
The Bitcoin (BTC/USD) 4-hour chart displays a descending channel breakout, followed by a range-bound consolidation phase.
Key Support Levels:
$78,000 - $77,320: A strong demand zone where buyers have previously stepped in.
$80,000: Psychological support level.
Key Resistance Levels:
$84,340: Short-term resistance currently being tested.
$85,996: Next major resistance level.
$89,363: Target resistance level if a breakout occurs.
$92,331: A higher timeframe resistance level.
Chart Pattern & Price Action:
Descending Channel (Early March)
Price was in a downtrend, forming a descending channel pattern.
The breakout from this channel led to a shift in momentum.
Range Consolidation (Current Pattern)
After the breakout, BTC entered a sideways accumulation phase (marked by the red box).
Price is bouncing between $82,000 - $84,500, showing low volatility and indecision.
Breakout Possibility (Bullish Bias)
A break above $84,500 could confirm a bullish move towards $85,996 and beyond.
The next major target is $89,363, which aligns with previous resistance.
Support Retest (Bearish Risk)
If BTC fails to break resistance, we might see a retest of $80,000 or even $78,000.
A break below $77,320 would invalidate the bullish scenario.

Wed 19th Mar 2025 GBP/CHF Daily Forex Chart Sell SetupGood morning fellow traders. On my Daily Forex charts using the High Probability & Divergence trading methods from my books, I have identified a new trade setup this morning. As usual, you can read my notes on the chart for my thoughts on this setup. The trade being a GBP/CHF Sell. Enjoy the day all. Cheers. Jim

JNJ Update | Swing Trade 2 PlaysShort term price action is at a high in which I'd like to see a retracement for a short opportunity. The long term play I would like to buy once price is near $150 to hold towards $180.
Last Post
*A break below the trendline followed by a retest and rejection would invalidate the trend based on my bearish TA.*

JNJ Update | $120Been a while since I looked at NYSE:JNJ and it looks like we could see a drop towards $120 instead of going up to what was said in the old post.
Hourly/Daily price action is at a range high ($168 - $143) so I would expect a lot of selling pressure especially with how AMEX:SPY and TVC:RUT is performing right now.

NQ - Feb 20th FrameworkWednesday failed to expand through Tuesday range.
Weekly range currently in a consolidation.
Consolidation protocol active.
I am neutral on price until a sweep on the external range. Once a sweep occurs, I will hunt the 15m cisd and target the opposing liquidity. This will confirm the weekly profile & the intraday profile. Need the alignment for a high probability trade.
Anything internal is lower probability for my model. Price MUST take external liquidity.
Consolidation Reversal weekly profile likely. Mon - Wed in a range, Thursday raids external range then reverses, Friday offers continuation to opposing liquidity.

NVIDIA Update Trade the Range
Update from the previous video entitled *The next long to take . If the position was taken then you should be +20% as it stands . Currently approaching a key area for some resistance . Earnings in 16 days and i highlight the range I expect us to stay inside of until the news release

VINE LOOKS BEARISH THEN 90% OR 300% INCOMINGAfter a failed breakout of the all time highs, we have broken the uptrend and look to aim lower. Unless the highs are claimed I'm currently bearish and looking for range lows to be tested for a long entry to back to the highs which can print 90% returns.
Calculate Your Risk/Reward so you don't lose more than 1% of your account per trade.
Every day the charts provide new information. You have to adjust or get REKT.
Love it or hate it, hit that thumbs up and share your thoughts below!
This is not financial advice. This is for educational purposes only.

2 Points Risk 12 Points RewardsNSE:SOUTHBANK trade at 26. Stocks may touch its upper trendline at 36-40 with take a stoploss of 22-24.

$CELH Bounce Back January 2025 | +30% to +55% Upside PotentialNASDAQ:CELH
Celsius is going through a "drastic narrative issue" due to comments made by the CEO about a $120 million drop in sales. The issue is related to Pepsi orders, not overall sales. Pepsi had been overloading on Celsius inventory over the past year and is now trying to work through that excess inventory. Celsius' actual consumer demand has increased 10% year-over-year, so the sales decline is not a demand issue, but rather a Pepsi inventory management issue.
Celsius' ceiling is limited because Pepsi controls the distribution network, and Celsius has to "kneel to the king of Pepsi" in terms of order volumes. Based on Monster Energy’s multiples, Shay believes a fair valuation at $38-$42 (+40% to +55%). Pepsi’s inventory issue is a short-term headwind and we are confident in Celsius’ long-term growth potential.
On the technical side, there is a beautiful range trade opportunity from $27 up to $36 (+33%).
We are expecting this to bounce back heavily this January.
