KC COFFEE 50 Year Range Short-This might seem like a "troll trade" but Coffee is held this 50-year range since 1975.
-Price is high on the range and straight-up shorting getting out at a 50% gain seems like
a high probability trade.
Thoughts?
Rangetrading

70% Pump On The Horizon (:Massive Upside Potential.
Lows of the range has been swept. Next challenge is to break the trendline and continue upwards.
Calculate Your Risk/Reward so you don't lose more than 1% of your account per trade.
Every day the charts provide new information. You have to adjust or get REKT.
Love it or hate it, hit that thumbs up and share your thoughts below!
This is not financial advice. This is for educational purposes only.

Palantir will move after earnings so hold tight ! As long as Palantir remains within the upward channel, it’s still in play!
There’s an imbalance guiding the price, preventing it from dropping. We’ve seen the price attempt to go up twice already, so as long as Palantir stays within the channel and respects the imbalance, I’m quite confident it will make a third attempt to break the high.
On the other hand...
We have the earnings report coming up Monday pre-market, so whatever happens at the open, we’ll know which direction the price will take based on the report’s results.
Keep a close eye on this!
Best regards.

NVIDIA Waiting for the big day !!!! Although we closed last week with a candlestick pattern called an 'Inside Candle,' the following candle was green, but it didn’t exceed the last high (see slanted yellow arrow).
Nvidia is stronger than ever, but that doesn’t mean the price won’t take a pause or make a small pullback before its report; rather, the price is likely entering an accumulation phase, as everyone expects Nvidia’s upcoming quarterly report to show excellent earnings results.
So my forecast for Nvidia is that it will fluctuate between my point of interest as resistance and the yellow order block as support, but the most important moment here will be its earnings report day—that’s when the price will make a decision and direction.
Thank you for supporting my analysis.
TRADE SAFE
Best regards!"

2 Confirmations last week just as we planned, What's next? SPY PRICE HAS BEEN MOVING IN OUR FAVOR ! CHECK MY LAST WEEK ANALISIS,
Before we get to the analysis i just want to say...
So far, the price has moved in our favor. If you check the results of previous analyses, you’ll see that the price has moved exactly according to my analysis of price action, supported by institutional trading concepts.
Each green check mark represents a prediction that was correctly fulfilled according to the analysis from one week ago. My analyses are weekly, carefully prepared every weekend, but note: the study of price movement and the forecasted direction here, is based on my experience as a trader.
I DON’T KNOW WHERE THE PRICE IS HEADING!
IN FACT, NO ONE DOES!
Every price movement and behavior is based on a historical movement of institutional supply and demand. Based on the years I’ve spent studying this concept, I can predict the next price movements. However, it’s crucial to emphasize that trading is ultimately speculation, but if you have really good fundamental study in price action & structure, your margin of error will always be minimal.
So This analysis is for you but at the same time for entertainment purposes do not take trades because I'm greedy on any active, please do your own research first and you will have tyour final decision.
BACK TO SPY...
The price indeed broke out of the channel after we saw it crawling like a worm along the channel support.
Indeed, the price began to range after the channel breakout.
Looking at the overall structure, the price has been losing strength and volume since last week. I have a feeling we won’t see all-time highs soon, as it’s time for the price to start accumulating or simply making its natural pullback.
I'm expecting the next move to either be a pullback that touches my "order block" zone and then starts gaining momentum to recover all that decline, or, in another scenario, if we see enough volume on Monday, it could start fluctuating in a range to accumulate before touching new all-time highs.
BUT!
The price could reach highs while forming its accumulation range. However, what we’re looking for is a decision from the price to break out of the range and reach new highs along with a new extreme!
So be patient; this week will be very interesting to analyze in terms of price behavior.
Thank you for supporting my analysis.
TRADE SAFE!
Best regards

Palantir Validated a Liquidity Zone, Whats Next? If you saw my previous structural analysis, I had mentioned that Palantir was going to hit an institutional liquidity zone, and for the first time in several years, using common sense, the price was going to face rejection.
And that’s exactly what happened...
The price hit my point of interest and dropped for 3 days. However, the last candle with which we closed the week was green and had enough volume.
Why is this? If we can see 2 candles before the close, we can detect a trap that created a long wick downward, preventing the price from falling further. That’s the detail we're seeing before the week’s close—the last candle was bullish. We also can’t ignore that Palantir is only about 2 weeks away from its earnings report.
So, I don’t think the price will make a decisive move just yet, and even if it falls further, it would likely be around 38.50. However, the earnings strategy that traders are waiting for, where Palantir accumulates and begins to rise, is very close. So, we need to be very alert as we approach its earnings report on November 4th.
Best regards, and thank you for supporting my analysis.

Sellers unable to push USDCHF below 0.84; possible upward move?The U.S. dollar to Swiss franc currency pair (USD/CHF) had been trading sideways above a key support level on the daily chart, marking the lowest price since 2015. In addition, a double bottom pattern has formed, signaling that sellers have been unable to continue pushing the price below 0.8400.
On Friday, Oct. 4, the USDCHF broke out of its sideways pattern on the daily chart, indicating potential buying momentum. A possible upward movement could take the price to the 0.8800 level in a few days.
Hot US jobs report, lower-than-expected unemployment favours the dollar
From a macroeconomic standpoint, Friday’s US nonfarm payroll (NFP) data came in well above expectations (254,000 actual vs. 147,000 forecast), pointing to a robust labor market with potential incoming growth over the coming months, which tends to favor the USD.
The NFP data also appears to have led markets to price out expectations of an outsized 50-basis-point interest rate by the Federal Reserve at its upcoming meeting — which could have led to more weakening in the US dollar.
The dollar has also benefited from safe-haven flows amidst rising tensions in the Middle East, with the IDF starting ground operations in Lebanon and Iran unleashing a large-scale ballistic missile attack on Israel for the second time.
Therefore, from a technical standpoint, we can observe the following:
USD/CHF at its lowest level since 2015.
Formation of a double bottom on the daily chart.
Sideways movement above support.
Friday's breakout indicating a potential uptick in buying activity.
From a macroeconomic standpoint, the following factors are in play:
NFP data surpassed expectations (254,000 actual vs. 147,000 forecast).
Unemployment rate came in lower than expected (4.1% actual vs. 4.2% forecast).
Together, these factors suggest that USD/CHF could appreciate, potentially reaching 0.8800 in the near term.
Disclaimer:
74% of retail investor accounts lose money when trading CFDs with this provider. You should consider whether you understand how CFDs work and whether you can afford to take the high risk of losing your money. Past performance is not necessarily indicative of future results. The value of investments may fall as well as rise and the investor may not get back the amount initially invested. This content is not intended for nor applicable to residents of the UK.

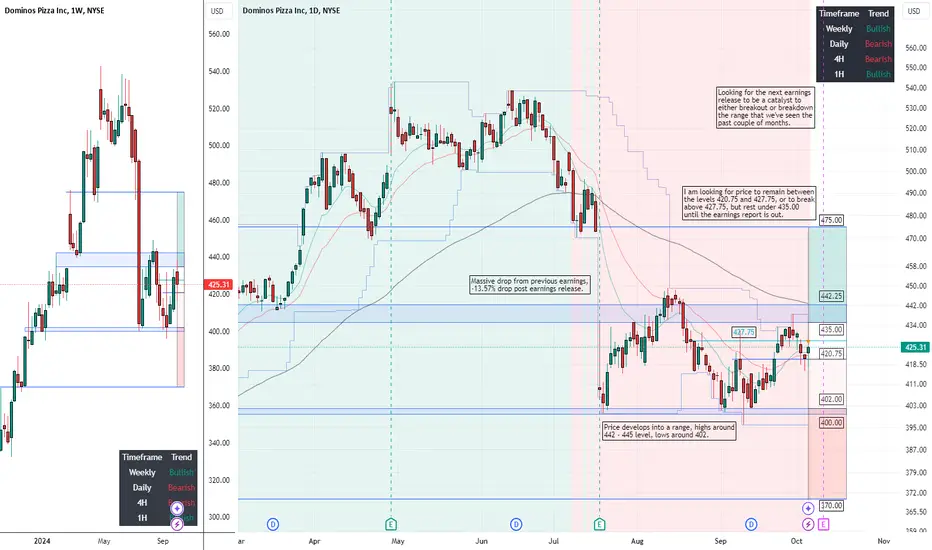
DOMINOS PIZZA $DPZ | RANGE BREAKOUT AFTER EARNINGS? - Oct 06 '24DOMINOS PIZZA NYSE:DPZ | RANGE BREAKOUT AFTER EARNINGS? - Oct 06 '24
BUY/LONG ZONE (GREEN): 435.00 - 475.00
DO NOT TRADE/DNT ZONE (WHITE): 420.75 - 435.00 (can be extended to 402.00 - 435.00)
SELL/SHORT ZONE (RED): 370.00 - 402.00 (can be extended to 370.00 - 420.75)
Weekly: DNT
Daily: Bearish
4H: Bearish
NYSE:DPZ saw a massive drop from previous earnings, -13.57% drop post earnings release. Price then develops into a range, highs around 442 - 445 level, lows around 402. I am looking for the next earnings release (Oct 10, pre market) to be a catalyst to either breakout or breakdown the range that we've seen the past couple of months. I am looking for price to remain between the levels 420.75 and 427.75, or to break above 427.75, but rest under 435.00 until the earnings report is out.
This is what I would personally look at before entering trades, everything is subject to change on a daily basis and as I analyze different timeframes and ideas.
ENTERTAINMENT PURPOSES ONLY, NOT FINANCIAL ADVICE!
trendanalysis, trendtrading, priceaction, priceactiontrading, technicalindicators, supportandresistance, rangebreakout, rangebreakdown, rangetrading, chartpatterntrading, chartpatterns, spy, sp500, s&p, fed, federalreserve, dominos, dominospizza, dpz, NYSE:DPZ , dominosearnings, earningsplay, earningstrade, dominospizzaearnings, dominospizzarange, rangetrade, earningssetup, dominospizzatrade, dominostrade, dpztrade, dpzearningsrelease, dominosiv, dominosoptions, dpzoptions, dpziv,
EURUSD Buy Off S&RWith the recent USD weakness and NFP news coming up, this could be a good opportunity for a buy trade to recent highs.

$AMZN: Fast Rebounds Reveal Fundamental Support LevelThe new technologies that Amazon is embracing, including robots/robotics, and a brilliant CEO keep this huge company moving forward.
The HFT-driven gap down in August was massive but the rebound was fast. This isn't the first time the stock has moved right back up to its prior quarter's fundamental support range, aka Dark Pool Buy Zone.
Now, NASDAQ:AMZN is slightly above that range to challenge the July high. A stock to watch ahead of its earnings report October 24th.

KOTAK BANK TRADE IN A NARROW RANGE SINCE LAST 4 YEARS...NSE:KOTAKBANK trade at 1785 level. Stocks weekly chart shows that its trade in a narrow range since last 4 year. You can watch for an upside move...

BAJAJ FINANCE may break the Range...NSE:BAJFINANCE trade at 7300 level. You can watch for next 8000 and after that breakout watch for 10000 level.

ADANI GREEN READY FOR RANGE BREAKOUT...NSE:ADANIGREEN trade at 1890 level. After breakout You can watch for next Resistance at 2500 and after that 3000.


BTCUSDT - RangeBTCUSDT is actively trading in a RANGE.
It is recommended to stay out of trading ranges as the unpredictability is high in ranges, as it's ACCUMULATING for sharp high volume move.
The plan of action is one of PATIENCE, if you enter too early it's not a strategy it's a GUESS, and we do not do that around here.
PATIENTLY wait for a breakout either buy side or short side and tailor your entry based on how the market reacts.

Trade in a Range...NSE:GALAXYSURF trade at 2935.
Support is at 2700
Resistance is at 3200.
You can watch it for next Resistance at 3500, After this it going to all time high...

Wait for Breakout...NSE:SRF trade at 2560 level. support is @ 2000 Resistance is @ 2800
Stock trade in 800 points range since last 3 years. You can watch it next resistance after breakout at 3200-3300.

Play In A Range...NSE:CIEINDIA trade at 585. Support at 520, Resistance at 620
You can watch it next Resistance at 720-740.

Bearish trend continuation for the weekThat's my idea for the current downtrend if we continue it. Nvidia earnings today at 10pm could be a factor for volatile price action. I see the possibility of a move up to the 1hr EMA50 at around $61.2k if earnings come out well. This is a scenario where we continue the current downtrend. Check out my bear scenario for this week here on tradingview to see the bigger picture. The level to keep an eye on is the $56k level as the price could be interesting there due to pools of liquidity. I have also marked the current price levels where we are again. These are the levels of the consolidation range we were in last week.

BTCUSDT RANGEBTCUSDT is once again in a range...
I am currently in a LONG position on BTCUSDT so luckily I am already in profit on this trade as I entered on the BIG VOLUME CANDLE.
Once again, that is what we are looking for, either candles with LARGE VOLUME going long, or short.
This is a perfect time to move up our SL and liquidate some of the position, as RANGES leave you in unknown territory.

Trade in a RANGE...NSE:SHOPERSTOP trade at 785. Support @ 690 & Resistence @ 860.
In the Range Next Resistence @ 950 after breakout you can watch it New All Time High...

Ethereum remains stuck in the same liquidity zoneEthereum remains stuck in the same liquidity zone. It has shown a bit of strength in the past few days, but the buying pressure is still not enough.
I invite you to check out my analysis on Bitcoin, as it’s currently in a bullish pattern that will cause Bitcoin to take off very soon, which will pull the entire crypto market, including ETH, along with it. So, for now, we are still in the same zone I indicated several weeks ago and moving sideways.
Thank you for supporting my analysis. For now, it's just a matter of waiting and continuing to buy for the next breakout!
Best regards.

Intel - Retest, reversal and rejection!NASDAQ:INTC has been establishing a slight bullish trend over the past couple of years.
A clear trend is the basis of every profitable trade, right? Yes and no. You should primarily focus on trading trends and entering positions during such phases. But Intel is a textbook example of a range bound stock; still there are trading opportunities everywhere. Currently Intel is retesting support and is starting to reverse towards the upside. But please: Manage your risk properly.
Levels to watch: $30, $45
Keep your long term vision,
Philip - BasicTrading
