CADJPY 1D RANGE BREAKOUTRanges are repeatable trading chart patterns.
Ranges are consolidation chart patterns that can breakout either direction.
Each chart pattern will have defining trendlines of the support/resistance levels creating the pattern.
What ever time frame you are trading this chart pattern, wait for a candle close outside of the trendline in the direction of the breakout candle. (Our time frame preference is the Daily chart).
Add volume indicator - Volume is the amount of $ that went into a particular candle or in Forex the # of trades that took place.
Add ATR indicator - Volatility is the amount of price movement that occurred. Use the ATR to measure the price movement.
When you see descending Volume bars and descending ATR line (which indicates volatility) this shows
a dis-interest in traders to invest in this pair creating consolidation which creates the chart pattern.
Trade Management after there is a breakout candle close.
1 - Position size (compare volume bar to volume ma line).
a - Breakout candle must be 100% of volume average for a full position size.
b - If 75% of volume average then ½ position size. (To find 75% of Volume
look at the charts volume settings – divide smaller # into larger # = 75%+)
If not 75% then stand aside from the trade.
2 – If candle breaks out of a trendline, 15m before the close of the day prepare your buy/sell order.
Enter two trades. 1st trade will have a SL & TP. It will close automatically when the 1st TP is hit. 2nd
trade only has a SL and will be allowed to run. When 1st TP is hit move the SL to breakeven. Look
at ATR and prepare SL at 1.5 of ATR. Prepare 1st trade TP at 1 of ATR.
3 - SL for both trades will be 1.5 x ATR.
4 - 1st trade TP will be 1 x ATR.
5 - No TP on 2nd trade – letting profit run and adjusting SL to follow price.
6 - When 1st TP hit – move 2nd trade SL to breakeven.
7 - Adjust the 2nd trade SL to follow price.
*8 – After Breakout candle – if price closes back into chart pattern close trade don't wait for SL to be hit.
*9 - When breakout candle is more than 1 ATR from breakout candle open.
a - Enter 1st trade at candle close with ½ position size.
b - Enter 2nd trade with a pending limit order that is 1 ATR of breakout candle open.
c – Price should pullback to that pending limit order for 2nd trade.
d – If Price returns back into chart pattern close trade before SL is hit.
Rangetrading

Losing friends #stocksFacebook is being cut from the portfolio today after breaking below range lows. The stock has been an underperformer since I bought it in the November and I am not going to wait around for it to get its act together. If we can get back over 275 and the downward trendline I will reconsider but for now the stock is a no touch. The twitter news is bad for twitter based on the price action today but I think it is equally bad for Facebook. Both are going to have to try to balance free speech with disinformation and I am not sure if either have the answers.

USOIL on a range move 🦐USOIL on the 4 h chart is moving inside a daily ascending channel.
After the last impulse until the resistance structure at 49 retraced at the 0.5 Fibonacci level.
The market started from there a range move.
IF the price will move up, according to Planctont's strategy we will set a nice long order.
--––
Follow the Shrimp 🦐
Keep in mind.
🟣 Purple structure -> Monthly structure.
🔴 Red structure -> Weekly structure.
🔵 Blue structure -> Daily structure.
🟡 Yellow structure -> 4h structure.
⚫️ Black structure -> <4h structure.
Here is the Plancton0618 technical analysis , please comment below if you have any question.
The ENTRY in the market will be taken only if the condition of the Plancton0618 strategy will trigger.

The channel watch #forexAfter the aud/usd breakout from the range (rectangle) in early December the stock has been trending upward in a channel steadily. For now the trend is definitely still to the upside but I am waiting to see if the channel breaks to the downside and through the near term support pivot at 0.7642 in the coming week. If we get a break to the downside then we may test the previous range (rectangle) high of 0.7413.

No more shineI did a post outlining my perspective on gold earlier this week but todays price action has changed the game. Gold started of the week on a positive note holding above the weekly range around 1910 (rectangle) but within the past couple of days it has sold off and now looks to be breakout out on the downside. The monthly rate of change has now also turned negative. If we see any strength next week back into the range area I am a seller with a stop above the high of today. If todays price action was any indication of the future we could see the late November lows (1767) be tested. I don't use fundamental analysis to make any trades but interests rates rising and any dollar strength could also be a headwind for the yellow metal

AUDNZD will move higher? 🦐AUDNZD is moving within a range between 2 structures.
The price formed a slightly declining channel.
According to Plancton's strategy if the conditions will be satisfied we will set a nice long order.
--––
Follow the Shrimp 🦐
Keep in mind.
🟣 Purple structure -> Monthly structure.
🔴 Red structure -> Weekly structure.
🔵 Blue structure -> Daily structure.
🟡 Yellow structure -> 4h structure.
⚫️ Black structure -> <4h structure.
Here is the Plancton0618 technical analysis , please comment below if you have any question.
The ENTRY in the market will be taken only if the condition of the Plancton0618 strategy will trigger.
Leave a comment that is helpful or encouraging. Let's master the markets together

EURJPY testing a minor resistance 🦐EURJPY on the 4 h chart broke the range between 2 structures.
The price is now testing a minor support over a dynamic trandline.
According to Plancton's strategy if the condition will be satisfied we will set a nice long order.
--––
Follow the Shrimp 🦐
Keep in mind.
🟣 Purple structure -> Monthly structure.
🔴 Red structure -> Weekly structure.
🔵 Blue structure -> Daily structure.
🟡 Yellow structure -> 4h structure.
⚫️ Black structure -> <4h structure.
Here is the Plancton0618 technical analysis , please comment below if you have any question.
The ENTRY in the market will be taken only if the condition of the Plancton0618 strategy will trigger.

CADCHF on a channel break 🦐CADCHF on the 4 chart is moving inside a descending channel.
The price has now approached the upper trendline and moving between 2 structures in a renage.
According to Plancton's strategy, we can set a nice long order if the condition will be satisfied.
–––––
Follow the Shrimp 🦐
Keep in mind.
• 🟣 Purple structure -> Monthly structure.
• 🔴 Red structure -> Weekly structure.
• 🔵 Blue structure -> Daily structure.
• 🟡 Yellow structure -> 4h structure.
• ⚫️ Black structure -> >4h structure.
Here is the Plancton0618 technical analysis , please comment below if you have any question.
The ENTRY in the market will be taken only if the condition of the Plancton0618 strategy will trigger.

FDX Decision Time at Bottom of the RangeGet it on the watchlist to see if it comes back into the range or rolls over in the coming days.
Neutral until price dictates the action.

EURGBP looking up 🦐EURGBP on the 4h chart is moving inside a descending channel.
The price is now consolidating between a daily support and a minor structure.
IF the price will move above the structure, according to Plancron's strategy we can set a nice long order.
--––
Follow the Shrimp 🦐
Keep in mind.
🟣 Purple structure -> Monthly structure.
🔴 Red structure -> Weekly structure.
🔵 Blue structure -> Daily structure.
🟡 Yellow structure -> 4h structure.
⚫️ Black structure -> <4h structure.
Here is the Plancton0618 technical analysis please comment below if you have any question.
The ENTRY in the market will be taken only if the condition of the Plancton0618 strategy will trigger.

CHFJPY on a range trading 🦐CHFJPY is moving inside a range.
The price after the last impulse tested the 0.618 fib level.
According to Plancton's strategy, if our condition will trigger, we can set a nice long order.
--––
Follow the Shrimp 🦐
Keep in mind.
🟣 Purple structure -> Monthly structure.
🔴 Red structure -> Weekly structure.
🔵 Blue structure -> Daily structure.
🟡 Yellow structure -> 4h structure.
⚫️ Black structure -> <4h structure.
Here is the Plancton0618 technical analysis , please comment below if you have any question.
The ENTRY in the market will be taken only if the condition of the Plancton0618 strategy will trigger.
Leave a comment that is helpful or encouraging. Let's master the markets together

NASDAQ on new high? 🦐NASDAQ on the 4h chart retraced until the 0.382.
The price is consolidating between 2 structures.
According to Plancton's strategy if the price will break above we will consider a long position
--––
Follow the Shrimp 🦐
Keep in mind.
🟣 Purple structure -> Monthly structure.
🔴 Red structure -> Weekly structure.
🔵 Blue structure -> Daily structure.
🟡 Yellow structure -> 4h structure.
⚫️ Black structure -> <4h structure.
Here is the Plancton0618 technical analysis , please comment below if you have any question.
The ENTRY in the market will be taken only if the condition of the Plancton0618 strategy will trigger.

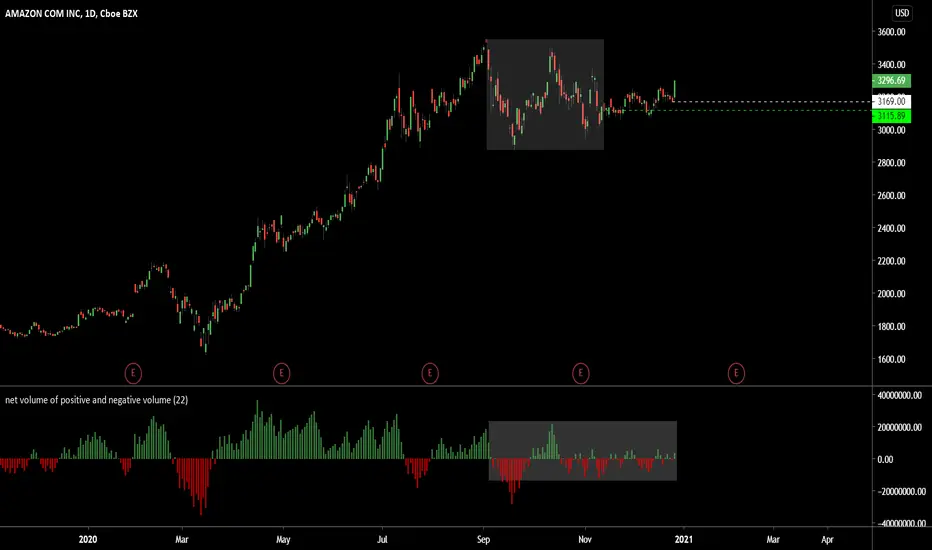
Are all-time highs in the cart?The range trade from November 13 has been like watching paint dry until today. You can see the overall decrease in the net volume amplitudes- a sign of little movement in either direction. With todays big move we now sit a little above the mid point of the range but where is amzn heading next? As long as the broader market uptrend remains intact amzn could be heading back toward all time highs. The reference point to watch is Fridays low 3169. If that holds the trade is still on and the highs of the range is our initial target
AGRX Long TradeSignals:
Terminal flag in Trading range - 3 bottom Buy Divergence on decreasing supply & Increasing demand. Four Month Non Climactic accumulation pattern
Entry 2.83
1st target $3
2nd Target $3.25-3.30
3rd Target Retest of 52W Highs
Stop Loss- $2.75
**May re-enter on Buy Stop above $3 if stopped out

NZDCHF 1D RANGE TRADINGRanges are repeatable trading chart patterns.
Ranges are consolidation chart patterns that can breakout either direction.
Each chart pattern will have defining trendlines of the support/resistance levels creating the pattern.
What ever time frame you are trading this chart pattern, wait for a candle close outside of the trendline in the direction of the breakout candle. (Our time frame preference is the Daily chart).
Add volume indicator - Volume is the amount of $ that went into a particular candle or in Forex the # of trades that took place.
Add ATR indicator - Volatility is the amount of price movement that occurred. Use the ATR to measure the price movement.
When you see descending Volume bars and descending ATR line (which indicates volatility) this shows
a dis-interest in traders to invest in this pair creating consolidation which creates the chart pattern.
Trade Management after there is a breakout candle close.
1 - Position size (compare volume bar to volume ma line).
a - Breakout candle must be 100% of volume average for a full position size.
b - If 75% of volume average then ½ position size. (To find 75% of Volume
look at the charts volume settings – divide smaller # into larger # = 75%+)
If not 75% then stand aside from the trade.
2 – If candle breaks out of a trendline, 15m before the close of the day prepare your buy/sell order.
Enter two trades. 1st trade will have a SL & TP. It will close automatically when the 1st TP is hit. 2nd
trade only has a SL and will be allowed to run. When 1st TP is hit move the SL to breakeven. Look
at ATR and prepare SL at 1.5 of ATR. Prepare 1st trade TP at 1 of ATR.
3 - SL for both trades will be 1.5 x ATR.
4 - 1st trade TP will be 1 x ATR.
5 - No TP on 2nd trade – letting profit run and adjusting SL to follow price.
6 - When 1st TP hit – move 2nd trade SL to breakeven.
7 - Adjust the 2nd trade SL to follow price.
*8 – After Breakout candle – if price closes back into chart pattern close trade don't wait for SL to be hit.
*9 - When breakout candle is more than 1 ATR from breakout candle open.
a - Enter 1st trade at candle close with ½ position size.
b - Enter 2nd trade with a pending limit order that is 1 ATR of breakout candle open.
c – Price should pullback to that pending limit order for 2nd trade.
d – If Price returns back into chart pattern close trade before SL is hit.

USDCHF ona. range move 🦐USDCHF is moving inside a descending channel and found support at the 0.88250 atrea.
The price after the last bearish leg couldn't move any lower and start a range between the 2 structures.
If the market will break above the structure and consequently breaks the channel we will set a nice long order according to Plancton's strategy.
--––
Follow the Shrimp 🦐
Keep in mind.
🟣 Purple structure -> Monthly structure.
🔴 Red structure -> Weekly structure.
🔵 Blue structure -> Daily structure.
🟡 Yellow structure -> 4h structure.
⚫️ Black structure -> <4h structure.
Here is the Plancton0618 technical analysis , please comment below if you have any question.
The ENTRY in the market will be taken only if the condition of the Plancton0618 strategy will trigger.
Leave a comment that is helpful or encouraging. Let's master the markets together.
Leave a comment that is helpful or encouraging. Let's master the markets together

Possible Range Tradeif the price closes back in the range, i will enter a short.
TP: Range EQ
SL: Above Alltime high
gives RR 2.5

KC on a retest of the support 🦐KC after the last impulse at 134 level retraced back until the 0.786 of the previous leg at the 102 level.
From there the market started a new leg up until the daily resistance at 124.
Price retraced back and moved in a range between the 0.382 over a support and the resistance structure and recently broke above.
IF the price will not break below and give us new sign of inversion will be set a nice long order according to Plancton' s strategy.
–––––
Follow the Shrimp 🦐
Keep in mind.
🟣 Purple structure -> Monthly structure.
🔴 Red structure -> Weekly structure.
🔵 Blue structure -> Daily structure.
🟡 Yellow structure -> 4h structure.
⚫️ Black structure -> <4h structure.
Here is the Plancton0618 technical analysis , please comment below if you have any question.
The ENTRY in the market will be taken only if the condition of the Plancton0618 strategy will trigger.
USDJPY 1D RANGE TRADINGRanges are repeatable trading chart patterns.
Ranges are consolidation chart patterns that can breakout either direction.
Each chart pattern will have defining trendlines of the support/resistance levels creating the pattern.
What ever time frame you are trading this chart pattern, wait for a candle close outside of the trendline in the direction of the breakout candle. (Our time frame preference is the Daily chart).
Add volume indicator - Volume is the amount of $ that went into a particular candle or in Forex the # of trades that took place.
Add ATR indicator - Volatility is the amount of price movement that occurred. Use the ATR to measure the price movement.
When you see descending Volume bars and descending ATR line (which indicates volatility) this shows
a dis-interest in traders to invest in this pair creating consolidation which creates the chart pattern.
Trade Management after there is a breakout candle close.
1 - Position size (compare volume bar to volume ma line).
a - Breakout candle must be 100% of volume average for a full position size.
b - If 75% of volume average then ½ position size. (To find 75% of Volume
look at the charts volume settings – divide smaller # into larger # = 75%+)
If not 75% then stand aside from the trade.
2 – If candle breaks out of a trendline, 15m before the close of the day prepare your buy/sell order.
Enter two trades. 1st trade will have a SL & TP. It will close automatically when the 1st TP is hit. 2nd
trade only has a SL and will be allowed to run. When 1st TP is hit move the SL to breakeven. Look
at ATR and prepare SL at 1.5 of ATR. Prepare 1st trade TP at 1 of ATR.
3 - SL for both trades will be 1.5 x ATR.
4 - 1st trade TP will be 1 x ATR.
5 - No TP on 2nd trade – letting profit run and adjusting SL to follow price.
6 - When 1st TP hit – move 2nd trade SL to breakeven.
7 - Adjust the 2nd trade SL to follow price.
*8 – After Breakout candle – if price closes back into chart pattern close trade don't wait for SL to be hit.
*9 - When breakout candle is more than 1 ATR from breakout candle open.
a - Enter 1st trade at candle close with ½ position size.
b - Enter 2nd trade with a pending limit order that is 1 ATR of breakout candle open.
c – Price should pullback to that pending limit order for 2nd trade.
d – If Price returns back into chart pattern close trade before SL is hit.

USDJPY 103.96 - 0.25 % * PRICE ACTION INTRA-DAY OPPORTUNITYHey everyone
A look at the DOLLAR / YEN the pair has been range bound within support & resistance structure perfect opportunities for the more aggressive trader.
if you are looking to hold the pair swing we wait for that break out and confirmations of the move.
many stars must align with the plan before executing the trade, kindly follow your rules.
LET'S SEE HOW IT GOES..
HAPPY TRADING EVERYONE & LET YOUR WINS RUN...
_________________________________________________________________________________________________________________________
ENTRY & SL - FOLLOW YOUR RULES
here's some of my rules if they help.
1. look at structure be it descending channels, pennants and so forth.
2. RSI is overbought/oversold so will be looking for a pull back to structure before continuation.
3. will be looking for entries from 30M , 1H, 2H & 4H time-frames if taking the trade long term.
4. aggressive trades can be executed on the pull back
5. price action must definitely align with the plan.'
6. structure definitely
7. the 20 EMA must be respected as support / see a bounce at this structure
8. FIBONACCI EXTENSIONS AS GUIDELINES FOR SL & TP'S .
9. CANDLE STICK PATTERNS.
so i will most like's enter this one in a bit but i hope this idea assists in any way on your trading plan.
RISK-MANAGEMENT
PERIOD - SWING TRADE
__________________________________________________________________________________________________________________________
If this idea helps with your trading plan kindly leave a like definitely appreciate it.

MSCI SINGAPORE INDEX ready for a new bullish run 🦐MSCI SINGAPORE futures after the nice impulse until the 333 level started a retracement move.
The market touches the 0.382 Fibonacci level over a support structure and started a consolidation move.
IF the price will break and close above the minor resistance structure, we can set a nice long order according to Plancton's strategy.
--––
Follow the Shrimp 🦐
Keep in mind.
🟣 Purple structure -> Monthly structure.
🔴 Red structure -> Weekly structure.
🔵 Blue structure -> Daily structure.
🟡 Yellow structure -> 4h structure.
⚫️ Black structure -> <4h structure.
Here is the Plancton0618 technical analysis , please comment below if you have any question.
The ENTRY in the market will be taken only if the condition of the Plancton0618 strategy will trigger.
Leave a comment that is helpful or encouraging. Let's master the markets together.

GOLD waiting for the break ? 🦐GOLD on the 4h chart after the nice bullish impulse reached the 1838 level.
The price started a minor range between 2 structures between daily support and a weekly resistance.
We would wait for a break above for a long position and a break below of the range in order to consider a short position in the market.
--––
Follow the Shrimp 🦐
Keep in mind.
🟣 Purple structure -> Monthly structure.
🔴 Red structure -> Weekly structure.
🔵 Blue structure -> Daily structure.
🟡 Yellow structure -> 4h structure.
⚫️ Black structure -> <4h structure.
Here is the Plancton0618 technical analysis , please comment below if you have any question.
The ENTRY in the market will be taken only if the condition of the Plancton0618 strategy will trigger

NFLX Ranging.... STILLLonger the range the bigger the break out. Don't miss NFLX on this one. Price is at the bottom of the range a long debit or deep in the money call could pay off huge if we break this range to the upside. Stop loss is simple, break below bottom support with conviction.
