DOMINOs PIZZA 1W BLUG FLAG LONG TRADEBull Flags are repeatable Range trading chart patterns.
Bull Flag chart pattern will have a directional bias depending on the previous incoming trend.
Each chart pattern will have defining trendlines of the support/resistance levels creating the pattern.
What ever time frame you are trading this chart pattern, wait for a candle close outside of the trendline in the direction of the breakout candle. (Our time frame preference is the Daily chart).
Add volume indicator - Volume is the amount of $ that went into a particular candle or in Forex the # of trades that took place.
Add ATR indicator - Volatility is the amount of price movement that occurred. Use the ATR to measure the price movement.
When you see descending Volume bars and descending ATR line (which indicates volatility) this shows
a dis-interest in traders to invest in this pair creating consolidation which creates the chart pattern.
Trade Management after there is a breakout candle close.
1 - Position size (compare volume bar to volume ma line).
a - Breakout candle must be 100% of average volume for a full position size.
b - If 75% of average volume then ½ position size. (To find 75% of Volume
look at the charts volume settings – divide smaller # into larger # = 75%+)
2 - Enter two trades.
3 - SL for both trades will be 1.5 x ATR.
4 - 1st trade TP will be 1 x ATR.
5 - No TP on 2nd trade – letting profit run and adjusting SL to follow price.
6 - When 1st TP hit – move 2nd trade SL to breakeven.
7 - Adjust the 2nd trade SL to follow price.
*8 – After Breakout candle – if price closes back into chart pattern close trade
*9 - When breakout candle is more than 1 ATR from breakout candle open.
a - Enter 1st trade at candle close with ½ position size.
b - Enter 2nd trade with a pending limit order that is 1 ATR of breakout candle open.
c – Price should pullback to that pending limit order for 2nd trade.
d – If Price returns back into chart pattern close trade before SL is hit.
Rangetrading

PRICE ACTION FLOW CHART USING 50 SMA & 100 SMAThis Price Action Flow Chart was provided by Jennifer Thornberg

AUDCAD 1D RANGE TRADESRanges are repeatable trading chart patterns.
Ranges are consolidation chart patterns that can breakout either direction.
Each chart pattern will have defining trendlines of the support/resistance levels creating the pattern.
What ever time frame you are trading this chart pattern, wait for a candle close outside of the trendline in the direction of the breakout candle. (Our time frame preference is the Daily chart).
Add volume indicator - Volume is the amount of $ that went into a particular candle or in Forex the # of trades that took place.
Add ATR indicator - Volatility is the amount of price movement that occurred. Use the ATR to measure the price movement.
When you see descending Volume bars and descending ATR line (which indicates volatility) this shows
a dis-interest in traders to invest in this pair creating consolidation which creates the chart pattern.
Trade Management after there is a breakout candle close.
1 - Position size (compare volume bar to volume ma line).
a - Breakout candle must be 100% of average volume for a full position size.
b - If 75% of average volume then ½ position size. (To find 75% of Volume
look at the charts volume settings – divide smaller # into larger # = 75%+)
2 - Enter two trades.
3 - SL for both trades will be 1.5 x ATR.
4 - 1st trade TP will be 1 x ATR.
5 - No TP on 2nd trade – letting profit run and adjusting SL to follow price.
6 - When 1st TP hit – move 2nd trade SL to breakeven.
7 - Adjust the 2nd trade SL to follow price.
*8 – After Breakout candle – if price closes back into chart pattern close trade
*9 - When breakout candle is more than 1 ATR from breakout candle open.
a - Enter 1st trade at candle close with ½ position size.
b - Enter 2nd trade with a pending limit order that is 1 ATR of breakout candle open.
c – Price should pullback to that pending limit order for 2nd trade.
d – If Price returns back into chart pattern close trade before SL is hit.

CADJPY possible short.Hello guys, I found a good opportunity. Just want to tell you to wait for the downtrend confirmation, so we don't get fooled by a zone breakout.

USDJPY 1D BEAR FLAG SHORT TRADEBear Flags are in the Range chart pattern family group.
Bear Flags are repeatable trading chart patterns.
Bear Flag chart patterns will have a directional bias depending on the previous incoming trend.
Each chart pattern will have defining trendlines of the support/resistance levels creating the pattern.
What ever time frame you are trading this chart pattern, wait for a candle close outside of the trendline in the direction of the breakout candle. (Our time frame preference is the Daily chart).
Add volume indicator - Volume is the amount of $ that went into a particular candle or in Forex the # of trades that took place.
Add ATR indicator - Volatility is the amount of price movement that occurred. Use the ATR to measure the price movement.
When you see descending Volume bars and descending ATR line (which indicates volatility) this shows
a dis-interest in traders to invest in this pair creating consolidation which creates the chart pattern.
Trade Management after there is a breakout candle close.
1 - Position size (compare volume bar to volume ma line).
a - Breakout candle must be 100% of average volume for a full position size.
b - If 75% of average volume then ½ position size. (To find 75% of Volume
look at the charts volume settings – divide smaller # into larger # = 75%+)
2 - Enter two trades.
3 - SL for both trades will be 1.5 x ATR.
4 - 1st trade TP will be 1 x ATR.
5 - No TP on 2nd trade – letting profit run and adjusting SL to follow price.
6 - When 1st TP hit – move 2nd trade SL to breakeven.
7 - Adjust the 2nd trade SL to follow price.
*8 – After Breakout candle – if price closes back into chart pattern close trade
*9 - When breakout candle is more than 1 ATR from breakout candle open.
a - Enter 1st trade at candle close with ½ position size.
b - Enter 2nd trade with a pending limit order that is 1 ATR of breakout candle open.
c – Price should pullback to that pending limit order for 2nd trade.
d – If Price returns back into chart pattern close trade before SL is hit.

BTCUSD RANGE BAR STRATEGYBest Range Trading Strategy
In this section, you’ll learn a simple range trading strategy.
Range bars can help us identify support and resistance levels with the precision of a surgeon.
That explains why this is the best range trading strategy.
Once we have identified the support and resistance level, we let the market do his thing
Note* For the purpose of this range bar strategy we’re using a range bar size of 10.00. This means each bar is printed once we traveled at least 10.00 in one or the other direction.
Once the support level is tagged by the range bar we wait for price formation that includes 3 countertrend bars.
You just need to open a new position when the fourth bar is printed on the chart.
The three consecutive countertrend bars simply show range expansion trading.
This is a clear shift in the trend direction.
The protective stop-loss order can safely be placed above the 3 range bar pattern. Stop losses are one of the most effective ways for traders to control their exposure to risk.
Let’s now learn how to trade range bars using indicators.
We’re only going to use the MFI indicator.
For more info on how to use the Money Flow Index check TSG blog: Money Flow Index – Trading like the Banks.
Through this range bar trading strategy we’re going to use the MFI indicator to confirm the buying and selling pressures behind the range bar expansion.
For example, when the range bar expands on the upside, we want to make sure this is due to buying activity.
We’re just using the MFI indicator as a confirmation tool.
If you’re tired finding success with the traditional candlestick price chart you’ll find some value in doing some research and backtesting the range bar tool. If you’re looking for a more all-inclusive range trading strategy with an effective tool to time your entries and exit points you’re way better off using the Bar Range indicator on your current trading platform.
With the best range trading strategy, you have the ability to see the market structure a little bit more clearly. If the market doesn’t move, there are no trading opportunities. If there are no trade opportunities, then we can’t make money. The range bar tool helps us identify when a trading opportunity shows up.

PLANET FITNESS 1D RANGE TRADESRanges are repeatable trading chart patterns.
Ranges are consolidation chart patterns that can breakout either direction.
Each chart pattern will have defining trendlines of the support/resistance levels creating the pattern.
What ever time frame you are trading this chart pattern, wait for a candle close outside of the trendline in the direction of the breakout candle. (Our time frame preference is the Daily chart).
Add volume indicator - Volume is the amount of $ that went into a particular candle or in Forex the # of trades that took place.
Add ATR indicator - Volatility is the amount of price movement that occurred. Use the ATR to measure the price movement.
When you see descending Volume bars and descending ATR line (which indicates volatility) this shows
a dis-interest in traders to invest in this pair creating consolidation which creates the chart pattern.
Trade Management after there is a breakout candle close.
1 - Position size (compare volume bar to volume ma line).
a - Breakout candle must be 100% of average volume for a full position size.
b - If 75% of average volume then ½ position size. (To find 75% of Volume
look at the charts volume settings – divide smaller # into larger # = 75%+)
2 - Enter two trades.
3 - SL for both trades will be 1.5 x ATR.
4 - 1st trade TP will be 1 x ATR.
5 - No TP on 2nd trade – letting profit run and adjusting SL to follow price.
6 - When 1st TP hit – move 2nd trade SL to breakeven.
7 - Adjust the 2nd trade SL to follow price.
*8 – After Breakout candle – if price closes back into chart pattern close trade
*9 - When breakout candle is more than 1 ATR from breakout candle open.
a - Enter 1st trade at candle close with ½ position size.
b - Enter 2nd trade with a pending limit order that is 1 ATR of breakout candle open.
c – Price should pullback to that pending limit order for 2nd trade.
d – If Price returns back into chart pattern close trade before SL is hit.

What is a Range-Bound Market?Sometimes, price bounces between two specific levels for long periods of time. In times like these, we have what we call a “ranging market.”
LEARN MORE

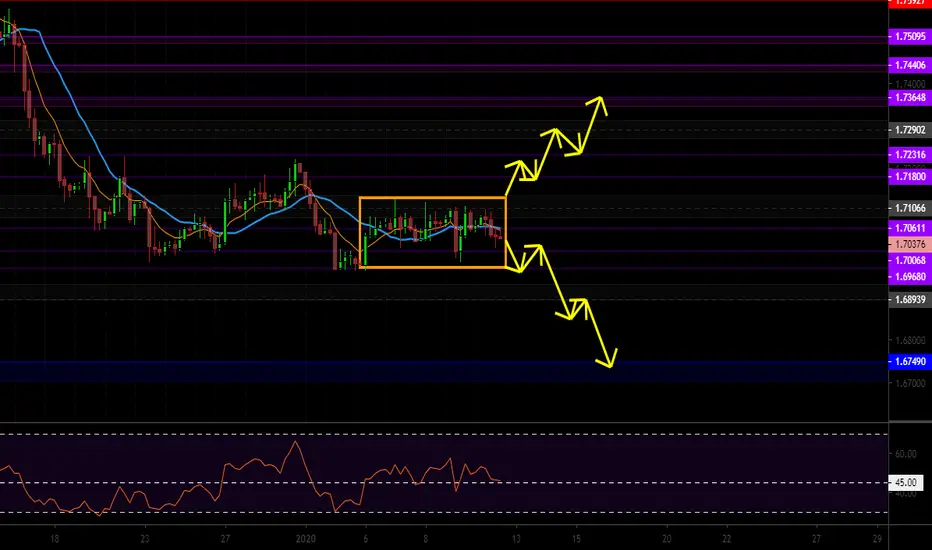
In a Range Awaiting BreakoutWe are in a range according to the 4hr.
According to the monthly and weekly, We are in the middle of a bear run. This range is several days long so far, so we are waiting for a breakout trade for this one to be active.
Don't know when that will happen. So you can range trade until it breakout, or you can wait until it's free. Your choice.
BEAR TPS:
• 1.70068
• 1.69680
• 1.69298
• 1.68939
• 1.67490
BULL TPS:
• 1.71354
• 1.71800
• 1.72316
• 1.72902
Range trading: Forex as for 03/01/2020Under that heading we publish signals of the indicator called “Ranger” . It was developed by our experts for intraday trading purposes.
This indicator is based on statistical analysis of the data and provides information about possible maximum/minimum values of the day (just right after the day has started) with certain probabilities.
What does this information give to the trader? Actually, a lot. First of all, trading signals. For example, if during a day the price approaches the upper (lower) mark, it can be concluded that it will not go higher (lower) prescribed mark today with already known probability. So, you can open a position opposite to the current movement, knowing in advance that it will be profitable with a certain probability.
EURUSD
Long position 1
(The price today will not fall below this mark with a probability of 68%) 1.1134
Long position 2
(The price today will not fall below this mark with a probability of 95%) 1.1113
Long position 3
(The price today will not fall below this mark with a probability of 99%) 1.1092
Short position 1
(The price today will not rise above this mark with a probability of 68%) 1.1208
Short position 2
(The price today will not rise above this mark with a probability of 95%) 1.1230
Short position 3
(The price today will not rise above this mark with a probability of 99%) 1.1251
GBPUSD
Long position 1
(The price today will not fall below this mark with a probability of 68%) 1.3047
Long position 2
(The price today will not fall below this mark with a probability of 95%) 1.2974
Long position 3
(The price today will not fall below this mark with a probability of 99%) 1.2902
Short position 1
(The price today will not rise above this mark with a probability of 68%) 1.3219
Short position 2
(The price today will not rise above this mark with a probability of 95%) 1.3291
Short position 3
(The price today will not rise above this mark with a probability of 99%) 1.3364
USDJPY
Long position 1
(The price today will not fall below this mark with a probability of 68%) 108.19
Long position 2
(The price today will not fall below this mark with a probability of 95%) 107.98
Long position 3
(The price today will not fall below this mark with a probability of 99%) 107.77
Short position 1
(The price today will not rise above this mark with a probability of 68%) 108.44
Short position 2
(The price today will not rise above this mark with a probability of 95%) 108.65
Short position 3
(The price today will not rise above this mark with a probability of 99%) 108.85
Calculations are based on the historical data and history doesn’t necessarily repeat this particular day. Recall, that mentioned probabilities are not 100% and do not guarantee risk-free trading.

Range trading: Crypto currency market as for 03/01/2020Under that heading we publish signals of the indicator called “Ranger” . It was developed by our experts for intraday trading purposes.
This indicator is based on statistical analysis of the data and provides information about possible maximum/minimum values of the day (just right after the day has started) with certain probabilities.
What does this information give to the trader? Actually, a lot. First of all, trading signals. For example, if during a day the price approaches the upper (lower) mark, it can be concluded that it will not go higher (lower) prescribed mark today with already known probability. So, you can open a position opposite to the current movement, knowing in advance that it will be profitable with the certain probability.
BTCUSD
Long position 1
(The price today will not fall below this mark with a probability of 68%) 6997
Long position 2
(The price today will not fall below this mark with a probability of 95%) 6797
Long position 3
(The price today will not fall below this mark with a probability of 99%) 6598
Short position 1
(The price today will not rise above this mark with a probability of 68%) 7122
Short position 2
(The price today will not rise above this mark with a probability of 95%) 7322
Short position 3
(The price today will not rise above this mark with a probability of 99%) 7522
ETHUSD
Long position 1
(The price today will not fall below this mark with a probability of 68%) 123.80
Long position 2
(The price today will not fall below this mark with a probability of 95%) 119.67
Long position 3
(The price today will not fall below this mark with a probability of 99%) 115.53
Short position 1
(The price today will not rise above this mark with a probability of 68%) 131.55
Short position 2
(The price today will not rise above this mark with a probability of 95%) 135.68
Short position 3
(The price today will not rise above this mark with a probability of 99%) 139.82
XRPUSD
Long position 1
(The price today will not fall below this mark with a probability of 68%) 0.1853
Long position 2
(The price today will not fall below this mark with a probability of 95%) 0.1786
Long position 3
(The price today will not fall below this mark with a probability of 99%) 0.1720
Short position 1
(The price today will not rise above this mark with a probability of 68%) 0.1930
Short position 2
(The price today will not rise above this mark with a probability of 95%) 0.1997
Short position 3
(The price today will not rise above this mark with a probability of 99%) 0.2063
Calculations are based on the historical data and history doesn’t necessarily repeat this particular day. Recall, that mentioned probabilities are not 100% and do not guarantee risk-free trading.

GBPUSD 15M NEW LONDON OPENING BREAKOUT TRADING STRATEGYRule #1 Define the London Trading Range
We’re going to use the range definition that takes into consideration only the body of the candles, excluding the wicks.
Note* this trading rule can be adapted as you get more experienced at reading the price action.
Who knows, maybe you’ll be able to discover some price action tendencies around the London open that no-ones was able to see.
In the GBP/USD chart we’ve outlined the trading range:
The London open breakout strategy works because the Asia trading range tends to attract buy and sell stops above and below the trading range.
The bulk of buying and selling stops becomes an easy target for smart money.
Remember that traders need liquidity to execute their orders.
And, the smart money is always in search of liquidity to fill their large orders. That’s the reason why smart money needs to trigger those stops.
Rule #2: The One-Hour before the London Open Needs to Generate the Breakout
Our backtesting results revealed that momentum really starts to pick up 1-hour earlier than the
actual London opening session.
There are some smart ways to trade this burst of momentum.
Let’s see some technical ways to trade the pre-London open.
We don’t need to guess in which way the market will break, we let the market tip his hand and show us the way.
This is where things get interesting.
Let me explain…
During the London session, we’re going to see the most traded volume thus the foreign exchange market should really take off in one direction or another.
From our example, we can note the GBP/USD one-sided move.
We didn’t have any interruptions in the momentum activity, and that’s the KEY for this whole trading setup to work.
Let’s now outline the second technical element you want to see with the London setup.
Rule #3 Buy the London Open Breakout
Immediately after the London session opens, we want to see the price fading the pre-open move.
If the price move starts fading, we know it was a false breakout
The smart money has used the pre-open move to trigger the stops below the range and now they reverse the tie and start buying.
We want to see price pulling back into the range at the same speed as it went up.
In simple words, the bullish momentum used to produce the false breakout needs to be equal to the bearish momentum used to fade the pre-open move.
We enter our trade after the first 5-minutes have confirmed that the price is reversing.
Once this trade setup is completed, you should see a price formation that takes the V-shaped form (or inverse V-shape).
Let’s now explore what methods you can use to cash in the profits.
Rule #4 Take Profit or Ride the Trend
We can measure the size of the Asia trading range and project that, from the top or bottom of our range to get our profit target.
But, oftentimes this type of setup can lead to a trading day that can extend in the days to come.
Now, in this case, it’s wise if you employ other trading tactics so you can actually profit from this trend.
In this example, the better take profit strategy would be to use a trailing stop.
You need to be ready to explore other trading methods to manage your trades.
Protecting the downside is as important as making money.
Rule #5 Use a Time Stop Instead of a Price Stop
In order to fade the London breakout, you need to use unconventional trading methods.
In this regard, for our stop loss trading strategy we’re going to use a time stop instead of a price stop.
The first time I’ve ever heard about the time stop concept was while reading the Market Wizards book.
Billionaire Hedge Fund manager Paul Tudor Jones one of the greatest traders of our times said:
“When I trade, I don’t just use a price stop, I also use a time stop.”
If you want to get a glimpse into the mindset of the most successful traders and hedge fund managers, please read: Top Trading Quotes of All Time - Learn to Trade.
So, do you want to know how to apply the time stop to the London strategy?
It’s very simple…
If in the first hour after the London open the price didn’t COMPLETELY reverse the pre-opening breakout, we exit the trade.
It’s simple as that, no further explanation is needed.

Range trading: Forex as for 31/12/2019Under that heading we publish signals of the indicator called “Ranger” . It was developed by our experts for intraday trading purposes.
This indicator is based on statistical analysis of the data and provides information about possible maximum/minimum values of the day (just right after the day has started) with certain probabilities.
What does this information give to the trader? Actually, a lot. First of all, trading signals. For example, if during a day the price approaches the upper (lower) mark, it can be concluded that it will not go higher (lower) prescribed mark today with already known probability. So, you can open a position opposite to the current movement, knowing in advance that it will be profitable with a certain probability.
EURUSD
Long position 1
(The price today will not fall below this mark with a probability of 68%) 1.1171
Long position 2
(The price today will not fall below this mark with a probability of 95%) 1.1149
Long position 3
(The price today will not fall below this mark with a probability of 99%) 1.1129
Short position 1
(The price today will not rise above this mark with a probability of 68%) 1.1242
Short position 2
(The price today will not rise above this mark with a probability of 95%) 1.1263
Short position 3
(The price today will not rise above this mark with a probability of 99%) 1.12684
GBPUSD
Long position 1 [/b
(The price today will not fall below this mark with a probability of 68%) 1.3034
Long position 2
(The price today will not fall below this mark with a probability of 95%) 1.2961
Long position 3
(The price today will not fall below this mark with a probability of 99%) 1.2888
Short position 1
(The price today will not rise above this mark with a probability of 68%) 1.3212
Short position 2
(The price today will not rise above this mark with a probability of 95%) 1.3285
Short position 3
(The price today will not rise above this mark with a probability of 99%) 1.3358
USDJPY
Long position 1
(The price today will not fall below this mark with a probability of 68%) 108.51
Long position 2
(The price today will not fall below this mark with a probability of 95%) 108.30
Long position 3
(The price today will not fall below this mark with a probability of 99%) 108.08
Short position 1
(The price today will not rise above this mark with a probability of 68%) 109.00
Short position 2
(The price today will not rise above this mark with a probability of 95%) 109.21
Short position 3
(The price today will not rise above this mark with a probability of 99%) 109.43
Calculations are based on the historical data and history doesn’t necessarily repeat this particular day. Recall, that mentioned probabilities are not 100% and do not guarantee risk-free trading.

Range trading: Forex as for 30/12/2019Under that heading we publish signals of the indicator called “Ranger” . It was developed by our experts for intraday trading purposes.
This indicator is based on statistical analysis of the data and provides information about possible maximum/minimum values of the day (just right after the day has started) with certain probabilities.
What does this information give to the trader? Actually, a lot. First of all, trading signals. For example, if during a day the price approaches the upper (lower) mark, it can be concluded that it will not go higher (lower) prescribed mark today with already known probability. So, you can open a position opposite to the current movement, knowing in advance that it will be profitable with a certain probability.
EURUSD
Long position 1
(The price today will not fall below this mark with a probability of 68%) 1.1165
Long position 2
(The price today will not fall below this mark with a probability of 95%) 1.1143
Long position 3
(The price today will not fall below this mark with a probability of 99%) 1.1121
Short position 1
(The price today will not rise above this mark with a probability of 68%) 1.1218
Short position 2
(The price today will not rise above this mark with a probability of 95%) 1.1240
Short position 3
(The price today will not rise above this mark with a probability of 99%) 1.1262
GBPUSD
Long position 1 [/b
(The price today will not fall below this mark with a probability of 68%) 1.3017
Long position 2
(The price today will not fall below this mark with a probability of 95%) 1.2945
Long position 3
(The price today will not fall below this mark with a probability of 99%) 1.2873
Short position 1
(The price today will not rise above this mark with a probability of 68%) 1.3183
Short position 2
(The price today will not rise above this mark with a probability of 95%) 1.3256
Short position 3
(The price today will not rise above this mark with a probability of 99%) 1.3328
USDJPY
Long position 1
(The price today will not fall below this mark with a probability of 68%) 109.12
Long position 2
(The price today will not fall below this mark with a probability of 95%) 108.90
Long position 3
(The price today will not fall below this mark with a probability of 99%) 108.68
Short position 1
(The price today will not rise above this mark with a probability of 68%) 109.43
Short position 2
(The price today will not rise above this mark with a probability of 95%) 109.64
Short position 3
(The price today will not rise above this mark with a probability of 99%) 109.86
Calculations are based on the historical data and history doesn’t necessarily repeat this particular day. Recall, that mentioned probabilities are not 100% and do not guarantee risk-free trading.

Range trading: Crypto currency market as for 30/12/2019 Under that heading we publish signals of the indicator called “Ranger” . It was developed by our experts for intraday trading purposes.
This indicator is based on statistical analysis of the data and provides information about possible maximum/minimum values of the day (just right after the day has started) with certain probabilities.
What does this information give to the trader? Actually, a lot. First of all, trading signals. For example, if during a day the price approaches the upper (lower) mark, it can be concluded that it will not go higher (lower) prescribed mark today with already known probability. So, you can open a position opposite to the current movement, knowing in advance that it will be profitable with the certain probability.
BTCUSD
Long position 1
(The price today will not fall below this mark with a probability of 68%) 7110
Long position 2
(The price today will not fall below this mark with a probability of 95%) 6908
Long position 3
(The price today will not fall below this mark with a probability of 99%) 6706
Short position 1
(The price today will not rise above this mark with a probability of 68%) 7567
Short position 2
(The price today will not rise above this mark with a probability of 95%) 7770
Short position 3
(The price today will not rise above this mark with a probability of 99%) 7971
ETHUSD
Long position 1
(The price today will not fall below this mark with a probability of 68%) 129.03
Long position 2
(The price today will not fall below this mark with a probability of 95%) 124.69
Long position 3
(The price today will not fall below this mark with a probability of 99%) 120.35
Short position 1
(The price today will not rise above this mark with a probability of 68%) 139.35
Short position 2
(The price today will not rise above this mark with a probability of 95%) 143.69
Short position 3
(The price today will not rise above this mark with a probability of 99%) 148.03
XRPUSD
Long position 1
(The price today will not fall below this mark with a probability of 68%) 0.1896
Long position 2
(The price today will not fall below this mark with a probability of 95%) 0.1828
Long position 3
(The price today will not fall below this mark with a probability of 99%) 0.1760
Short position 1
(The price today will not rise above this mark with a probability of 68%) 0.2037
Short position 2
(The price today will not rise above this mark with a probability of 95%) 0.2105
Short position 3
(The price today will not rise above this mark with a probability of 99%) 0.2173
Calculations are based on the historical data and history doesn’t necessarily repeat this particular day. Recall, that mentioned probabilities are not 100% and do not guarantee risk-free trading.

How to trade in range/consolidation periodA lot of people asked me what to do in the case when the price is stuck in consolidation.
You can use Fibonacci retracement and create a range (0, 0.25, 0.5, 0.75, 1) and put it from swing low up to swing high. By that, you will create key points where the price will react on during consolidation time.
You can use it on all Timeframes and it does not matter if it is Monthly, Weekly, Daily or minute chart.
As you can see here, price very nicely reacts to each of our levels which we have set up once the range has been established. Also, when the price is stuck in consolidation range you do not want to trade it. Avoid it. You will make many mistakes, rather you should focus on a clear bullish/bearish trend.

Back to the 80's, 18+ (not for kids)$EDG
Double top.
Not a lot of volume on todays market, so might take a red day with a grain of salt. Or at least consider that the prior days bull volume has been greater than todays volume.
Likely scenario is a bit of consolidation with low volume in the christmas period for 3-4 days to build a base, and then blow up, out of the ascending parallel channel, before making a move down.
Or we come back the next days with greater volume and close lower than today, heading straight down, like pictured.
Currently, 15.9% of the shares of the company are sold short
Q3 and Q4 shows an increase of insider selling and no buying, ownership 7.90%
Institutional shows more buying than selling in the same two quartes, currently owning 79.82%

Range trading: Forex as for 18/12/2019Under that heading we publish signals of the indicator called “Ranger” . It was developed by our experts for intraday trading purposes.
This indicator is based on statistical analysis of the data and provides information about possible maximum/minimum values of the day (just right after the day has started) with certain probabilities.
What does this information give to the trader? Actually, a lot. First of all, trading signals. For example, if during a day the price approaches the upper (lower) mark, it can be concluded that it will not go higher (lower) prescribed mark today with already known probability. So, you can open a position opposite to the current movement, knowing in advance that it will be profitable with a certain probability.
EURUSD
Long position 1
(The price today will not fall below this mark with a probability of 68%) 1.1108
Long position 2
(The price today will not fall below this mark with a probability of 95%) 1.1086
Long position 3
(The price today will not fall below this mark with a probability of 99%) 1.1175
Short position 1
(The price today will not rise above this mark with a probability of 68%) 1.1175
Short position 2
(The price today will not rise above this mark with a probability of 95%) 1.1198
Short position 3
(The price today will not rise above this mark with a probability of 99%) 1.1221
GBPUSD
Long position 1 [/b
(The price today will not fall below this mark with a probability of 68%) 1.3016
Long position 2
(The price today will not fall below this mark with a probability of 95%) 1.2944
Long position 3
(The price today will not fall below this mark with a probability of 99%) 1.2872
Short position 1
(The price today will not rise above this mark with a probability of 68%) 1.3190
Short position 2
(The price today will not rise above this mark with a probability of 95%) 1.3262
Short position 3
(The price today will not rise above this mark with a probability of 99%) 1.3335
USDJPY
Long position 1
(The price today will not fall below this mark with a probability of 68%) 109.12
Long position 2
(The price today will not fall below this mark with a probability of 95%) 108.89
Long position 3
(The price today will not fall below this mark with a probability of 99%) 108.67
Short position 1
(The price today will not rise above this mark with a probability of 68%) 109.86
Short position 2
(The price today will not rise above this mark with a probability of 95%) 110.08
Short position 3
(The price today will not rise above this mark with a probability of 99%) 110.31
Calculations are based on the historical data and history doesn’t necessarily repeat this particular day. Recall, that mentioned probabilities are not 100% and do not guarantee risk-free trading.

Range trading: Crypto currency market as for 18/12/2019Under that heading we publish signals of the indicator called “Ranger” . It was developed by our experts for intraday trading purposes.
This indicator is based on statistical analysis of the data and provides information about possible maximum/minimum values of the day (just right after the day has started) with certain probabilities.
What does this information give to the trader? Actually, a lot. First of all, trading signals. For example, if during a day the price approaches the upper (lower) mark, it can be concluded that it will not go higher (lower) prescribed mark today with already known probability. So, you can open a position opposite to the current movement, knowing in advance that it will be profitable with the certain probability.
BTCUSD
Long position 1
(The price today will not fall below this mark with a probability of 68%) 6426
Long position 2
(The price today will not fall below this mark with a probability of 95%) 6295
Long position 3
(The price today will not fall below this mark with a probability of 99%) 6163
Short position 1
(The price today will not rise above this mark with a probability of 68%) 6881
Short position 2
(The price today will not rise above this mark with a probability of 95%) 7013
Short position 3
(The price today will not rise above this mark with a probability of 99%) 7144
ETHUSD
Long position 1
(The price today will not fall below this mark with a probability of 68%) 118.54
Long position 2
(The price today will not fall below this mark with a probability of 95%) 115.58
Long position 3
(The price today will not fall below this mark with a probability of 99%) 112.61
Short position 1
(The price today will not rise above this mark with a probability of 68%) 128.11
Short position 2
(The price today will not rise above this mark with a probability of 95%) 131.07
Short position 3
(The price today will not rise above this mark with a probability of 99%) 134.04
XRPUSD
Long position 1
(The price today will not fall below this mark with a probability of 68%) 0.1788
Long position 2
(The price today will not fall below this mark with a probability of 95%) 0.1733
Long position 3
(The price today will not fall below this mark with a probability of 99%) 0.1678
Short position 1
(The price today will not rise above this mark with a probability of 68%) 0.1930
Short position 2
(The price today will not rise above this mark with a probability of 95%) 0.1986
Short position 3
(The price today will not rise above this mark with a probability of 99%) 0.2041
Calculations are based on the historical data and history doesn’t necessarily repeat this particular day. Recall, that mentioned probabilities are not 100% and do not guarantee risk-free trading.

Range trading: Crypto currency market as for 17/12/2019Under that heading we publish signals of the indicator called “Ranger” . It was developed by our experts for intraday trading purposes.
This indicator is based on statistical analysis of the data and provides information about possible maximum/minimum values of the day (just right after the day has started) with certain probabilities.
What does this information give to the trader? Actually, a lot. First of all, trading signals. For example, if during a day the price approaches the upper (lower) mark, it can be concluded that it will not go higher (lower) prescribed mark today with already known probability. So, you can open a position opposite to the current movement, knowing in advance that it will be profitable with the certain probability.
BTCUSD
Long position 1
(The price today will not fall below this mark with a probability of 68%) 6617
Long position 2
(The price today will not fall below this mark with a probability of 95%) 6482
Long position 3
(The price today will not fall below this mark with a probability of 99%) 6346
Short position 1
(The price today will not rise above this mark with a probability of 68%) 7123
Short position 2
(The price today will not rise above this mark with a probability of 95%) 7259
Short position 3
(The price today will not rise above this mark with a probability of 99%) 7394
ETHUSD
Long position 1
(The price today will not fall below this mark with a probability of 68%) 126.53
Long position 2
(The price today will not fall below this mark with a probability of 95%) 123.97
Long position 3
(The price today will not fall below this mark with a probability of 99%) 121.42
Short position 1
(The price today will not rise above this mark with a probability of 68%) 136.80
Short position 2
(The price today will not rise above this mark with a probability of 95%) 139.36
Short position 3
(The price today will not rise above this mark with a probability of 99%) 141.91
XRPUSD
Long position 1
(The price today will not fall below this mark with a probability of 68%) 0.1969
Long position 2
(The price today will not fall below this mark with a probability of 95%) 0.1931
Long position 3
(The price today will not fall below this mark with a probability of 99%) 0.1892
Short position 1
(The price today will not rise above this mark with a probability of 68%) 0.2000
Short position 2
(The price today will not rise above this mark with a probability of 95%) 0.2038
Short position 3
(The price today will not rise above this mark with a probability of 99%) 0.2077
Calculations are based on the historical data and history doesn’t necessarily repeat this particular day. Recall, that mentioned probabilities are not 100% and do not guarantee risk-free trading.

HOW TO AVOID A BREAKOUT HEAD-FAKEAVOIDING FALSE BREAKOUTS
1. Declining Volume and ATR/Volatility.
2. Candle Close Outside the Consolidation
3. Significant Volume on the Breakout.
4. If You Get Head-Faked, Close the Trade.
How to Avoid False Breakouts
Prevent a Head Fake
You can't avoid every false breakout. There is no magic formula.
There is no way to know what the market is about to do.
What we do as traders is take advantage of little patterns and clues that the market is going to possibly do a certain thing.
This is all based on probabilities.
These patterns and clues never worked out 100% of the time.
That is why we manage our risk on every single trade because there are no sure things.
There are things you can do to increase the probability that you are not going to get tricked by a false breakout. Lets take a look at them.
AVOIDING FALSE BREAKOUTS
1. Declining Volume and ATR/Volatility. Watch for declining volume & atr/volatility on the consolidation before the breakout. This shows that there are fewer traders willing to risk money that price is staying in the consolidation.
2. Candle Close Outside the Consolidation. Candle closes, especially daily & weekly, are very important events. Day traders like to square their positions at the end of the day. A bearish day trader who is done for the day will close his open shorts which is a buy causing the price to pop up. If price has pushed below the consolidation during the coarse of the day, price will often retreat back into consolidation after day traders square their positions. A daily close below the consolidation means longer term traders are selling. Reverse is true for bullish breakouts.
3. Significant Volume on the Breakout. You want to see significant volume on breakout candle close outside of consolidation. If the volume is declining during the coarse of the consolidation and a volume spike on the candle close outside of the consolidation supports the fact that more traders are interested in the move. Look for the spike to be 100% of the average volume to enter a full sized position. You can enter a ½ sized position if there is at least 75% of the average volume. Use a 20 period simple moving average on the volume so it represents about a month of volume data on most markets.
4. If You Get Head-Faked, Close the Trade. You will eventually get caught in one. If you get a candle close back inside the consolidation, close the trade. You may have another opportunity to get back into the trade from a real breakout. Don't immediately give up on it. Especially if you see the volume and atr/volatility continue to decline. Taking a small loss early on will help you make it up on the real breakout.

Range trading: Forex as for 16/12/2019Under that heading we publish signals of the indicator called “Ranger” . It was developed by our experts for intraday trading purposes.
This indicator is based on statistical analysis of the data and provides information about possible maximum/minimum values of the day (just right after the day has started) with certain probabilities.
What does this information give to the trader? Actually, a lot. First of all, trading signals. For example, if during a day the price approaches the upper (lower) mark, it can be concluded that it will not go higher (lower) prescribed mark today with already known probability. So, you can open a position opposite to the current movement, knowing in advance that it will be profitable with a certain probability.
EURUSD
Long position 1
(The price today will not fall below this mark with a probability of 68%) 1.1084
Long position 2
(The price today will not fall below this mark with a probability of 95%) 1.1060
Long position 3
(The price today will not fall below this mark with a probability of 99%) 1.1036
Short position 1
(The price today will not rise above this mark with a probability of 68%) 1.1167
Short position 2
(The price today will not rise above this mark with a probability of 95%) 1.1193
Short position 3
(The price today will not rise above this mark with a probability of 99%) 1.1217
GBPUSD
Long position 1 [/b
(The price today will not fall below this mark with a probability of 68%) 1.3266
Long position 2
(The price today will not fall below this mark with a probability of 95%) 1.3198
Long position 3
(The price today will not fall below this mark with a probability of 99%) 1.3129
Short position 1
(The price today will not rise above this mark with a probability of 68%) 1.3441
Short position 2
(The price today will not rise above this mark with a probability of 95%) 1.3509
Short position 3
(The price today will not rise above this mark with a probability of 99%) 1.3577
USDJPY
www.tradingview.com
Long position 1
(The price today will not fall below this mark with a probability of 68%) 108.96
Long position 2
(The price today will not fall below this mark with a probability of 95%) 108.74
Long position 3
(The price today will not fall below this mark with a probability of 99%) 108.53
Short position 1
(The price today will not rise above this mark with a probability of 68%) 109.73
Short position 2
(The price today will not rise above this mark with a probability of 95%) 109.95
Short position 3
(The price today will not rise above this mark with a probability of 99%) 109.16
Calculations are based on the historical data and history doesn’t necessarily repeat this particular day. Recall, that mentioned probabilities are not 100% and do not guarantee risk-free trading.

EUR/USD off the highs as German Manufacturing PMI missesThe euro is trading lower against the US dollar today, following a strong reversal from the 1.1200 resistance level on Friday. Intraday bias in EUR/USD remains neutral for consolidation below this temporary top.
Further rise will remain in favor as long as 1.1039 support holds. A clear break and weekly price close above the 1.1200 level this week should be considered extremely bullish for the pair. In that event the bias will turn back to the upside for 100% projection of 1.0879 to 1.1179 from 1.0981 at 1.1281 next.
Ultimately, this is a market that continues to be stuck in a relatively tight range, and even though this last week candlestick has been very bullish, the reality is that the 1.10 level underneath has been extraordinarily supportive. If the bears can break down below the 1.10 level, then the Euro should goes looking towards the 1.0890 level.
