Range trading: Forex as for 04/11/2019Under that heading we publish signals of the indicator called “Ranger” . It was developed by our experts for intraday trading purposes.
This indicator is based on statistical analysis of the data and provides information about possible maximum/minimum values of the day (just right after the day has started) with certain probabilities.
What does this information give to the trader? Actually, a lot. First of all, trading signals. For example, if during a day the price approaches the upper (lower) mark, it can be concluded that it will not go higher (lower) prescribed mark today with already known probability. So, you can open a position opposite to the current movement, knowing in advance that it will be profitable with a certain probability.
EURUSD
Long position 1
(The price today will not fall below this mark with a probability of 68%) 1.1126
Long position 2
(The price today will not fall below this mark with a probability of 95%) 1.1110
Long position 3
(The price today will not fall below this mark with a probability of 99%) 1.1095
Short position 1
(The price today will not rise above this mark with a probability of 68%) 1.1207
Short position 2
(The price today will not rise above this mark with a probability of 95%) 1.1223
Short position 3
(The price today will not rise above this mark with a probability of 99%) 1.1238
GBPUSD
Long position 1 [/b
(The price today will not fall below this mark with a probability of 68%) 1.2840
Long position 2
(The price today will not fall below this mark with a probability of 95%) 1.2764
Long position 3
(The price today will not fall below this mark with a probability of 99%) 1.2687
Short position 1
(The price today will not rise above this mark with a probability of 68%) 1.3027
Short position 2
(The price today will not rise above this mark with a probability of 95%) 1.3104
Short position 3
(The price today will not rise above this mark with a probability of 99%) 1.3180
USDJPY
Long position 1
(The price today will not fall below this mark with a probability of 68%) 107.77
Long position 2
(The price today will not fall below this mark with a probability of 95%) 107.53
Long position 3
(The price today will not fall below this mark with a probability of 99%) 107.29
Short position 1
(The price today will not rise above this mark with a probability of 68%) 108.66
Short position 2
(The price today will not rise above this mark with a probability of 95%) 108.90
Short position 3
(The price today will not rise above this mark with a probability of 99%) 109.13
Calculations are based on the historical data and history doesn’t necessarily repeat this particular day. Recall, that mentioned probabilities are not 100% and do not guarantee risk-free trading.
Rangetrading

EUR/JPY Technical analysisThe counter is currently in a sideways trend.
And it has crossed its midpoint of the sideways range, which indicates its traction to the upside.
Hence, we expect the pair to move to its upper end of the range for now.

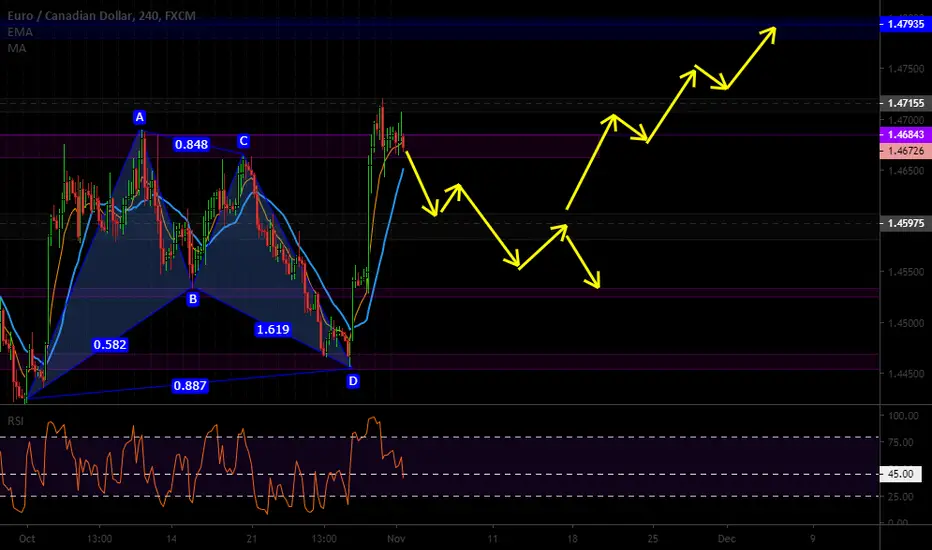
Possible Bullish ContinuationWe are currently in a big range according to the weekly.
But thanks to the big boost from news week, we could possibly bust out this week -- as long as we stay bullish.
Since we had a big impulse move Friday, we should have some pullback before continuing up.
With price beginning at consolidation, we should prepare for a big impulse move again this week too.
BULL TPS:
Beginning at 1.45975
• 1.46321
• 1.46612
• 1.47072
• 1.47476
• 1.47935
BEAR TPS:
Beginning at the current position
• 1.46321
• 1.45975
• 1.45608
• 1.45251
CAD/CHF Technical analysisThe counter is currently trading within the long-term range of 0.76232-0.73160.
It hit the upper end of the range and formed an evening star candle, which indicates the completion of up move.
Hence, we expect the pair to move to the lower end of the range in the short-term.

NZDCHF 1D RANGE TRADESRanges are repeatable trading chart patterns.
Ranges are consolidation chart patterns that can breakout either direction.
Each chart pattern will have defining trendlines of the support/resistance levels creating the pattern.
What ever time frame you are trading this chart pattern, wait for a candle close outside of the trendline in the direction of the breakout candle. (Our time frame preference is the Daily chart).
Add volume indicator - Volume is the amount of $ that went into a particular candle or in Forex the # of trades that took place.
Add ATR indicator - Volatility is the amount of price movement that occurred. Use the ATR to measure the price movement.
When you see descending Volume bars and descending ATR line (which indicates volatility) this shows
a dis-interest in traders to invest in this pair creating consolidation which creates the chart pattern.
Trade Management after there is a breakout candle close.
1 - Position size (compare volume bar to volume ma line).
a - Breakout candle must be 100% of average volume for a full position size.
b - If 75% of average volume then ½ position size. (To find 75% of Volume
look at the charts volume settings – divide smaller # into larger # = 75%+)
2 - Enter two trades.
3 - SL for both trades will be 1.5 x ATR.
4 - 1st trade TP will be 1 x ATR.
5 - No TP on 2nd trade – letting profit run and adjusting SL to follow price.
6 - When 1st TP hit – move 2nd trade SL to breakeven.
7 - Adjust the 2nd trade SL to follow price.
*8 – After Breakout candle – if price closes back into chart pattern close trade
*9 - When breakout candle is more than 1 ATR from breakout candle open.
a - Enter 1st trade at candle close with ½ position size.
b - Enter 2nd trade with a pending limit order that is 1 ATR of breakout candle open.
c – Price should pullback to that pending limit order for 2nd trade.
d – If Price returns back into chart pattern close trade before SL is hit.

Range trading: Crypto currency market as for 30/10/2019Under that heading we publish signals of the indicator called “Ranger” . It was developed by our experts for intraday trading purposes.
This indicator is based on statistical analysis of the data and provides information about possible maximum/minimum values of the day (just right after the day has started) with certain probabilities.
What does this information give to the trader? Actually, a lot. First of all, trading signals. For example, if during a day the price approaches the upper (lower) mark, it can be concluded that it will not go higher (lower) prescribed mark today with already known probability. So, you can open a position opposite to the current movement, knowing in advance that it will be profitable with the certain probability.
BTCUSD
Long position 1
(The price today will not fall below this mark with a probability of 68%) 8879
Long position 2
(The price today will not fall below this mark with a probability of 95%) 8474
Long position 3
(The price today will not fall below this mark with a probability of 99%) 8068
Short position 1
(The price today will not rise above this mark with a probability of 68%) 9768
Short position 2
(The price today will not rise above this mark with a probability of 95%) 10174
Short position 3
(The price today will not rise above this mark with a probability of 99%) 10579
ETHUSD
Long position 1
(The price today will not fall below this mark with a probability of 68%) 180.52
Long position 2
(The price today will not fall below this mark with a probability of 95%) 173.92
Long position 3
(The price today will not fall below this mark with a probability of 99%) 167.34
Short position 1
(The price today will not rise above this mark with a probability of 68%) 197.32
Short position 2
(The price today will not rise above this mark with a probability of 95%) 203.89
Short position 3
(The price today will not rise above this mark with a probability of 99%) 210.46
XRPUSD
Long position 1
(The price today will not fall below this mark with a probability of 68%) 0.2898
Long position 2
(The price today will not fall below this mark with a probability of 95%) 0.2806
Long position 3
(The price today will not fall below this mark with a probability of 99%) 0.2714
Short position 1
(The price today will not rise above this mark with a probability of 68%) 0.3172
Short position 2
(The price today will not rise above this mark with a probability of 95%) 0.3264
Short position 3
(The price today will not rise above this mark with a probability of 99%) 0.3356
Calculations are based on the historical data and history doesn’t necessarily repeat this particular day. Recall, that mentioned probabilities are not 100% and do not guarantee risk-free trading.

AMD 1D RANGE TRADESRanges are repeatable trading chart patterns.
Ranges are consolidation chart patterns that can breakout either direction.
Each chart pattern will have defining trendlines of the support/resistance levels creating the pattern.
What ever time frame you are trading this chart pattern, wait for a candle close outside of the trendline in the direction of the breakout candle. (Our time frame preference is the Daily chart).
Add volume indicator - Volume is the amount of $ that went into a particular candle or in Forex the # of trades that took place.
Add ATR indicator - Volatility is the amount of price movement that occurred. Use the ATR to measure the price movement.
When you see descending Volume bars and descending ATR line (which indicates volatility) this shows
a dis-interest in traders to invest in this pair creating consolidation which creates the chart pattern.
Trade Management after there is a breakout candle close.
1 - Position size (compare volume bar to volume ma line).
a - Breakout candle must be 100% of average volume for a full position size.
b - If 75% of average volume then ½ position size. (To find 75% of Volume
look at the charts volume settings – divide smaller # into larger # = 75%+)
2 - Enter two trades.
3 - SL for both trades will be 1.5 x ATR.
4 - 1st trade TP will be 1 x ATR.
5 - No TP on 2nd trade – letting profit run and adjusting SL to follow price.
6 - When 1st TP hit – move 2nd trade SL to breakeven.
7 - Adjust the 2nd trade SL to follow price.
*8 – After Breakout candle – if price closes back into chart pattern close trade
*9 - When breakout candle is more than 1 ATR from breakout candle open.
a - Enter 1st trade at candle close with ½ position size.
b - Enter 2nd trade with a pending limit order that is 1 ATR of breakout candle open.
c – Price should pullback to that pending limit order for 2nd trade.
d – If Price returns back into chart pattern close trade before SL is hit.

We're Stuck in a Ginormous RangeBeen in a ginormous range for a good while.
Had a breakout from a small wedge within it, but that doesn't guarantee we're out of the woods yet.
So enjoy the range trading for now.
And yes, I did put bear tps in case the consolidation breakout heads south.
BULL TPS:
8514.90
8818.06
when break out of the range...
9085.48
9494.51
BEAR TPS:
8222.74
7999.78
when break out of the range...
7609.41
7218.66

BTCUSD 1D RANGE TRADESRanges are repeatable trading chart patterns.
Ranges are consolidation chart patterns that can breakout either direction.
Each chart pattern will have defining trendlines of the support/resistance levels creating the pattern.
What ever time frame you are trading this chart pattern, wait for a candle close outside of the trendline in the direction of the breakout candle. (Our time frame preference is the Daily chart).
Add volume indicator - Volume is the amount of $ that went into a particular candle or in Forex the # of trades that took place.
Add ATR indicator - Volatility is the amount of price movement that occurred. Use the ATR to measure the price movement.
When you see descending Volume bars and descending ATR line (which indicates volatility) this shows
a dis-interest in traders to invest in this pair creating consolidation which creates the chart pattern.
Trade Management after there is a breakout candle close.
1 - Position size (compare volume bar to volume ma line).
a - Breakout candle must be 100% of average volume for a full position size.
b - If 75% of average volume then ½ position size. (To find 75% of Volume
look at the charts volume settings – divide smaller # into larger # = 75%+)
2 - Enter two trades.
3 - SL for both trades will be 1.5 x ATR.
4 - 1st trade TP will be 1 x ATR.
5 - No TP on 2nd trade – letting profit run and adjusting SL to follow price.
6 - When 1st TP hit – move 2nd trade SL to breakeven.
7 - Adjust the 2nd trade SL to follow price.
*8 – After Breakout candle – if price closes back into chart pattern close trade
*9 - When breakout candle is more than 1 ATR from breakout candle open.
a - Enter 1st trade at candle close with ½ position size.
b - Enter 2nd trade with a pending limit order that is 1 ATR of breakout candle open.
c – Price should pullback to that pending limit order for 2nd trade.
d – If Price returns back into chart pattern close trade before SL is hit.

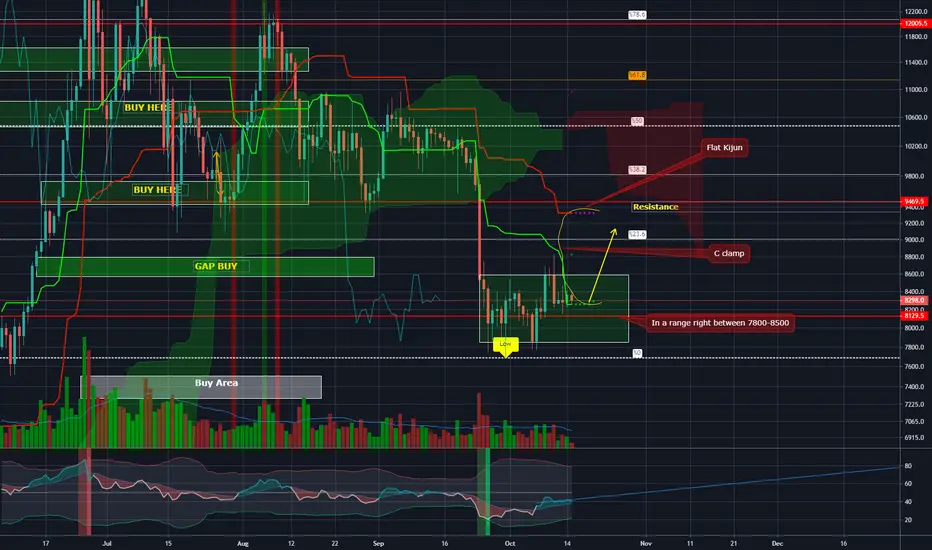
BTC's Time to Go up? C-Clamp on the 1D chart BTC has been randing between 7800 and 8500 for quite some time since the drop in late September.
We see that we had a tweezer bottom and bounced back, but came back to support at 8130. Now it has had a weak bounce but we are seeing a C-Clamp formation and the Kijun Flattening out.
Kijun is a magnet to price and so because of this and how far we are on the daily from the Kijun we will see it act as a magnet and pull the price action up.
I am targeting:
8750 and 9100 as my TP I will leave 20% just in case we go all the way and tap the kijun which is sitting around 9330.
My stop I will start at and use Evolving R around 7860.
If you enjoy the charts throw up a like!
Check me on twitter for some fundamentals as well - @coachkcrypto
Never be too scared to win, only be scared that you didn't try!
Coach K
LTCUSD 1D RANGE TRADESRanges are repeatable trading chart patterns.
Ranges are consolidation chart patterns that can breakout either direction.
Each chart pattern will have defining trendlines of the support/resistance levels creating the pattern.
What ever time frame you are trading this chart pattern, wait for a candle close outside of the trendline in the direction of the breakout candle. (Our time frame preference is the Daily chart).
Add volume indicator - Volume is the amount of $ that went into a particular candle or in Forex the # of trades that took place.
Add ATR indicator - Volatility is the amount of price movement that occurred. Use the ATR to measure the price movement.
When you see descending Volume bars and descending ATR line (which indicates volatility) this shows
a dis-interest in traders to invest in this pair creating consolidation which creates the chart pattern.
Trade Management after there is a breakout candle close.
1 - Position size (compare volume bar to volume ma line).
a - Breakout candle must be 100% of average volume for a full position size.
b - If 75% of average volume then ½ position size. (To find 75% of Volume
look at the charts volume settings – divide smaller # into larger # = 75%+)
2 - Enter two trades.
3 - SL for both trades will be 1.5 x ATR.
4 - 1st trade TP will be 1 x ATR.
5 - No TP on 2nd trade – letting profit run and adjusting SL to follow price.
6 - When 1st TP hit – move 2nd trade SL to breakeven.
7 - Adjust the 2nd trade SL to follow price.
*8 – After Breakout candle – if price closes back into chart pattern close trade
*9 - When breakout candle is more than 1 ATR from breakout candle open.
a - Enter 1st trade at candle close with ½ position size.
b - Enter 2nd trade with a pending limit order that is 1 ATR of breakout candle open.
c – Price should pullback to that pending limit order for 2nd trade.
d – If Price returns back into chart pattern close trade before SL is hit.

GBPAUD 1D BEAR FLAG SHORT TRADEBear Flags are a form of Range patterns which are repeatable trading chart patterns.
Ranges are consolidation chart patterns that can breakout either direction.
Each chart pattern will have defining trendlines of the support/resistance levels creating the pattern.
What ever time frame you are trading this chart pattern, wait for a candle close outside of the trendline in the direction of the breakout candle. (Our time frame preference is the Daily chart).
Add volume indicator - Volume is the amount of $ that went into a particular candle or in Forex the # of trades that took place.
Add ATR indicator - Volatility is the amount of price movement that occurred. Use the ATR to measure the price movement.
When you see descending Volume bars and descending ATR line (which indicates volatility) this shows
a dis-interest in traders to invest in this pair creating consolidation which creates the chart pattern.
Trade Management after there is a breakout candle close.
1 - Position size (compare volume bar to volume ma line).
a - Breakout candle must be 100% of average volume for a full position size.
b - If 75% of average volume then ½ position size. (To find 75% of Volume
look at the charts volume settings – divide smaller # into larger # = 75%+)
2 - Enter two trades.
3 - SL for both trades will be 1.5 x ATR.
4 - 1st trade TP will be 1 x ATR.
5 - No TP on 2nd trade – letting profit run and adjusting SL to follow price.
6 - When 1st TP hit – move 2nd trade SL to breakeven.
7 - Adjust the 2nd trade SL to follow price.
*8 – After Breakout candle – if price closes back into chart pattern close trade
*9 - When breakout candle is more than 1 ATR from breakout candle open.
a - Enter 1st trade at candle close with ½ position size.
b - Enter 2nd trade with a pending limit order that is 1 ATR of breakout candle open.
c – Price should pullback to that pending limit order for 2nd trade.
d – If Price returns back into chart pattern close trade before SL is hit.

KOHLS 1D RANGE TRADESRanges are repeatable trading chart patterns.
Ranges are consolidation chart patterns that can breakout either direction.
Each chart pattern will have defining trendlines of the support/resistance levels creating the pattern.
What ever time frame you are trading this chart pattern, wait for a candle close outside of the trendline in the direction of the breakout candle. (Our time frame preference is the Daily chart).
Add volume indicator - Volume is the amount of $ that went into a particular candle or in Forex the # of trades that took place.
Add ATR indicator - Volatility is the amount of price movement that occurred. Use the ATR to measure the price movement.
When you see descending Volume bars and descending ATR line (which indicates volatility) this shows
a dis-interest in traders to invest in this pair creating consolidation which creates the chart pattern.
Trade Management after there is a breakout candle close.
1 - Position size (compare volume bar to volume ma line).
a - Breakout candle must be 100% of average volume for a full position size.
b - If 75% of average volume then ½ position size. (To find 75% of Volume
look at the charts volume settings – divide smaller # into larger # = 75%+)
2 - Enter two trades.
3 - SL for both trades will be 1.5 x ATR.
4 - 1st trade TP will be 1 x ATR.
5 - No TP on 2nd trade – letting profit run and adjusting SL to follow price.
6 - When 1st TP hit – move 2nd trade SL to breakeven.
7 - Adjust the 2nd trade SL to follow price.
*8 – After Breakout candle – if price closes back into chart pattern close trade
*9 - When breakout candle is more than 1 ATR from breakout candle open.
a - Enter 1st trade at candle close with ½ position size.
b - Enter 2nd trade with a pending limit order that is 1 ATR of breakout candle open.
c – Price should pullback to that pending limit order for 2nd trade.
d – If Price returns back into chart pattern close trade before SL is hit.

AMD 1D RANGE TRADESRanges are repeatable trading chart patterns.
Ranges are consolidation chart patterns that can breakout either direction.
Each chart pattern will have defining trendlines of the support/resistance levels creating the pattern.
What ever time frame you are trading this chart pattern, wait for a candle close outside of the trendline in the direction of the breakout candle. (Our time frame preference is the Daily chart).
Add volume indicator - Volume is the amount of $ that went into a particular candle or in Forex the # of trades that took place.
Add ATR indicator - Volatility is the amount of price movement that occurred. Use the ATR to measure the price movement.
When you see descending Volume bars and descending ATR line (which indicates volatility) this shows
a dis-interest in traders to invest in this pair creating consolidation which creates the chart pattern.
Trade Management after there is a breakout candle close.
1 - Position size (compare volume bar to volume ma line).
a - Breakout candle must be 100% of average volume for a full position size.
b - If 75% of average volume then ½ position size. (To find 75% of Volume
look at the charts volume settings – divide smaller # into larger # = 75%+)
2 - Enter two trades.
3 - SL for both trades will be 1.5 x ATR.
4 - 1st trade TP will be 1 x ATR.
5 - No TP on 2nd trade – letting profit run and adjusting SL to follow price.
6 - When 1st TP hit – move 2nd trade SL to breakeven.
7 - Adjust the 2nd trade SL to follow price.
*8 – After Breakout candle – if price closes back into chart pattern close trade
*9 - When breakout candle is more than 1 ATR from breakout candle open.
a - Enter 1st trade at candle close with ½ position size.
b - Enter 2nd trade with a pending limit order that is 1 ATR of breakout candle open.
c – Price should pullback to that pending limit order for 2nd trade.
d – If Price returns back into chart pattern close trade before SL is hit.

ETHUSD 4H ASCENDING CHANNEL TRADESChannels & Ranges are repeatable trading chart patterns.
Channels & Ranges are consolidation chart patterns that can breakout either direction.
Each chart pattern will have defining trendlines of the support/resistance levels creating the pattern.
What ever time frame you are trading this chart pattern, wait for a candle close outside of the trendline in the direction of the breakout candle. (Our time frame preference is the Daily chart ).
Add volume indicator - Volume is the amount of $ that went into a particular candle or in Forex the # of trades that took place.
Add ATR indicator - Volatility is the amount of price movement that occurred. Use the ATR to measure the price movement.
When you see descending Volume bars and descending ATR line (which indicates volatility ) this shows a dis-interest in traders to invest in this pair creating consolidation which creates the chart pattern.
Trade Management after there is a breakout candle close.
1 - Position size (compare volume bar to volume ma line).
a - Breakout candle must be 100% of average volume for a full position size.
b - If 75% of average volume then ½ position size. (To find 75% of Volume
look at the volume settings on the chart – divide smaller # into larger # = 75%+)
2 - Enter two trades.
3 - SL for both trades will be 1.5 x ATR.
4 - 1st trade TP will be 1 x ATR.
5 - No TP on 2nd trade – letting profit run and adjusting SL to follow price.
6 - When 1st TP hit – move 2nd trade SL to breakeven.
7 - Adjust the 2nd trade SL to follow price.
*8 – After Breakout candle – if price closes back into chart pattern close trade
*9 - When breakout candle is more than 1 ATR from breakout candle open.
a - Enter 1st trade at candle close with ½ position size.
b - Enter 2nd trade with a pending limit order that is 1 ATR of breakout candle open.
c – Price should pullback to that pending limit order for 2nd trade.
d – If Price returns back into chart pattern close trade before SL is hit.

USDCAD - RANGE TRADE IDEAUSD & CAD are suffering bad data outputs and lack of demand for oil.
We could see this market testing the bottom of the short term range around the 1.315 zone looking for direction.
Further drop in manufacturing data could see further downside.

BTCUSD 4H RANGE TRADESRanges are a repeatable trading chart patterns.
Ranges are consolidation chart patterns that can breakout either direction.
Each chart pattern will have defining trendlines of the support/resistance levels creating the pattern.
What ever time frame you are trading this chart pattern, wait for a candle close outside of the trendline in the direction of the breakout candle. (Our time frame preference is the Daily chart ).
Add volume indicator - Volume is the amount of $ that went into a particular candle or in Forex the # of trades that took place.
Add ATR indicator - Volatility is the amount of price movement that occurred. Use the ATR to measure the price movement.
When you see descending Volume bars and descending ATR line (which indicates volatility ) this shows a dis-interest in traders to invest in this pair creating consolidation which creates the chart pattern.
Trade Management after there is a breakout candle close.
1 - Position size (compare volume bar to volume ma line).
a - Breakout candle must be 100% of average volume for a full position size.
b - If 75% of average volume then ½ position size. (To find 75% of Volume
look at the volume settings on the chart – divide smaller # into larger # = 75%+)
2 - Enter two trades.
3 - SL for both trades will be 1.5 x ATR.
4 - 1st trade TP will be 1 x ATR.
5 - No TP on 2nd trade – letting profit run and adjusting SL to follow price.
6 - When 1st TP hit – move 2nd trade SL to breakeven.
7 - Adjust the 2nd trade SL to follow price.
*8 – After Breakout candle – if price closes back into chart pattern close trade
*9 - When breakout candle is more than 1 ATR from breakout candle open.
a - Enter 1st trade at candle close with ½ position size.
b - Enter 2nd trade with a pending limit order that is 1 ATR of breakout candle open.
c – Price should pullback to that pending limit order for 2nd trade.
d – If Price returns back into chart pattern close trade before SL is hit.

GBPJPY 1D RANGE TRADESRanges are repeatable trading chart patterns.
Ranges are consolidation chart patterns that can breakout either direction.
Each chart pattern will have defining trendlines of the support/resistance levels creating the pattern.
What ever time frame you are trading this chart pattern, wait for a candle close outside of the trendline in the direction of the breakout candle. (Our time frame preference is the Daily chart).
Add volume indicator - Volume is the amount of $ that went into a particular candle or in Forex the # of trades that took place.
Add ATR indicator - Volatility is the amount of price movement that occurred. Use the ATR to measure the price movement.
When you see descending Volume bars and descending ATR line (which indicates volatility) this shows
a dis-interest in traders to invest in this pair creating consolidation which creates the chart pattern.
Trade Management after there is a breakout candle close.
1 - Position size (compare volume bar to volume ma line).
a - Breakout candle must be 100% of average volume for a full position size.
b - If 75% of average volume then ½ position size. (To find 75% of Volume
look at the charts volume settings – divide smaller # into larger # = 75%+)
2 - Enter two trades.
3 - SL for both trades will be 1.5 x ATR.
4 - 1st trade TP will be 1 x ATR.
5 - No TP on 2nd trade – letting profit run and adjusting SL to follow price.
6 - When 1st TP hit – move 2nd trade SL to breakeven.
7 - Adjust the 2nd trade SL to follow price.
*8 – After Breakout candle – if price closes back into chart pattern close trade
*9 - When breakout candle is more than 1 ATR from breakout candle open.
a - Enter 1st trade at candle close with ½ position size.
b - Enter 2nd trade with a pending limit order that is 1 ATR of breakout candle open.
c – Price should pullback to that pending limit order for 2nd trade.
d – If Price returns back into chart pattern close trade before SL is hit.

EURGBP - BULLISH PULL BACK SHORT TERMHAVE WE REACHED THE SUPPORT AREA FOR A SHORT TERM PULL BACK TO THE 0.905 ZONE ?
POLITICAL ACTIVITIES AND BOE HAWK TURNING DOVISH COULD PULL THE EURO UP BUT WE STILL SEE THIS MARKET BEARISH ON THE MEDIUM TERM TO THE BOTTOM OF THE RANGE AROUND 0.85 ZONE

NIKE 1D BULLISH RANGE BREAKOUTRanges are repeatable trading chart pattern.
Ranges are consolidation chart patterns that can breakout either direction.
Each chart pattern will have defining trendlines of the support/resistance levels creating the pattern.
What ever time frame you are trading this chart pattern, wait for a candle close outside of the trendline in the direction of the breakout candle. (Our time frame preference is the Daily chart).
Add volume indicator - Volume is the amount of $ that went into a particular candle or in Forex the # of trades that took place.
Add ATR indicator - Volatility is the amount of price movement that occurred. Use the ATR to measure the price movement.
When you see descending Volume bars and descending ATR line (which indicates volatility) this shows
a dis-interest in traders to invest in this pair creating consolidation which creates the chart pattern.
Trade Management after there is a breakout candle close.
1 - Position size (compare volume bar to volume ma line).
a - Breakout candle must be 100% of average volume for a full position size.
b - If 75% of average volume then ½ position size. (To find 75% of Volume
look at the charts volume settings – divide smaller # into larger # = 75%+)
2 - Enter two trades.
3 - SL for both trades will be 1.5 x ATR.
4 - 1st trade TP will be 1 x ATR.
5 - No TP on 2nd trade – letting profit run and adjusting SL to follow price.
6 - When 1st TP hit – move 2nd trade SL to breakeven.
7 - Adjust the 2nd trade SL to follow price.
*8 – After Breakout candle – if price closes back into chart pattern close trade
*9 - When breakout candle is more than 1 ATR from breakout candle open.
a - Enter 1st trade at candle close with ½ position size.
b - Enter 2nd trade with a pending limit order that is 1 ATR of breakout candle open.
c – Price should pullback to that pending limit order for 2nd trade.
d – If Price returns back into chart pattern close trade before SL is hit.

GOLD 1D RANGE TRADESRanges, Triangles, Descending Triangles, & Ascending Triangle are repeatable trading chart patterns.
Triangles and ranges are consolidation chart patterns that can breakout either direction.
Ascending and descending chart patterns will have a directional bias depending on the previous incoming trend.
Each chart pattern will have defining trendlines of the support/resistance levels creating the pattern.
What ever time frame you are trading this chart pattern, wait for a candle close outside of the trendline in the direction of the breakout candle. (Our time frame preference is the Daily chart ).
Add volume indicator - Volume is the amount of $ that went into a particular candle or in Forex the # of trades that took place.
Add ATR indicator - Volatility is the amount of price movement that occurred. Use the ATR to measure the price movement.
When you see descending Volume bars and descending ATR line (which indicates volatility ) this shows a dis-interest in traders to invest in this pair creating consolidation which creates the chart pattern.
Trade Management after there is a breakout candle close.
1 - Position size (compare volume bar to volume ma line).
a - Breakout candle must be 100% of average volume for a full position size.
b - If 75% of average volume then ½ position size. (To find 75% of Volume
look at the volume settings on the chart – divide smaller # into larger # = 75%+)
2 - Enter two trades.
3 - SL for both trades will be 1.5 x ATR.
4 - 1st trade TP will be 1 x ATR.
5 - No TP on 2nd trade – letting profit run and adjusting SL to follow price.
6 - When 1st TP hit – move 2nd trade SL to breakeven.
7 - Adjust the 2nd trade SL to follow price.
*8 – After Breakout candle – if price closes back into chart pattern close trade
*9 - When breakout candle is more than 1 ATR from breakout candle open.
a - Enter 1st trade at candle close with ½ position size.
b - Enter 2nd trade with a pending limit order that is 1 ATR of breakout candle open.
c – Price should pullback to that pending limit order for 2nd trade.
d – If Price returns back into chart pattern close trade before SL is hit.

DOLLAR YEN CHANGE OF TREND @ TOP OF THE RANGE FOR GREAT R:R!
Not much to do with this trade. Have been tracking when risk on would take profit and with SP topping near ATH's
and with FED hinting less rate cuts than expected I am ready to sell.
The 3 Slopes I Marked have been broken by the big red candle forming the lower LOW and breaking the 21 ema.
Not much else to do with this trade. I fib'd the move and the support now resistance marks exactly where I will
enter which is in the crucial 50- 618 fib zone. Putting stops above the high for an INCREDIBLE risk reward trade
Aiming TP1 at 106.70 area. Will watch for more trade war risk or brexit risk if I should stay longer.
Happy Hunting Happy Trapping
This should be an easy one..... hopefully :)
BooBii

BULLS SQUEEZE ON EMPTY NEWS... GREAT VALUE AREA FOR SELL!!Selling all rallies on pound until further notice...
Top of the Range with bulls trapping all early (myself included) bears!
However we were prepared and all unknowing and late bears its our time to TRAP!!
Sold at 1.2550 SL above 1.2620 TP1 1.24 and then I will see if we have a bounce there
Will be tracking the official entry with confirmation of the change of trend . WIll update later
Happy Hunting Happy Trapping!!
BooBii
