E-MINI DOW JONES FUTURES 1D RANGE TRADESRanges, Triangles, Descending Triangles, and Ascending Triangles are repeatable trading chart patterns.
Triangles and ranges are consolidation chart patterns that can breakout either direction.
Ascending and descending chart patterns will have a directional bias depending on the previous incoming trend.
Each chart pattern will have defining trendlines of the support/resistance levels creating the pattern.
What ever time frame you are trading this chart pattern, wait for a candle close outside of the trendline in the direction of the breakout candle. (Our time frame preference is the Daily chart ).
Add volume indicator - Volume is the amount of $ that went into a particular candle or in Forex the # of trades that took place.
Add ATR indicator - Volatility is the amount of price movement that occurred. Use the ATR to measure the price movement.
When you see descending Volume bars and descending ATR line (which indicates volatility ) this shows a dis-interest in traders to invest in this pair creating consolidation which creates the chart pattern.
Trade Management after there is a breakout candle close.
1 - Position size (compare volume bar to volume ma line).
a - Breakout candle must be 100% of average volume for a full position size.
b - If 75% of average volume then ½ position size. (To find 75% of Volume
look at the volume settings on the chart – divide smaller # into larger # = 75%+)
2 - Enter two trades.
3 - SL for both trades will be 1.5 x ATR.
4 - 1st trade TP will be 1 x ATR.
5 - No TP on 2nd trade – letting profit run and adjusting SL to follow price.
6 - When 1st TP hit – move 2nd trade SL to breakeven.
7 - Adjust the 2nd trade SL to follow price.
*8 – After Breakout candle – if price closes back into chart pattern close trade
*9 - When breakout candle is more than 1 ATR from breakout candle open.
a - Enter 1st trade at candle close with ½ position size.
b - Enter 2nd trade with a pending limit order that is 1 ATR of breakout candle open.
c – Price should pullback to that pending limit order for 2nd trade.
d – If Price returns back into chart pattern close trade before SL is hit.
Rangetrading

RANGE BOUND TRADE OPTIONSRanges, Triangles, Descending Triangles, and Ascending Triangle are repeatable trading chart patterns.
Triangles and ranges are consolidation chart patterns that can breakout either direction.
Ascending and descending chart patterns will have a directional bias depending on the previous incoming trend.
Each chart pattern will have defining trendlines of the support/resistance levels creating the pattern.
What ever time frame you are trading this chart pattern, wait for a candle close outside of the trendline in the direction of the breakout candle. (Our time frame preference is the Daily chart ).
Add volume indicator - Volume is the amount of $ that went into a particular candle or in Forex the # of trades that took place.
Add ATR indicator - Volatility is the amount of price movement that occurred. Use the ATR to measure the price movement.
When you see descending Volume bars and descending ATR line (which indicates volatility ) this shows a dis-interest in traders to invest in this pair creating consolidation which creates the chart pattern.
Trade Management after there is a breakout candle close.
1 - Position size (compare volume bar to volume ma line).
a - Breakout candle must be 100% of average volume for a full position size.
b - If 75% of average volume then ½ position size. (To find 75% of Volume
look at the volume settings on the chart – divide smaller # into larger # = 75%+)
2 - Enter two trades.
3 - SL for both trades will be 1.5 x ATR.
4 - 1st trade TP will be 1 x ATR.
5 - No TP on 2nd trade – letting profit run and adjusting SL to follow price.
6 - When 1st TP hit – move 2nd trade SL to breakeven.
7 - Adjust the 2nd trade SL to follow price.
*8 – After Breakout candle – if price closes back into chart pattern close trade
*9 - When breakout candle is more than 1 ATR from breakout candle open.
a - Enter 1st trade at candle close with ½ position size.
b - Enter 2nd trade with a pending limit order that is 1 ATR of breakout candle open.
c – Price should pullback to that pending limit order for 2nd trade.
d – If Price returns back into chart pattern close trade before SL is hit.

Accumulation on Gold.... Last Chance to Load for 1560I have been tracking this for a while and it has been an all out war...
Good thing is the trend is your friend and we are in a heavy bullish trend...
Bears are running out of steam as we are in an ascending triangle aiming right at the 1507 area resistance
I took a long based on the break of the trendline around 1500 and got an entry on the retrace around 1502 with stops under 1497.
Will add more on bounces of the upward trendline.
Will have full confirmation of the break of 1507 and will take last longs there. TP1 at 1525 and let the rest run.
Happy Hunting Happy Trapping
BooBii
Make sure to like... comment ... and subscribe
Any questions feel free to ask...
For what I don't know... I just don't know...
But what I do know I'll gladly share...

USDCHF 1D RANGE TRADESRanges, Descending Triangles, Triangles, & Ascending Triangle are repeatable trading chart patterns.
Triangles and ranges are consolidation chart patterns that can breakout either direction.
Ascending and descending chart patterns will have a directional bias depending on the previous incoming trend.
Each chart pattern will have defining trendlines of the support/resistance levels creating the pattern.
What ever time frame you are trading this chart pattern, wait for a candle close outside of the trendline in the direction of the breakout candle. (Our time frame preference is the Daily chart).
Add volume indicator - Volume is the amount of $ that went into a particular candle or in Forex the # of trades that took place.
Add ATR indicator - Volatility is the amount of price movement that occurred. Use the ATR to measure the price movement.
When you see descending Volume bars and descending ATR line (which indicates volatility) this shows
a dis-interest in traders to invest in this pair creating consolidation which creates the chart pattern.
Trade Management after there is a breakout candle close.
1 - Position size (compare volume bar to volume ma line).
a - Breakout candle must be 100% of average volume for a full position size.
b - If 75% of average volume then ½ position size. (To find 75% of Volume
look at the charts volume settings – divide smaller # into larger # = 75%+)
2 - Enter two trades.
3 - SL for both trades will be 1.5 x ATR.
4 - 1st trade TP will be 1 x ATR.
5 - No TP on 2nd trade – letting profit run and adjusting SL to follow price.
6 - When 1st TP hit – move 2nd trade SL to breakeven.
7 - Adjust the 2nd trade SL to follow price.
*8 – After Breakout candle – if price closes back into chart pattern close trade
*9 - When breakout candle is more than 1 ATR from breakout candle open.
a - Enter 1st trade at candle close with ½ position size.
b - Enter 2nd trade with a pending limit order that is 1 ATR of breakout candle open.
c – Price should pullback to that pending limit order for 2nd trade.
d – If Price returns back into chart pattern close trade before SL is hit.

HOW TO GRID TRADE: The Good, The Bad and The Ugly (Tutorial #5)HOW TO GRID TRADE:
The Good, The Bad and The Ugly (Tutorial #5)
DID YOU KNOW?
The cryptocurrencies you’re holding right now could be generating passive income. Even if you have small holdings or limited capital THIS can become very profitable with a little known strategy called GRID TRADING.
EXAMPLE: 11-DAY GRID TRADE EARNS 19.27% PROFIT
EASY TO LEARN, LOW RISK & HIGH RETURNS? WHAT'S THE CATCH?
If you have not read my previous tutorials on grid trading , I’ll summarize the concept quickly. Grid trading is a type of trading, typically managed by a BOT which sounds a lot more complicated than it is.
In a nutshell, you select a range, you divide your range into equally spaced buy/sell grids (like trip wires, sorta) . And as price zigzags up and down, your “trip wires” trigger buys and sells - catching profits for you incrementally all along the way! If you are able to start your grid as the market ranges sideways (which is 70% of the time) or when it is in a gradual upward ranging trend (15% of the time) then you are going to make money most of the time. That leaves about 15% of the time when the market is ranging downwards (and even then, many times grid trading can still produce a profit) .
Grid trading requires far less skill and less management than most other types of trading -PLUS- it has far less risk. Not to mention, most grid traders make better returns on their money with grid trading than they do with any other trading strategy.
Can you lose money grid trading? YES, but with a little knowledge, losing money is hard!
OK IT'S EASY PEASY, BUT HOW DO I DO THIS?
You'll need a gird bot automation platform to manage this, but once you've got that... there are only a few parameters you must setup to get started with your grid bot trades. And if you start with a small investment, the learning process is rather fun. Once you get the hang of it, you can increase your investment. The sky is the limit.
1) GET YOUR GRID TRADING BOT (recommendations below)
2) PICK THE CRYPTOCURRENCY PAIR which you plan to trade.
3) SELECT YOUR RANGE. It's called your “trading channel” - and while this can vary depending on the crypto asset you select, it can also vary based on your trend bias and available capital. Just as a thumbnail guide, you might trade a top 10 cryptocurrency pair within a 4% to 8% trading channel, whereas a low cap coin pair might merit a 1% to 50%+ trading channel.
4) DETERMINE A GRID SPACING or GRID COUNT which basically divides your range into a series of buy and sell grid lines. As the price of an asset moves up or down within your range, the bot will execute trades. Each time the price moves up over a grid line the bot will execute a sell order. Each time it moves down over a grid line it executes a buy order. As long as the price stays within the upper and lower price limits that you have pre-set, you will profit from the zigzag of the market.
5) A STOP LOSS is optional and may not be needed at all, but it is a parameter you must think about and set, if you feel you need it. If you are trading a coin that you don’t mind holding, a stoploss is not needed. Advanced strategies can reduce almost all possibility of loss!
NOTE: Trying to grid trading manually is near impossible. It is highly recommended you use a trading bot to carry out your grid trading strategy.
NO BOTS ABOUT IT...
Grid trading bots automate the process and maximize your potential profits. Your bot will automatically place buy and sell orders at pre-set price points you map out upfront. As you go along, your bot will replace grid line open orders as each previous grid level (line) is executed. You simply need to set your upper and lower price limits (your range) for your trading channel, decide how many grids you want, and how much of the asset you’ll invest in. Once your parameters are entered, your bot can be started and you can sit back and watch profits add up.
For example, if you chose to trade BTC/USD, then you'll start by buying BTC and you'll simultaneously place limit sell orders along your grid. This is easy because your bot will automate the entire strategy.
You can of course get very good at this type trading and make an impressive income however, at the most basic level, all you need to know to start Grid Trading today, is what you’ve just read, perhaps a few more tips from my other grid trading tutorials and if you're smart, you'll try grid trading indicators.
Additional resources are found below.
HOW DO I LEARN MORE?
1) Review my related IDEAS and TUTORIALS (linked below)
2) Explore GRID INDICATORS (linked Below)
PLEASE HIT THE LIKE BUTTON (and follow me... just look below the chart at top... yes, up there where "Kilroy" is watching!)
As always, I appreciate your support. Please share with others.
ENJOY!
Dan Hollings
Master Crypto Grid Trader
Please Explore My Other Indicators, Scripts, Grids and Educational Ideas.
@ DanHollings on Tradingview.

BOTTOM OF THE GOLD RANGE.... RIDE TO 1560 REDUX!!Yesterday was a day of consolidation and the gold trade didn't pan as I expected but I am a permabull so price going lower
was just more opportunities to long...
I longed asia open and watching a break on this hourly trendline
The break happened already as I was preparing the post so I am watching as it approaches the 21 hourly ema.
It won't hold as you look at the H4 21 hourly ema as it's sitting around 1504 (seen below)
Also MACD has a cross which should be and impule move up the next cross will be the one to take us to the top
Stoch way oversold
Here's what im looking for
-break of hourly trendline - check
-possibly retrace and break of the 4hr tl
- i will make another long on the 4hr candle close of that line
-bears at the 1500 and .50fib level will be on notice and should provide resistance
-looking to trap those bears and add long on the confirmation and break of the 1500 critical level
Setting bear traps all day....
Happy Huntin'
BooBii

BOTTOM OF THE RANGE on GOLD.... READY TO TAKE THE RIDE TO 1560??A little late posting on this however lots of buying opportunities!
Main thing to consider riskoff flows were taking profit and pretty much done across all risk assets.
Current Range is from 1495- 1560
We are in a great value are and on the hourly showing higher lows as shown below
Watch for entries down here placing stops below the lows aiming for the top of the range.
This is a very good value buying area... don't be a greedy bear looking to get trapped!!!
Will update this as we get more higher TF confirmation with the trendline breaks but personally
I current am in around 14.88 and 1493. Have a Limit at 1491 just in case of a retrace we could possibly get.
A nice break here will put us at 1510 where we should find some resistance.
Pros
-oversold stoch
-price being bought from under the 200 ema
-macd primed for a cross up
Cons
-still in downtrend
-against moving averages
Happy Huntin' Happy Trappin'
BooBii

AMD 1D RANGE & ASCENDING TRIANGLE TRADES
Descending Triangles, Triangles, Ascending Triangle and Ranges are repeatable trading chart patterns.
Triangles and ranges are consolidation chart patterns that can breakout either direction.
Ascending and descending chart patterns will have a directional bias depending on the previous incoming trend.
Each chart pattern will have defining trendlines of the support/resistance levels creating the pattern.
What ever time frame you are trading this chart pattern, wait for a candle close outside of the trendline in the direction of the breakout candle. (Our time frame preference is the Daily chart).
Add volume indicator - Volume is the amount of $ that went into a particular candle or in Forex the # of trades that took place.
Add ATR indicator - Volatility is the amount of price movement that occurred. Use the ATR to measure the price movement.
When you see descending Volume bars and descending ATR line (which indicates volatility) this shows
a dis-interest in traders to invest in this pair creating consolidation which creates the chart pattern.
Trade Management after there is a breakout candle close.
1 - Position size (compare volume bar to volume ma line).
a - Breakout candle must be 100% of average volume for a full position size.
b - If 75% of average volume then ½ position size. (To find 75% of Volume
look at the charts volume settings – divide smaller # into larger # = 75%+)
2 - Enter two trades.
3 - SL for both trades will be 1.5 x ATR.
4 - 1st trade TP will be 1 x ATR.
5 - No TP on 2nd trade – letting profit run and adjusting SL to follow price.
6 - When 1st TP hit – move 2nd trade SL to breakeven.
7 - Adjust the 2nd trade SL to follow price.
*8 – After Breakout candle – if price closes back into chart pattern close trade
*9 - When breakout candle is more than 1 ATR from breakout candle open.
a - Enter 1st trade at candle close with ½ position size.
b - Enter 2nd trade with a pending limit order that is 1 ATR of breakout candle open.
c – Price should pullback to that pending limit order for 2nd trade.
d – If Price returns back into chart pattern close trade before SL is hit.

CFD'S ON PALLADIUM RANGE TRADESRanges, Descending Triangles, Triangles, and Ascending Triangle are repeatable trading chart patterns.
Triangles and ranges are consolidation chart patterns that can breakout either direction.
Ascending and descending chart patterns will have a directional bias depending on the previous incoming trend.
Each chart pattern will have defining trendlines of the support/resistance levels creating the pattern.
What ever time frame you are trading this chart pattern, wait for a candle close outside of the trendline in the direction of the breakout candle. (Our time frame preference is the Daily chart).
Add volume indicator - Volume is the amount of $ that went into a particular candle or in Forex the # of trades that took place.
Add ATR indicator - Volatility is the amount of price movement that occurred. Use the ATR to measure the price movement.
When you see descending Volume bars and descending ATR line (which indicates volatility) this shows
a dis-interest in traders to invest in this pair creating consolidation which creates the chart pattern.
Trade Management after there is a breakout candle close.
1 - Position size (compare volume bar to volume ma line).
a - Breakout candle must be 100% of average volume for a full position size.
b - If 75% of average volume then ½ position size. (To find 75% of Volume
look at the charts volume settings – divide smaller # into larger # = 75%+)
2 - Enter two trades.
3 - SL for both trades will be 1.5 x ATR.
4 - 1st trade TP will be 1 x ATR.
5 - No TP on 2nd trade – letting profit run and adjusting SL to follow price.
6 - When 1st TP hit – move 2nd trade SL to breakeven.
7 - Adjust the 2nd trade SL to follow price.
*8 – After Breakout candle – if price closes back into chart pattern close trade
*9 - When breakout candle is more than 1 ATR from breakout candle open.
a - Enter 1st trade at candle close with ½ position size.
b - Enter 2nd trade with a pending limit order that is 1 ATR of breakout candle open.
c – Price should pullback to that pending limit order for 2nd trade.
d – If Price returns back into chart pattern close trade before SL is hit.

S&P 500 E-MINI FUTURES RANGE TRADEPrice was in a range pattern
Price broke above the Range Top
Range, Descending Triangles, Triangles, and Ascending Triangle are repeatable trading chart patterns.
Triangles and ranges are consolidation chart patterns that can breakout either direction.
Ascending and descending chart patterns will have a directional bias depending on the previous incoming trend.
Each chart pattern will have defining trendlines of the support/resistance levels creating the pattern.
What ever time frame you are trading this chart pattern, wait for a candle close outside of the trendline in the direction of the breakout candle. (Our time frame preference is the Daily chart).
Add volume indicator - Volume is the amount of $ that went into a particular candle or in Forex the # of trades that took place.
Add ATR indicator - Volatility is the amount of price movement that occurred. Use the ATR to measure the price movement.
When you see descending Volume bars and descending ATR line (which indicates volatility) this shows
a dis-interest in traders to invest in this pair creating consolidation which creates the chart pattern.
Trade Management after there is a breakout candle close.
1 - Position size (compare volume bar to volume ma line).
a - Breakout candle must be 100% of average volume for a full position size.
b - If 75% of average volume then ½ position size. (To find 75% of Volume
look at the charts volume settings – divide smaller # into larger # = 75%+)
2 - Enter two trades.
3 - SL for both trades will be 1.5 x ATR.
4 - 1st trade TP will be 1 x ATR.
5 - No TP on 2nd trade – letting profit run and adjusting SL to follow price.
6 - When 1st TP hit – move 2nd trade SL to breakeven.
7 - Adjust the 2nd trade SL to follow price.
*8 – After Breakout candle – if price closes back into chart pattern close trade
*9 - When breakout candle is more than 1 ATR from breakout candle open.
a - Enter 1st trade at candle close with ½ position size.
b - Enter 2nd trade with a pending limit order that is 1 ATR of breakout candle open.
c – Price should pullback to that pending limit order for 2nd trade.
d – If Price returns back into chart pattern close trade before SL is hit.

USD/CAD Technical analysisThe counter is currently in a sideways pattern.
It has broken its mid point of the range.
Hence, we expect the pair to move to its lower end of the range.

Possible Range tradeFX:AUDCHF
4HR
A possible range trade for the aud/chf.
I am looking at an entry of 0.6675 and a take profit at 0.6545 with S/L at 0.6700

ETCUSD 1D RANGE TRADESRanges, Descending Triangles, Triangles, and Ascending Triangle are repeatable trading chart patterns.
Triangles and ranges are consolidation chart patterns that can breakout either direction.
Ascending and descending chart patterns will have a directional bias depending on the previous incoming trend.
Each chart pattern will have defining trendlines of the support/resistance levels creating the pattern.
What ever time frame you are trading this chart pattern, wait for a candle close outside of the trendline in the direction of the breakout candle. (Our time frame preference is the Daily chart).
Add volume indicator - Volume is the amount of $ that went into a particular candle or in Forex the # of trades that took place.
Add ATR indicator - Volatility is the amount of price movement that occurred. Use the ATR to measure the price movement.
When you see descending Volume bars and descending ATR line (which indicates volatility) this shows
a dis-interest in traders to invest in this pair creating consolidation which creates the chart pattern.
Trade Management after there is a breakout candle close.
1 - Position size (compare volume bar to volume ma line).
a - Breakout candle must be 100% of average volume for a full position size.
b - If 75% of average volume then ½ position size. (To find 75% of Volume
look at the charts volume settings – divide smaller # into larger # = 75%+)
2 - Enter two trades.
3 - SL for both trades will be 1.5 x ATR.
4 - 1st trade TP will be 1 x ATR.
5 - No TP on 2nd trade – letting profit run and adjusting SL to follow price.
6 - When 1st TP hit – move 2nd trade SL to breakeven.
7 - Adjust the 2nd trade SL to follow price.
*8 – After Breakout candle – if price closes back into chart pattern close trade
*9 - When breakout candle is more than 1 ATR from breakout candle open.
a - Enter 1st trade at candle close with ½ position size.
b - Enter 2nd trade with a pending limit order that is 1 ATR of breakout candle open.
c – Price should pullback to that pending limit order for 2nd trade.
d – If Price returns back into chart pattern close trade before SL is hit.

DISH 1D RANGE TRADESRanges, Triangles, Descending Triangles, & Ascending Triangle are repeatable trading chart patterns.
Triangles and ranges are consolidation chart patterns that can breakout either direction.
Ascending and descending chart patterns will have a directional bias depending on the previous incoming trend.
Each chart pattern will have defining trendlines of the support/resistance levels creating the pattern.
What ever time frame you are trading this chart pattern, wait for a candle close outside of the trendline in the direction of the breakout candle. (Our time frame preference is the Daily chart ).
Add volume indicator - Volume is the amount of $ that went into a particular candle or in Forex the # of trades that took place.
Add ATR indicator - Volatility is the amount of price movement that occurred. Use the ATR to measure the price movement.
When you see descending Volume bars and descending ATR line (which indicates volatility ) this shows
a dis-interest in traders to invest in this pair creating consolidation which creates the chart pattern.
Trade Management after there is a breakout candle close.
1 - Position size (compare volume bar to volume ma line).
a - Breakout candle must be 100% of average volume for a full position size.
b - If 75% of average volume then ½ position size. (To find 75% of Volume
look at the charts volume settings – divide smaller # into larger # = 75%+)
2 - Enter two trades.
3 - SL for both trades will be 1.5 x ATR.
4 - 1st trade TP will be 1 x ATR.
5 - No TP on 2nd trade – letting profit run and adjusting SL to follow price.
6 - When 1st TP hit – move 2nd trade SL to breakeven.
7 - Adjust the 2nd trade SL to follow price.
*8 – After Breakout candle – if price closes back into chart pattern close trade
*9 - When breakout candle is more than 1 ATR from breakout candle open.
a - Enter 1st trade at candle close with ½ position size.
b - Enter 2nd trade with a pending limit order that is 1 ATR of breakout candle open.
c – Price should pullback to that pending limit order for 2nd trade.
d – If Price returns back into chart pattern close trade before SL is hit.

WHAT IS WALGREENS ABOOTS ALLIANCE - 1D RANGE TRADESRanges, Descending Triangles, Triangles, and Ascending Triangle are repeatable trading chart patterns.
Ranges and Triangles are consolidation chart patterns that can breakout either direction.
Ascending and descending chart patterns will have a directional bias depending on the previous incoming trend.
Each chart pattern will have defining trendlines of the support/resistance levels creating the pattern.
What ever time frame you are trading this chart pattern, wait for a candle close outside of the trendline in the direction of the breakout candle. (Our time frame preference is the Daily chart).
Add volume indicator - Volume is the amount of $ that went into a particular candle or in Forex the # of trades that took place.
Add ATR indicator - Volatility is the amount of price movement that occurred. Use the ATR to measure the price movement.
When you see descending Volume bars and descending ATR line (which indicates volatility) this shows
a dis-interest in traders to invest in this pair creating consolidation which creates the chart pattern.
Trade Management after there is a breakout candle close.
1 - Position size (compare volume bar to volume ma line).
a - Breakout candle must be 100% of average volume for a full position size.
b - If 75% of average volume then ½ position size. (To find 75% of Volume
look at the charts volume settings – divide smaller # into larger # = 75%+)
2 - Enter two trades.
3 - SL for both trades will be 1.5 x ATR.
4 - 1st trade TP will be 1 x ATR.
5 - No TP on 2nd trade – letting profit run and adjusting SL to follow price.
6 - When 1st TP hit – move 2nd trade SL to breakeven.
7 - Adjust the 2nd trade SL to follow price.
*8 – After Breakout candle – if price closes back into chart pattern close trade
*9 - When breakout candle is more than 1 ATR from breakout candle open.
a - Enter 1st trade at candle close with ½ position size.
b - Enter 2nd trade with a pending limit order that is 1 ATR of breakout candle open.
c – Price should pullback to that pending limit order for 2nd trade.
d – If Price returns back into chart pattern close trade before SL is hit.

SPX trading ranges for all time frames} FOREXCOM:SPXUSD
Extremely simple chart that allows to trade LONG/SHORT against reliable levels in various time intervals. imo
If/when interested in fine tuned trading strategy with risk management feel free to take contact with me.

JOHNSON & JOHNSON 1D IS IN A RANGE & BEARISG FLAGBearish Flag is a form of range pattern
Ranges, Descending Triangles, Triangles, & Ascending Triangle are repeatable trading chart patterns.
Triangles and ranges are consolidation chart patterns that can breakout either direction.
Ascending and descending chart patterns will have a directional bias depending on the previous incoming trend.
Each chart pattern will have defining trendlines of the support/resistance levels creating the pattern.
What ever time frame you are trading this chart pattern, wait for a candle close outside of the trendline in the direction of the breakout candle. (Our time frame preference is the Daily chart ).
Add volume indicator - Volume is the amount of $ that went into a particular candle or in Forex the # of trades that took place.
Add ATR indicator - Volatility is the amount of price movement that occurred. Use the ATR to measure the price movement.
When you see descending volume bars and descending atr line (which indicates volatility ) this shows
a dis-interest in traders to invest in this pair creating consolidation which creates the chart pattern.
Trade Management after there is a breakout candle close.
1 - Position size (compare volume bar to volume ma line).
a - Breakout candle must be 100% of average volume for a full position size.
b - If 75% of average volume then ½ position size.
2 - Enter two trades.
3 - SL for both trades will be 1.5 x ATR.
4 - 1st trade TP will be 1 x ATR.
5 - No TP on 2nd trade – letting profit run and adjusting SL to follow price.
6 - When 1st TP hit – move 2nd trade SL to breakeven.
7 - Adjust the 2nd trade SL to follow price.
*8 - When breakout candle is more than 1 ATR from breakout candle open.
a - Enter 1st trade at candle close with ½ position size.
b - Enter 2nd trade with a pending limit order that is 1 ATR of breakout candle open.
c – Price should pullback to that pending limit order for 2nd trade.
d – If Price returns back into chart pattern close trade before SL is hit.

RUSSELL 2000 1D RANGE TRADESRanges, Descending Triangles, Triangles, & Ascending Triangle are repeatable trading chart patterns.
Triangles and ranges are consolidation chart patterns that can breakout either direction.
Ascending and descending chart patterns will have a directional bias depending on the previous incoming trend.
Each chart pattern will have defining trendlines of the support/resistance levels creating the pattern.
What ever time frame you are trading this chart pattern, wait for a candle close outside of the trendline in the direction of the breakout candle. (Our time frame preference is the Daily chart).
Add volume indicator - Volume is the amount of $ that went into a particular candle or in Forex the # of trades that took place.
Add ATR indicator - Volatility is the amount of price movement that occurred. Use the ATR to measure the price movement.
When you see descending volume bars and descending atr line (which indicates volatility) this shows
a dis-interest in traders to invest in this pair creating consolidation which creates the chart pattern.
Trade Management after there is a breakout candle close.
1 - Position size (compare volume bar to volume ma line).
a - Breakout candle must be 100% of average volume for a full position size.
b - If 75% of average volume then ½ position size.
2 - Enter two trades.
3 - SL for both trades will be 1.5 x ATR.
4 - 1st trade TP will be 1 x ATR.
5 - No TP on 2nd trade – letting profit run and adjusting SL to follow price.
6 - When 1st TP hit – move 2nd trade SL to breakeven.
7 - Adjust the 2nd trade SL to follow price.
*8 - When breakout candle is more than 1 ATR from breakout candle open.
a - Enter 1st trade at candle close with ½ position size.
b - Enter 2nd trade with a pending limit order that is 1 ATR of breakout candle open.
c – Price should pullback to that pending limit order for 2nd trade.
d – If Price returns back into chart pattern close trade before SL is hit.

BTC 14000 OR 10800 FIRST??Check out:
1) Last week trade analysis for determining BTC bias -
2) CME BTC Quotes - www.cmegroup.com
Key levels outlined:
1) 10609.5 - June Monthly Mid Range - Thick Black lines
2) 10800 - 3rd Quarter Open - Thick Blue line
3) 11513 - Previous weekly level
4) 11746.1 - Weekly Mid Range
Confluence for trade idea:
1) June Monthly Mid range
2) 3rd Quarter Open
3) Unfilled CME Gap
Invalidation: Weekly close below 10609.5

AMD 1D RANGE TRADESRanges, Descending Triangles, Triangles, and Ascending Triangle are repeatable trading chart patterns.
Triangles and ranges are consolidation chart patterns that can breakout either direction.
Ascending and descending chart patterns will have a directional bias depending on the previous incoming trend.
Each chart pattern will have defining trendlines of the support/resistance levels creating the pattern.
What ever time frame you are trading this chart pattern, wait for a candle close outside of the trendline in the direction of the breakout candle. (Our time frame preference is the Daily chart).
Add volume indicator - Volume is the amount of $ that went into a particular candle or in Forex the # of trades that took place.
Add ATR indicator - Volatility is the amount of price movement that occurred. Use the ATR to measure the price movement.
When you see descending volume bars and descending atr line (which indicates volatility) this shows
a dis-interest in traders to invest in this pair creating consolidation which creates the chart pattern.
Trade Management after there is a breakout candle close.
1 - Position size (compare volume bar to volume ma line).
a - Breakout candle must be 100% of average volume for a full position size.
b - If 75% of average volume then ½ position size.
2 - Enter two trades.
3 - SL for both trades will be 1.5 x ATR.
4 - 1st trade TP will be 1 x ATR.
5 - No TP on 2nd trade – letting profit run and adjusting SL to follow price.
6 - When 1st TP hit – move 2nd trade SL to breakeven.
7 - Adjust the 2nd trade SL to follow price.
*8 - When breakout candle is more than 1 ATR from breakout candle open.
a - Enter 1st trade at candle close with ½ position size.
b - Enter 2nd trade with a pending limit order that is 1 ATR of breakout candle open.
c – Price should pullback to that pending limit order for 2nd trade.
d – If Price returns back into chart pattern close trade before SL is hit.

XRPUSD 1D RANGE TRADESPrice is in a Range Trade chart pattern
Wait for a daily close outside Range for direction
Breakout candle must be
100% of Average Volume
for a full size position
75% of Average Volume
for 1/2 size position
SL is 1.5 x ATR
TP is 1 x ATR

BOEING 1D RANGE TRADESRanges, Descending Triangles, Triangles, and Ascending Triangle are repeatable trading chart patterns.
Ranges and Triangles are consolidation chart patterns that can breakout either direction.
Ascending and descending chart patterns will have a directional bias depending on the previous incoming trend.
Each chart pattern will have defining trendlines of the support/resistance levels creating the pattern.
What ever time frame you are trading this chart pattern, wait for a candle close outside of the trendline in the direction of the breakout candle. (Our time frame preference is the Daily chart ).
Add volume indicator - Volume is the amount of $ that went into a particular candle or in Forex the # of trades that took place.
Add ATR indicator - Volatility is the amount of price movement that occurred. Use the ATR to measure the price movement.
When you see descending volume bars and descending atr line (which indicates volatility ) this shows
a dis-interest in traders to invest in this pair creating consolidation which creates the chart pattern.
Trade Management after there is a breakout candle close.
1 - Position size (compare volume bar to volume ma line).
a - Breakout candle must be 100% of average volume for a full position size.
b - If 75% of average volume then ½ position size.
2 - Enter two trades.
3 - SL for both trades will be 1.5 x ATR.
4 - 1st trade TP will be 1 x ATR.
5 - No TP on 2nd trade – letting profit run and adjusting SL to follow price.
6 - When 1st TP hit – move 2nd trade SL to breakeven.
7 - Adjust the 2nd trade SL to follow price.
*8 - When breakout candle is more than 1 ATR from breakout candle open.
a - Enter 1st trade at candle close with ½ position size.
b - Enter 2nd trade with a pending limit order that is 1 ATR of breakout candle open.
c – Price should pullback to that pending limit order for 2nd trade.
d – If Price returns back into chart pattern close trade before SL is hit.

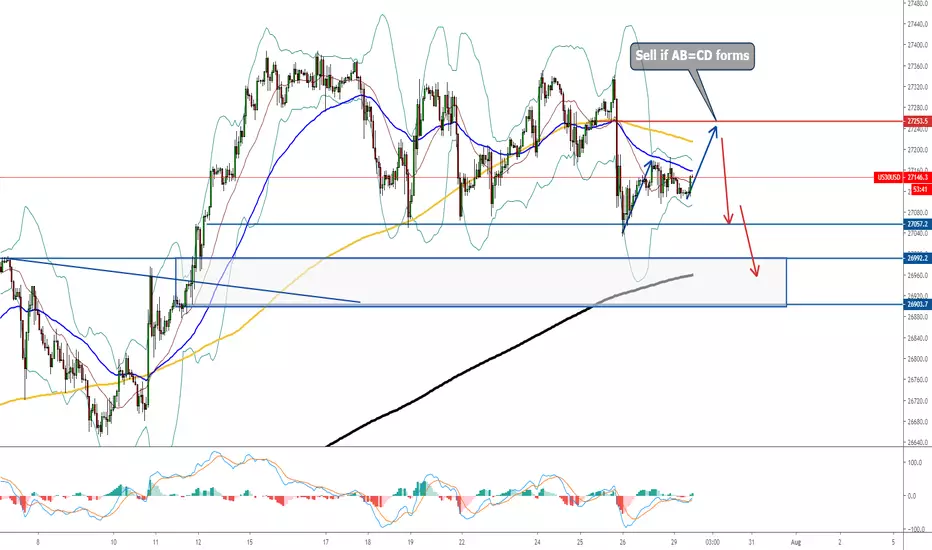
US30: Intraday Sell Upon ABCDUS30 has been consolidating for the past 2 weeks and the closing price of the daily candle is also getting lower.
Putting aside fundamental and just trading with pure technical analysis for the short-term, selling the US30 near the range high could be a good opportunity.
The price is now retracing higher from the bottom of the consolidation while an ABCD formation may form if it continues to retrace higher.
Look for sell opportunity if ABCD forms around 27250 and aim to take profit either at the previous low or within the key demand zone just below 27000.