BTCUSDTBTCUSDT is trading in range bound with 10% range.
some time ranges are the best things to play just buy the support and sell the resistance.
as this one is 10% range which can deliver fine risk to reward.
currently the price is at resistance level and being rejected due to sell pressure.
will the pair head back to support area ?
what you guys think of this idea ?
Rangetrading

Are you ready to make some money from the forex market? 🤑💌Our AI screener has detected a great opportunity for you: NZDCAD is in a ranging market for the next few days!
What does that mean? It means that the price is moving sideways between two levels: 0.8153 and 0.8333. That’s a range of 170 pips or more!
How can you profit from this situation?
📊There are two ways:
👨💻If you are a manual trader, you can use oscillators like RSI, Stoch, or MACD divergence to spot the best entry points for both long and short trades. You can use lower timeframes like M15 or M5 to find these signals.
🤖If you are a bot trader, you can use a martingale or zone strategy with proper risk control and money management. Trading with a bot will save you time and effort, as you don’t have to watch the charts all the time. You just need to check the bot trading every 4 hours to see if the market pattern changes from ranging to trending. If it does, you can close the bot and take your profits!
This is a simple and effective way to make money from the forex market. But act fast, this opportunity won’t last forever! 🔥
To get more trading ideas like this, follow our channel and subscribe to our newsletter. We will send you the best forex signals and tips every week. Don’t miss this chance to earn money online with us! 😊
Disclaimer: Trading forex is risky and you should only trade with money you can afford to lose. We are not responsible for any losses you may incur from following our signals. Always do your own research and analysis before placing any trades.

Arbitrum ($ARB) - Ranging for now, demand sitting belowThis idea is that ARB will see ranging price action with significant swings over the coming days weeks. Reclaiming the equilibrium would be major, but not sure if we get that just yet.
If the range is lost, I see this heading toward $1.30
Some serious gains to be made even if it ranges for a little while. Overall structure is strong and bullish for a longer term outlook however.
Cheers


USDCAD: Bearish Harmonic Pattern and Weekly Range DynamicsThe USDCAD market is currently exhibiting the formation of a potential bearish bat pattern. Notably, the price is approaching a daily level that coincides with a 4-hour order block. This convergence is significant as it marks the completion of the D leg of our discernible bat harmonic pattern. Additionally, it's worth mentioning that the overall market structure is displaying a bearish bias.
Despite the bearish sentiment in the shorter time frames, it's essential to note that the weekly chart indicates a trading range. This information adds a layer of nuance to the analysis, suggesting a potential conflict between short-term bearish dynamics and a more neutral stance in the longer term.
In light of these technical observations, a potential short-trading opportunity is anticipated. The confluence of the bearish bat pattern, alignment with the 4-hour order block at the daily level, and the bearish structure on lower time frames adds an extra layer of confirmation to the trade setup. Traders are advised to exercise due diligence, considering both the potential for a reversal in the indicated zone and the overarching range-bound behavior on the weekly chart. Goodluck!

GBPJPYGBPJPY is trading in range bound with 500 pips range.
some time ranges are the best things to play just buy the support and sell the resistance.
as this one is 500 pips range which can deliver fine risk to reward.
currently the price is at resistance level and being rejected due to sell pressure.
will the pair head back to support area ?
what you guys think of this idea ?

Preparing for BOC Rate CutsSummary
The Bank of Canada(BOC) could be one of the first central banks to cut rates, meaning a weaker CAD. Could USDCAD move off the 15-month range support?
The Details
Canadian inflation is approaching the 2% target, suggesting no further rate hikes by the BOC. Interest rates will then temporarily pause, which could cause CAD indecision.
However, economic data for Canada is weak, signalling recession. A high and climbing unemployment rate strengthens recession fears. Recession may lead to rate cuts - before the US and other Western economies - weakening the CAD over other currencies.
Things to Consider
The Bank of England may be one of the last central banks to cut rates. Higher for longer is the current narrative for UK interest rates. Buying opportunities on GBPCAD could be more lucrative.
The US often leads when it comes to rate changes. However, the US economy is performing well even with the current high rates, meaning Canada (and maybe the EU) may cut rates before the US

SYMPHONY a good buy for 44% and 89% returnsSymphony is a big player in air cooler segment and the company is showing a buy signal under range bound trading strategy where the stock covers a range of price set it has covered multiple times in the past.
Buying level- 875
CMP- 885 (close to buying level)
Target price 1- 1216
Target price 2- 1593
Hope you understood.
Thank you for reading.
Have a happy trading and investing experience

GBPCHFGBPCHF exhausting at the horizontal resistance. Pair is moving in just one direction. After a great impulsive move we have seen a little correction this time it has created a double top structure with a significant bullish divergence( at lower TF) near the solid resistance zone and two to three times pair just respect the mentioned support and move upward. Again it hits the same zone and moving towards the horizontal support.

Hard to breakout for this time | Short BiasOn 4h TF
I think FXS hardly to breakout the resistance for this time
Liquidity can happen, that's potential short with high risk
Wait for next move

NZDCHFNZDCHF exhausting at the horizontal resistance. Pair is moving in just one direction. After a great impulsive move we have seen a little correction this time it has created a double top structure with a significant bullish divergence( at lower TF) near the solid resistance zone and two to three times pair just respect the mentioned support and move upward. Again it hits the same zone and moving towards the horizontal support.

AUDJPYAUDJPY exhausting at the horizontal resistance. Pair is moving in just one direction. After a great impulsive move we have seen a little correction this time it has created a double top structure with a significant bullish divergence( at lower TF) near the solid resistance zone and two to three times pair just respect the mentioned support and move upward. Again it hits the same zone and moving towards the horizontal support.

CADCHFRising from the horizontal support. Pair is moving in just one direction. After a great impulsive move we have seen a little correction this time it has created a triple Bottom structure with a significant bullish divergence near the solid support zone and two to three times pair just respect the mentioned support and move upward. Again it hits the same zone and moving towards the horizontal resistance.

Bitcoin's typical weekend activity and "howto" w/Voodoo LevelsVoodoo levels tip: When low volatility is expected (like over the weekend), price on an intraday basis will most likely range between DH1 and DL1 levels.
Exceptions can always happen. But expecting low volatility and mean reversion at the CME open on Sunday is something I continue to bet on.
Enjoy your weekend!

CHFJPYIs CHFJPY exhausting at highs?
As the price is been on high bull run but now it seems like price is lacking bullish momentum after printing double top pattern at resistance level and bearish divergence suggesting the sell pressure is about to start.
If the bears took control , the 1st target could be 165.10 followed by 164.
What you guys think of it?

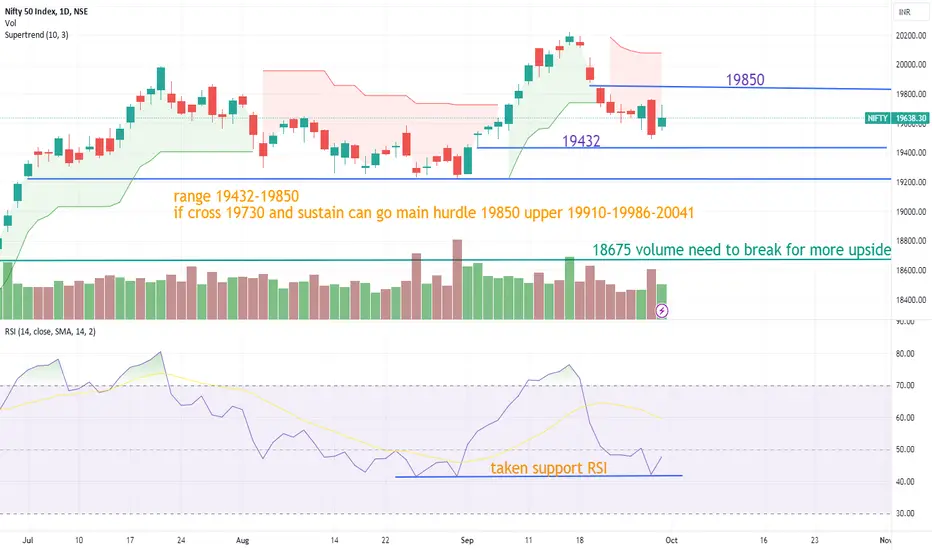
nifty clear in range for mild positive biasHurdle facing 19850 close above for 200+ more to gain but conditioning buy above 19730 aggressive till then below range around 19432 buy upper range 19850 sell .... Tight range of 400 point ... Its time correction.. Either side breakout need to cross or break till then enjoy the range 19432-19850 ... Have a wandastic coming october month ...
GBPAUDPrice is moving between support and Resistance no big move we have seen for the last few days. recently the price was trading in descending channel and will drop before the horizontal resistance but pair successfully broke it and hit the horizontal resistance then drop down towards the support. Now again it is being expected that, near the horizontal resistance price will push down and start it's bearish journey

A Macro Analysis of TESLA: The Case For Being Range BoundHi guys and Welcome!
As a trader its empowering to overanalyze an asset you would like to trade.
To think of various potential associations or the direction that price action can have or go.
It reduces any surprises and allows for you to be ready and strategize adjustments.
And just NOTE: That this is just an idea/ theory and it does not have to play out as mentioned but i would urge us to atleast keep this idea in the back of our heads.
Things have been great this year, with many big names booming in price.
Many people calling for New ALL TIME HIGHS for many names.
This is also true for TESLA.
But what if we don't see all time highs in Tesla? What if in fact we are range bound, hitting the top of the range only to travel to the bottom of the range for a duration of time before we attempt new all time highs.
It sure is a possibility, as we have done so previously.
From July 2013 till the breakout in December 2019, we managed to stay in a RANGE.
(Roughly 2345 days or 6ish years).
This is not a bad thing per se. It helps the asset consolidate, create market structure and allows companies to stabilize, allowing them to fulfill the desires of investor sentiment, thus moving higher eventually.
If you can determine the levels of the range, it is also tradeable. More on that in future posts, as i will be monitoring TSLA like a hawk.
Now looking at our current RANGE. We've gone so far 1093 days. If history is any indication, we are about almost half way through our RANGE bound journey.
Note that if we are range bound, it doesnt have to mirror our previous data point.
Also that Investor SENTIMENT for TSLA is different now.
Also don't discount the fact that currently we are bullish in TSLA, so possibilities of seeing $400 sooner than later is likely, until proven otherwise.
Could we break out or do we double top/ stay range bound?
That would be the place to re-assess the situation.
One major factor in my opinion to help us determine what might happen is VOLUME.
I think for us to really solidfy this idea of making New ALL TIME HIGHS, volume has to continue to increase and really spike when we reach the $400, RANGE TOP.
We don't want to see volume below the PURPLE LINE DRAWN, but rather have it follow the GREEN arrow. Showing consistent growth and high volume.
Also another thing to watch is the RSI.
NOTICE the Black trend lines drawn.
When we broke out of our 2013-2019 Range, RSI broke past the Black trend line to continue into our HIGHS.
Come to current time, we are quite far off the Black Trendline drawn. This is something to watch.
Again, history does not have to repeat in current price action BUT it does provide data on what could potentially happen. As a trader it is important to always try to see different angles.
__________________________________________________________________________________
Thank you for taking the time to read my analysis. Hope it helped keep you informed. Please do support my ideas by boosting, following me and commenting. Thanks again.
Stay tuned for more updates on TSLA in the near future.
If you have any questions, do reach out. Thank you again.
DISCLAIMER: This is not financial advice, i am not a financial advisor. The thoughts expressed in the posts are my opinion and for educational purposes. Do not use my ideas for the basis of your trading strategy, make sure to work out your own strategy and when trading always spend majority of your time on risk management strategy

EURJPYEURJPY is trading in range and perfectly testing the lows and highs of the range.
Ranges are best in a sense just buy the support and sell the resistance.
Currently the price is hovering near the support level and seems like a fine buying opportunity.
If buyers attacks the support zone , it will be the easy ride of 163 pips.

XAUUSDXAUUSD is trading in range and perfectly testing the lows and highs of the range.
Ranges are best in a sense just buy the support and sell the resistance.
Currently the price is hovering near the support level and seems like a fine buying opportunity.
If buyers attacks the support zone , it will be the easy ride of $15.

Rising wedge & crytical resist zone for BTCPure , fast , simple TA for BTC USD 1W tf .. so im looking for shorts after BTC price fall down from rising wedge , supported with bearish divergence ..My entry zone is somewhere from 28000USD to 30200USD .. For SL looking at 32850USD
I can see on chart also potentional H&S pattern .. neckline will be my potentional TP1 .. somewhere near 25000USD... Its only my personal opinion .. Have a nice day , leave comment what do you thing about , if agree or if nope . See you guys , when first entry to position :D
Do not trade what you think , trade what you see ...

CFXUSDTCFXUSDT, after recent massive selloff, CFXUSDT was trading in range and now has strong breakout from range.
If this breakout holds and bulls stay in the market the next target could be 0.1560.
What you guys think of it ?

How to identify a trend move using AnchorsIn the video I discuss the concept of Anchors in trading and how I use them in my own trading.
Anchors play a major part in identifying the prime areas to trade and also in risk management when in a trade. I will discuss my prime setups and trading areas using anchors and multi-timeframe analysis.
** If you like the content then take a look at the profile to get more daily ideas and learning material **
** Comments and likes are greatly appreciated **
