EURCADEURCAD has formed a wide range of over 100 pips.
Sometime ranges are good phase to trade , just sell the top and buy the bottom.
As the the EURO has fall sharply to support zone with bullish divergence, it seems like now is the time for bulls to take control.
What you guys think of this idea?
Rangetrading

CADCHFCADCHF is trading at support level.
recently the price has shown good bullish reaction from this level. As the price has created local bearish channel. fortunately the support of the channel is at major support level.
Will the bulls attack this level.

EURCHFEURCHF is trading in wide range of 100 pips.
recently the price has break the inclining trendline and now retesting the broken trendline which is also the 50% Fib retracement area.
This as a whole is good confluence for sellers to send price even lower.
What you people think of this idea?

WLDUSDTAfter recent bullish move ,WLDUSDT now playing in range bound.
Sometime ranges are best thing to play just buy the high and sell the low.
As WLDUSDT has formed the range of almost 23% , it will be beneficial option for bulls to attack this pattern.

Range getting tighter.Bajaj Finserv weekly chart in a narrowing range. Above 1660, we could see 1900, below 1220, 1050 could be possible. Which way will this breakout?
❤ & follow for more.

Pull back to 0.95Monthly Chart
SUSHI BINANCE:SUSHIUSDT has downed 98% from ATH and created a reversal pattern DB
Daily Chart
Now, SUSHI is trading at 0.71x
BINANCE:SUSHIUSDT will move up to 0.95 for correction phase
Chart 4H TF
BINANCE:SUSHIUSDT is range from 0.7 - 0.75
Wait for breakout that range

A Trade Example in The Nasdaq Futures Using a Simple TA ConceptThis was a really clean example of a really basic price action based set-up. On the short-lived Holy Grail trade(See my most recent live stream for a walkthrough of the holy grail trade set-up) that resulted in a false breakout, price begins to reverse and want to cross back through the established range on the 5 minute chart, as we begin tending back towards the middle of the range, we want to enter a trade, playing short term, attempting to take out the range high. I am currently working on getting my profits off the table much earlier and not being a "dick for a tick" so any time I get a trade between 2-4 R in my favor, I am taking my profits and running. I narrate all of this in this video
CME_MINI:MNQ1!

GBPCHF I Range trading strategy Welcome back! Let me know your thoughts in the comments!
** GBPCHF Analysis - Listen to video!
We recommend that you keep this pair on your watchlist and enter when the entry criteria of your strategy is met.
Please support this idea with a LIKE and COMMENT if you find it useful and Click "Follow" on our profile if you'd like these trade ideas delivered straight to your email in the future.
Thanks for your continued support!

TEAMLEASE 40% gain in 5 monthsThe share trades between a range of 1992 and 3212 and has covered the gap of 60% for 3 times in previous years. From the present level it can give a return of 40% in less than 5 months as per previous chart patterns. But the company is a small cap company so a risky bet to play. Please put money after deep thinking. The current P/E ratio is very low than the 7-year average P/E ratio and the company has significantly increased its revenue and net profit, so it becomes safer to buy it at this point of time. Present market analysis shows that it will furthur increase its revenue and net profit this year.
Thank you for reading it to the last

GBPJPYGBPJPY is trading in wide range of 400 pips and the Pair near the horizontal and vertical resistance.
Near any resistance need bearish rejection for good down side move

🚀🎯 GBPJPY Bullish Momentum: Capitalizing on the Range! 📈Hey traders! Are you ready for an exciting ride on the GBPJPY forex pair in the 4-hour timeframe? 📈💹 Let's explore this fantastic bullish setup together!
📊 Range-Bound Market: GBPJPY is currently experiencing a ranging market, with strong support at 180.000 and a formidable resistance at 183.500. In this dynamic environment, traders can spot lucrative opportunities by buying the bottom and shorting the top.
🐂 Buyers in Control: The buyers have taken charge as the price recently bounced off the sturdy support level at 180.000 and formed a double bottom
🛡️ Moving Averages as Support: The moving averages are playing their part as reliable support levels during this bullish momentum. Their alignment reinforces the buyers' strength and provides additional confidence in this setup.
💹 Profit Target: My primary focus is on riding this bullish wave towards the top of the range. As the price approaches the resistance at 183.500, I'll closely monitor the market for a potential shorting opportunity or a breakout setup.
Feel free to share your toughts in the comments section, follow me for updates and don't forget to press the like button if this insight was helpful 🚀

GBPJPYPrice has formed a fine range. As we can see pair already broke the falling trendline and also retest trendline zone is well. we are expecting bullish rally may start again to hit the major resistance in coming day

$TRAC (BRC-20): trading and accumulating = investing into BTCThe BRC-20 token LSE:TRAC (don't confuse it with OriginTrail, same ticker) is trading on decentralized exchanges (you need a BTC wallet like Ordinalswallet, XVerse, Unisat) and on Gate.io.
It is a fundamentally very interesting project with a market cap below $10M, the indexer of the BRC-20/Ordinals space on Bitcoin. Lot of room to the upside, but, obviously, also high risk.
I am very bullish on the project and I am using each opportunity to benefit from its high volatility on Gate.io. The black lvls on the chart are the S/R areas where the price is constantly ranging between. I am selling resistances, buying supports. If it breaks the resistance I buy the retest/support and sell the next resistance. If it breaks down I buy the next support. It's basically trading 101. I make 5% or 10% a few times a day.
Bought today's dip at 37c, sold a small bag at 54c.
The green levels/areas are demand zones of different importance. Between 35 and 44c strong support. At the time of writing at $0.47, I consider this still as cheap.
NFA.
I am not selling as much as I buy tho, accumulating this coin for further upside.
DYOR. You do you, I do I.

IDUSDTIDUSDT is in fine range of 12%. currently it is trading at the lower side of the range as it is has broke the local falling trendline it seems like it will head to upper side of the range.

CPI (June)CPI YoY:
Forecast: 3.1%
Previous: 4.0%
Actual: ?
With CPI on the very near horizon, here are my thoughts on what Bitcoin could do in terms of price action:
Bullish scenario - We all know that CPI tends to be a volatile event with aggressive whipsaws in price in both directions irrespective of the outcome. Therefore there is an opportunity to capitalise on the frantic LTF price action.
For the bulls A good place to enter is the local range low if we see a reclaim after a demand zone sweep. I think this is fairly likely and ideally we see price move to the downside first upon the data release as in general, THE FIRST MOVE IS THE WRONG MOVE... following this initial move to the downside a reclaim would be primed for local highs in my opinion. If there is no reclaim then unfortunately there really isn't much support on the way down as BTC would seek to fill the FVG at 27K. A reaction off this level will leave BTC in a good place to attack 32.5k, reinforced with the ETF narrative and decision coming not too far down the line.
Bearish scenario - As was suggested previously, the first move is wrong, therefore the second move is the true move and for the bears it's the opposite to the bulls. If we see price move to the upside upon data release, I would like to see a SFP of the local range highs before entering short with the range midpoint as first target, then range low, then FVG as final target. If that LTF range high holds after being broken, I would like to see a strong wick up into 32.5K resistance and a reaction off this level to the downside and supply liquidity has been taken. Any slow grind up into this level would have me concerned as to BTC printing a swing fail and not just blasting through after consolidating. If that does play out then I would re-evaluate and stay in cash while doing so.
Reminder: First move is the wrong move.
CPI is usually very volatile and therefor risky. It's easy to FOMO into random positions as a gamble, the market usually wins in those positions.

GOLD on a strong Buy zoneif Gold takes out the sell zone as in the red arrow shows, expect a possible rise after a retracement with respect to the strong buy zone.
at this moment gold is in range between these two zones, looking at the candles it obvious seeing a bullish momentum candles, indicating a possibility that the sell zone will not hold.
seeing a momentum candle on a demand zone(buy zone) Gold should rise to 1948.85.

EURUSD | PingPong of EMAs
It's been a long time since I took a look at the Forex market, so I'll start with our Euro against the USD.
If truth be told, I haven't missed much since 3 months ago.
As the title says, as see a PingPong game of the EMA 200 and 800 or in other words:
It is nothing more than a range.
This leads to the simple idea to trade the Reaction.
In fact, currently we are back at the daily EMA800, with a good chance that we get a divergence in the TDI.
I would leave some space for the SL, since, as seen in May we could well play a little above the EMA.
As a target for the time being the EMA200 should be targeted, if this is reached, one can ride the remaining position.

GBPUSD SHORTGBPUSD present an opportunity to go short as price return to breakout rang,details on the chart..
Price range is very important, it tells us what time volume is introduced to the market, some traders rely on volume pofile indicator,, ATR and other indicators but it is better to determine volume using candlesticks range.
A trader must learn to study!

Interesting trendline and midrangeJust noticed this interesting trendline going back to 2016 that's holding strong, coinciding with a retest of a midrange going back to 2015.
Looks primed to head to the top of the range. From there we'll see if it begins a new range above this one.

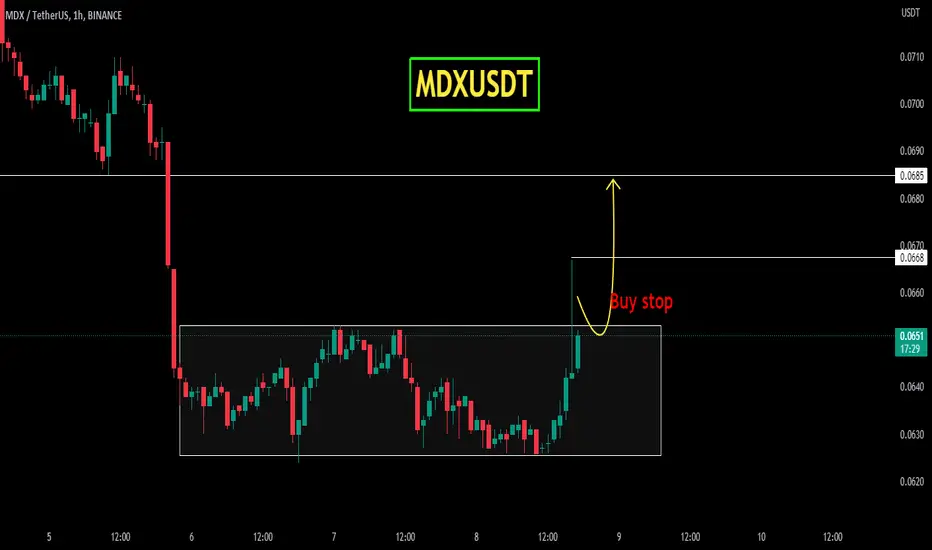
MDXUSDTMDXUSDT was trading in range from last few days, finally today it broke through the range and currently again got range bound. If it gives healthy closing out of the range at 0.655 region, it will be a nice buy setup.
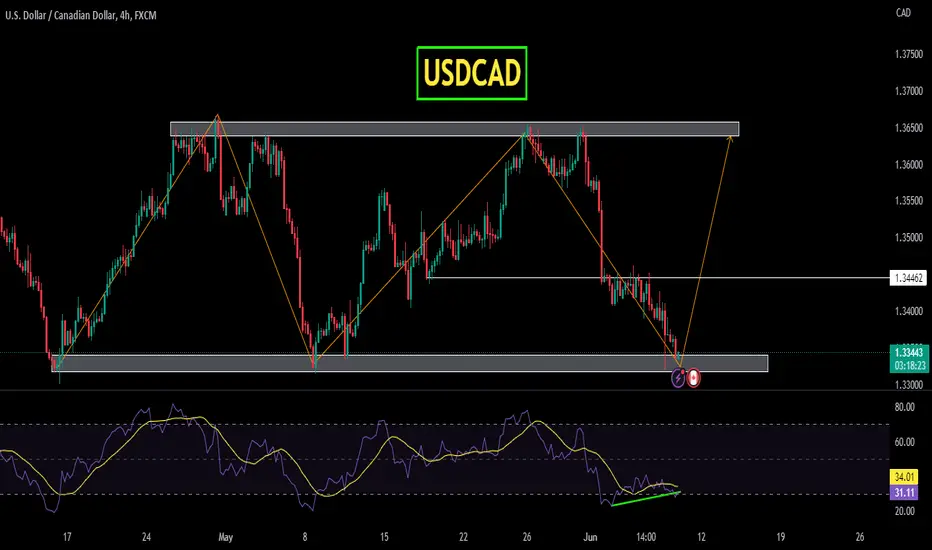
USDCADUSDCAD is range bound between 1.3320 to 1.3650 region. Sometime ranges are good option to trade just sell the top and buy the bottom. Will USDCAD play this scenario this time ?
USDCAD I Bullish CAD News but in the rangeWelcome back! Let me know your thoughts in the comments!
** USDCAD Analysis - Listen to video!
We recommend that you keep this pair on your watchlist and enter when the entry criteria of your strategy is met.
Please support this idea with a LIKE and COMMENT if you find it useful and Click "Follow" on our profile if you'd like these trade ideas delivered straight to your email in the future.
Thanks for your continued support!

1H ETH deviationETH formed a range between 1780 and 1616 on the 1H timeframe, deviated above reaching a high 1840 just to fall back in the range.
Now retesting the range high from the inside. If confirmed, target is range low.
