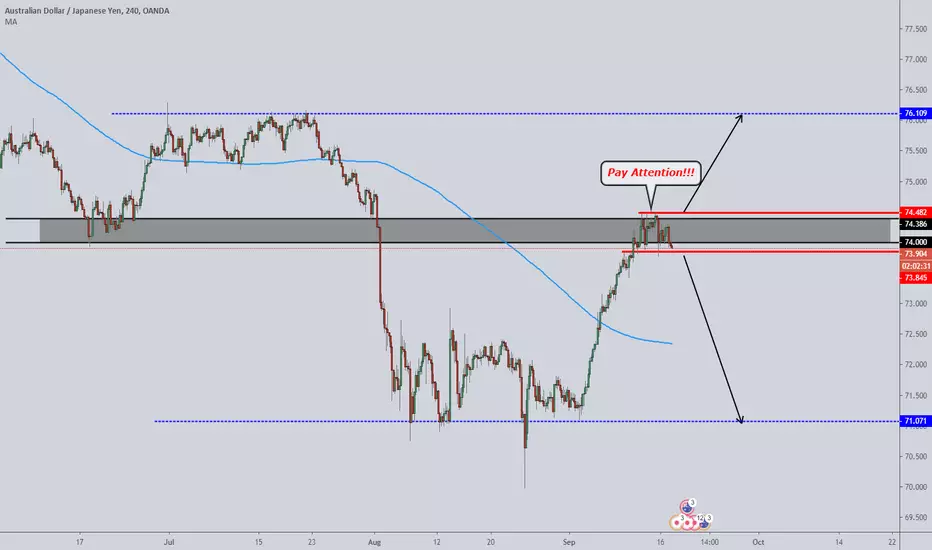
AUDJPY #Forex #ForexTrader #ForexTrading #ForexChartPay attention to the consolidation
Wherever we break could see a massive move
SL above or below the break out candle
Rangingmarket
EURUSD Price Action and Stochastic (Short Lesson)Examining the channel of EURUSD, how pin bars can be combined with stochastic, and basic ranging markets.

EURUSD - Potential Ranging MarketHi Traders!
As you can see the market was in a strong uptrend and reached the level 1.12500!
Now it made a big reversal move, so we expect the market to range between the Fib Levels.
After ranging we could have a breakout! Be prepared!
Thanks and good luck!

Possible range movement for EURJPY!The price is losing its momentum and shifting into ranging market movement. In ranging market, we can trade based on the range's support and resistance line due to its ability to hold. Currently, the price is in the area of support (red line) and I believe the support is strong enough to push the price towards the resistance area (blue line). This gives us the opportunity to make some quick profit! Trade Safely!

XAUUSD H4 Ranging between zonesWe can see Gold about to come into interaction with our 4 hour support zone. If I begin to see exhaustion I'll be looking to spot reason for long entries, carrying us up to the mid range zone for our TP 1 then to our main resistance for TP 2 wit SL placed below the zone. To further our confluences on this I'll be looking at the dollar index to see if I can spot weakness and reason for it to turn bearish!

BTC/USD Ranging waiting for a breakoutLooks to be ranging for now until it can get momentum to breakout the current wedge its in.

GBPUSD - Potential Ranging-Market?After the breakout under the trendline the market makes a hammer pattern.
Maybe the market will move until the resistance at 1.27600 and bounces back.
Or it'll start a new downtrend and bounces at the support by 1.26711.
Let's wait and see!
Thanks and good luck!

BRENT OIL price rangesOil prices have been rising since the end of December, rebounding as high as $75 (April 24) from the lows of $50.
We can see the 50 and 200-day SMAs around the same area of $69.
This area of $69-$70 can be considered as a strong support level and potential rebound point as long as there is no major news in regards to a globally slowing economy.
Neutral outlook for now, with a possible tight range of a few dollar in the next couple of weeks, mainly between $69 and $72.
Fundamentals that can have a big impact on this range and break it below or above:
The Saudis announced that they will increase their supply to Asia which is seen as a counter-measure to compensate for the Iranian market losses.
A sensible question would be if the OPEC will loosen up the production restrictions due to the oil supply issues coming from both Iran and Venezuela.
Crude Oil stock changes, USA production as well as trade deal developments should also be monitored.
To conclude, in case we see a break of the $70 level, the next point of interest would be $67 and then $65 which is the 100-day SMA.
On the upside, $75 would be a strong resistance should $72 is broken decisively.

GBPUSD Ranging MarketThe market will move tomorrow on 7th May 2019 between the Fibonacci levels 50.0% and 23.6%.
Good luck!

GBPCHF educationalHi traders,
I will show you in this analysis how to trade ranging markets before the break out.
After a long time of consolidating we will see a break ot, but how we can trade this and how we find the right setup.
First draw the triangle an the boarder lines of the range.
The border line of the range are the entry points for your stop orders, the opposite range line from your entry point is
your stop. Your target on a long trade is the next resistance and on a short trade the next support line.
So you must not watch all the time the charts.
Risk management is the key to forex.
Your Stefan Forex

GBPNZD Short GBPNZD is in a ranging market here on the 4H if it breaks below this ranging market I can see a continuation to the next support price.

Nice Ranging Trade Opportunity on USD CAD - 60PIPSThis one may carry on for a while, on its way up to support, should be an easy 60, MACD and EMA's all lining up to push this one higher...

USDCAD Buy - Double Bottom at Bottom of RangeUSDCAD has ranged within a symmetrical triangle for the past one month.
The price has rebounded off from the bottom of the symmetrical triangle and it is now hovering below the neckline.
Look for buying signal as the price pulls back from the neckline for a probable shoot up through the neckline towards the top of the symmetrical triangle.

NZDUSD Neutral Move (RANGING)NZDUSD
------------------------------------------------------------------------------------------------------------------------------
Price has been in a 3 month range and there should be hopefully a decision by buyers or sellers as to what will happen.
Last week sell-off showed strong bearish pressure within this range and a further decline should really see how NZD economy progresses overall as global economies are weakening currently.
Now a common fallacy, retail traders have is that when price retests a level with many touches, the level is weakening, this is untrue. What really is happening is, sellers are getting more sell orders in as the first time the sell-off happened, not enough orders were completed or wanting to get in more orders before moving lower.
From the 4hr channel, we see price respecting both outer boundaries and stays within the Weekly range.
One would think that a big move is imminent, keep watch and see.
I would wait at this point to see what happens next.

GBPJPY revision after the fantom newsGBPJPY revision after the fantom news
Could trade it within the range of consolidation but I'm looking for the breakout and retest on either side of the consolidation. At the moment, price action implies this will move to the downside but, we all know anything could happen. No TPs and entries at the moment but I'll likely revamp this later with an updated version.

GBPCHF short ideaHi traders,
this is my setup for GBPCHF for the next week.
I will open 3 positions with 3 different targets at the fibonacci retracements.
The price is in a ranging market at the daily timeframe.
Have a creat trading week.
Stefan Forex

D1 with Ranging scenario on short form D1 Tell me > it's ranging
H4> tell me trend line that have HH HL continue with LH LL and breakout with great support
H1> seem no good entry and have a chance to swing anyway
>> No entry for now >> need clear movement

Ranging market on short with price confirm NC to try bro :)Check it out
TP @1.365 for sure
SL : own decision

British Pound Showing IndecisionWhile bouncing back and forth the daily (white) and weekly (purple) support/resistance areas, the GBP can't decide what to do on multiple pairs causing many EMAs to go flat!

PYPL - RangingLONG PYPL @ 81.39
SL @ 78.99 (570 Pips)
TP @ 87.09 (240 Pips)
RR: 2.37, SWING Setup!
Enjoy our limited Content and Setups,
leave us a like and Comment!!

BTC Ranging MarketI'm looking for more sideways (6600 - 6200) before we can break 6910 level. At this level continuing the bounce level form 6155 support. As short-term re-test to 6367 level in case RSI break the short term support level below 40.73.
All-over I'm neutral for 3-5 days time frame. Looking for more bullish sentiment on 30th September 2018 as the announcement of Bitcoin ETF VanEck.
Stay safe,
blockchaindedi

Make Your Mind Up!Aussie has been moving like this for a while now, bouncing between 0.7440 and 0.7360 without showing any clear breakout yet. I managed to catch a short swing trade today on the 4 hourly chart but looking for some better opportunities once this range breaks.

Signal Stream - AUDCHF Long SignalJust now getting some time to sit down and make a few posts. There have been a number of excellent signals generated lately.
** Note - lines were drawn by me. The vertical lines are where the signal generated, and the horizontal lines are initial close range targets.
This pair has been ranging strongly in the past few weeks.
A long signal appeared towards the bottom of the range, one of the strongest setups for Signal Stream trades.
Initial close range target for this trade fell roughly in the middle of the trading range at 0.73513
In situations like this I tend to stay content with my initial target and close out the trade once the level is reached. Given that we're in a range, price could just as easily move back against us.
What I really mean to say by that is that I don't expect to have huge trades running in my direction forever by these types of trades.
But they really do work quite well with initial targets.
There are many ways to trade Signal Stream.
Signal Stream signals have a high chance of hitting their targets even if the market moves in the opposite direction, long after the signal appears.
It's like the market is attracted back to these levels if they don't hit it immediately.
Celebratory sale for signal stream happening now!
Get lifetime access to this subscription indicator for a one time payment of $67 USD .
This offer is good for the first 100 clients, after that it will be going to monthly subscription at a higher price.
PM me for details or learn how to purchase Signal Stream here!
