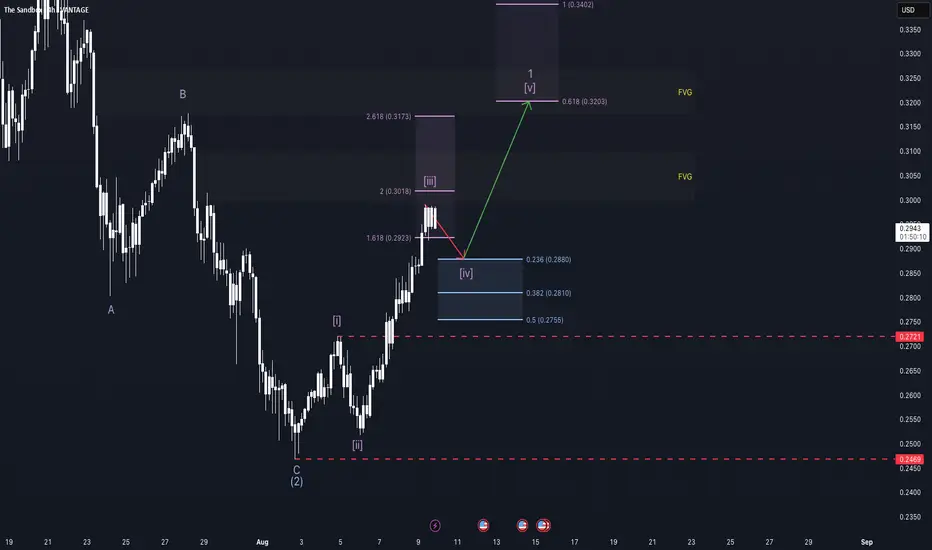
Undecided. - SAND/SAN weekly update August 9 - 15thThe Sandbox (SAND) is currently advancing within a strongly aligned Elliott Wave structure. At the Cycle degree, price is in Wave 3; at both the Primary and Intermediate degrees, it is also in Wave 3; and at the Minute degree, the market is completing a smaller Wave 3. From a Smart Money Concepts perspective, it would make sense for price to dip into the lower highlighted Fair Value Gap (FVG) before continuing higher, as this aligns with key Fibonacci retracement levels. Even a quick wick into this zone would be sufficient to rebalance price before continuation.
Following this potential retracement, the structure anticipates a short Wave 4 followed by Wave 5, which is projected to terminate in the upper FVG marked on the chart. This interpretation fits well with the overall bullish macro structure. However, if Wave 4 were to drop below the top of Wave 1, the current count would be invalidated. A move below the start of Wave 1 would raise the probability that the current advance is part of a more complex corrective structure rather than a sustained impulse.
From a derivatives perspective, funding rates remain positive while open interest is stagnating, indicating steady but not accelerating long participation. The liquidity heatmap shows significant liquidity resting below the Wave 2 low, which could act as a magnet for a short-term sweep before continuation.
On a broader level, this setup aligns with the macroeconomic backdrop. The CME FedWatch Tool currently shows a 88.9% probability of a Federal Reserve rate cut at the September FOMC meeting. Such expectations often lead to markets front-running the event, potentially fuelling impulsive Wave 3 rallies across the crypto sector. However, if bullish positioning becomes excessive, the risk of a “sell-the-news” reaction or a liquidation event increases — particularly in assets like SAND, which are already in extended third waves. Institutional positioning likely occurred earlier in the cycle, leaving retail traders to provide the momentum for the next legs up.
As long as key support levels hold and the lower FVG provides the anticipated reaction, SAND remains well-positioned for a continued advance toward the 0.320–0.340 range, with multiple wave degrees supporting the bullish case.
Ratecut
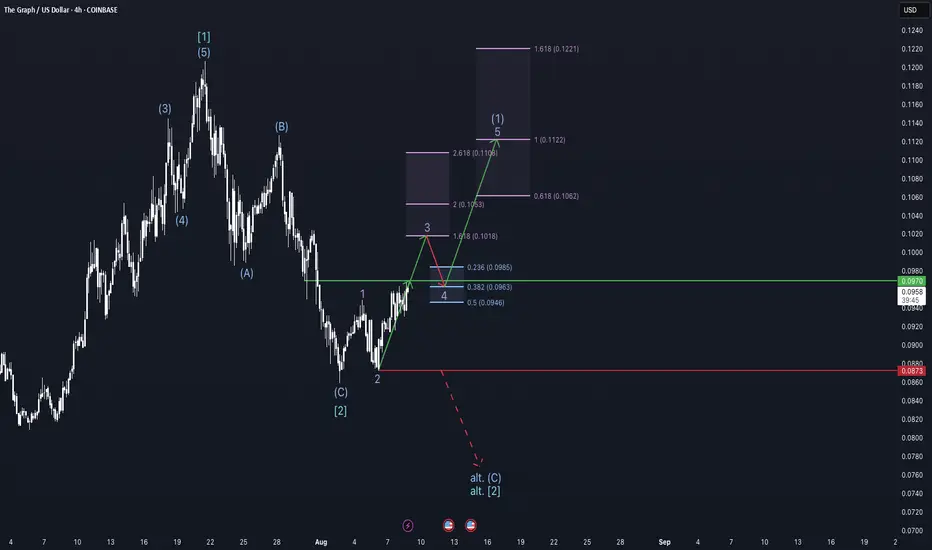
Chasing new highs - GRT weekly update August 8 - 14thThe Graph (GRT) has formed two higher-degree 1–2 setups — one at the Cycle degree and one at the Primary degree — creating a structurally bullish foundation. At the Intermediate degree, price is currently advancing in Wave 1, while at the Minor degree, it is in Wave 3, the most dynamic phase of an impulse. This alignment of early waves across degrees suggests a potentially strong continuation if key resistance levels are broken.
The immediate bullish confirmation comes from a break above the $0.097 resistance, which would open the door for a sustained rally toward the $0.106–$0.122 zone, based on Fibonacci extensions. However, there is an alternative scenario: if the market fails to clear $0.097 and sells off, breaking the $0.0873 support, it would indicate that Intermediate Wave C and therefore Primary Wave 2 are not yet complete. In that case, a final low to complete the larger correction would be expected before the uptrend resumes.
From a sentiment perspective, funding rates are positive, and open interest is rising, showing increasing long exposure. The liquidity heatmap reveals significant liquidity resting below current price, with only minor clusters above — a configuration that could invite a short-term liquidity sweep before continuation.
This setup also needs to be viewed in the context of broader macroeconomic conditions. For much of this year, capital inflows into crypto were limited by the Federal Reserve’s restrictive monetary policy. However, the CME FedWatch Tool now shows a 89.1% probability of a rate cut at the September FOMC meeting. Markets tend to front-run such events, and this expectation could fuel Wave 3 advances across the crypto sector. But with anticipation running high, there is also the risk of a sell-the-news reaction, particularly if retail traders over-leverage into the move.
It’s worth noting that this structure in GRT closely mirrors many other altcoin charts at the moment — a sign of high correlation within the crypto market.
As long as the $0.097 resistance is broken and the $0.0873 level remains intact, the probability favours the bullish scenario — with a multi-degree Wave 3 advance potentially underway, fueled by both technical structure and macro catalysts.
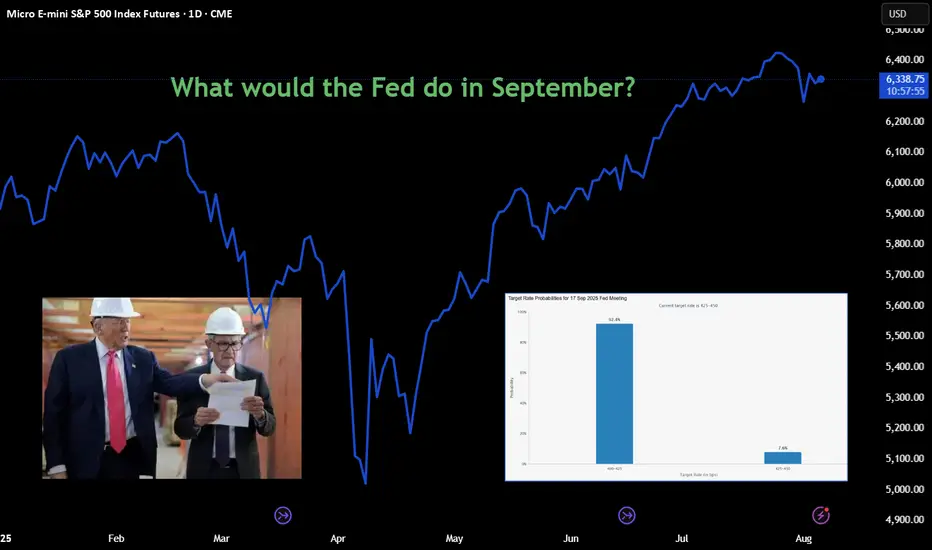
Approachable Contracts for Trading Around Fed DecisionsCME Group E-Mini S&P Options ( CME_MINI:ES1! ) and Micro S&P Futures ( CME_MINI:MES1! ), #microfutures
On July 30th, the Federal Open Market Committee (FOMC) decided to keep the Fed Funds rate unchanged at the 4.25-4.50% target range. Investors now turn their focus on whether the Fed will cut rates on the September 16th-17th FOMC meeting.
According to CME FedWatch Tool, as of August 6th, there is a 92.4% chance that the Fed will cut rates by 25 bps in September. My observation:
• Before July FOMC, market consensus was no rate cut, with the odds at 95.3% as of July 20th. Investors now overwhelmingly expect rate cuts to come at the next meeting.
• Two Fed governors broke the long-run consent and voted against the FOMC decision.
Today, I would like to explore two trading strategies focusing on the next Fed decision.
We will start by breaking down all possible Fed decisions as follows:
1) Cut rates by 25 basis points (92.4%)
2) No rate cuts (7.6%)
3) All others, such as cutting by 50 bps and raising rates by 25 bps (0%)
If we deem the 3rd option to be statistically insignificant, we now have an event with binary outcomes, namely, Cut and No Cut .
Since “Cut” is the market consensus, we will translate the possible outcomes as:
• Meet market expectations (Cut Rates)
• Exceed market expectations (No Cut)
Furthermore, financial markets will likely react calmly if the Fed decision meets expectations, while asset prices could swing widely if the FOMC exceeds expectations.
Typically, US stock market indexes, interest rate contracts and the US dollar exchange rates are very sensitive to the Fed decisions. Our discussion today will focus on stock indexes. I will follow up on the other two asset classes in future writings.
Based on the above analytical framework, we could design two sets of trading strategies:
Sell Call Options if a trader expects the Fed to cut rates
• Since the decision meets expectations, asset prices would not move a lot.
• Options may expire worthiness, which allows sellers to pocket the premium as profit.
Sell Futures if a trader expects No Cut
• Since the decision exceeds expectations, S&P prices could go down sharply.
• With build-in leverage in futures contracts, a trader could realize enhanced profit.
Now, let’s explore how to structure trading strategies using S&P futures and options.
Hypothetical Fed Decision 1: Meet Expectations
Cutting rates is bullish for S&P as it will lower borrowing costs for component companies. However, since market already priced in a Fed cut, stock prices will not move a lot.
If a trader shares this view, he could explore selling Out-of-the-Money (OTM) Call Options on CME E-Mini S&P 500 futures ( NYSE:ES ).
Each ES contract has a notional value of $50 x S&P 500 Index. On August 6th, the September ES contract (ESU5) is quoted at 6,341, making the notional value at $317,050.
• Call options at the 6500-strike are quoted at $42. By selling 1 call, options seller will receive $2,100 in upfront premium (= 42 x 50).
• Options expire on September 19th, two days after the FOMC. If ESU5 price does not exceed 6500, options seller will pocket the premium as profit.
• Warnings: selling options involves significant risks. Seller could lose more than the premium he collected. To cut losses, seller could buy back at the open market and exit the position. This will avoid losses to accumulate by expiration date.
Hypothetical Fed Decision 2: Exceed Expectations
Since rate cut is already priced in, an Unchanged decision will likely cause the S&P to fall sharply, as expected future borrowing costs will go up.
If a trader shares this view, he could explore selling CME Micro S&P 500 futures ( MSTAR:MES ).
Each MES contract has a notional value of $5 x S&P 500 Index. On August 6th, the notional value of ESU5 is $31,705. Buying or selling 1 futures contract requires an upfront margin deposit of $2,135 at the time of this writing.
Micro S&P 500 futures are 1/10 in notional comparing to its E-Mini counterpart. With smaller size and lower margin requirement, the micro contracts are more approachable for non-professional traders. At the same time, they also enjoy the leverage built-in the futures contracts. Micro S&P contracts tap into the liquidity pool with the broad S&P contract suite.
Hypothetical Trade
• Short 1MESU5 at 6,341, and set a stop loss at 6450
• Trader pays $2,135 for initial margin
A “Meet” Scenario: S&P go up 1.5% to 6,436
• Short position loss: $475 (= (6436-6341) x 5)
• The maximum loss will be $545 if the S&P moves higher, due to the stop-loss feature
An “Exceed” Scenario: S&P falls 5% to 6,024
• Short position gain: $1,585 (= (6341-6024) x 5)
• The theoretical return is 74.2% (= 1585/2135), excluding transaction fees
Happy Trading.
Disclaimers
*Trade ideas cited above are for illustration only, as an integral part of a case study to demonstrate the fundamental concepts in risk management under the market scenarios being discussed. They shall not be construed as investment recommendations or advice. Nor are they used to promote any specific products, or services.
CME Real-time Market Data help identify trading set-ups and express my market views. If you have futures in your trading portfolio, you can check out on CME Group data plans available that suit your trading needs www.tradingview.com
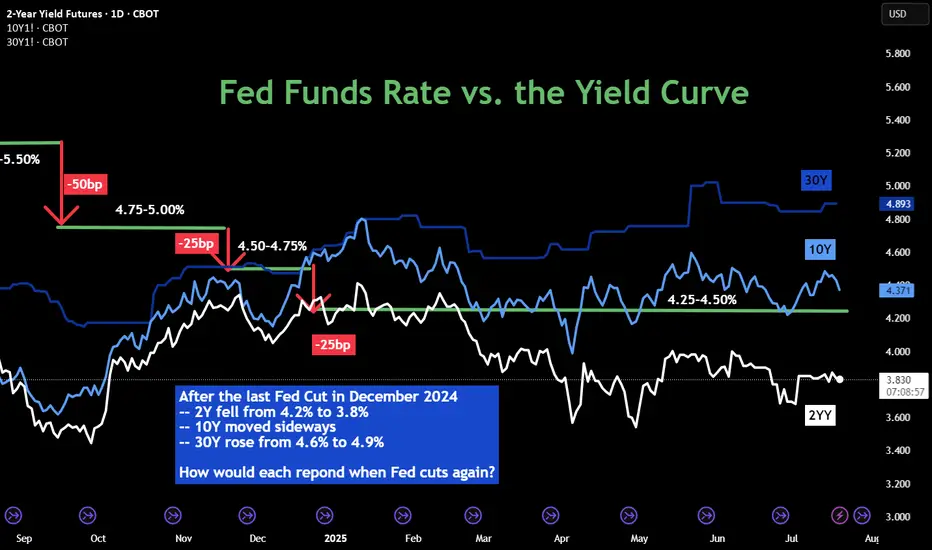
10Y: Positioning for a Falling Yield EnvironmentCBOT: Micro 10 Year Yield Futures ( CBOT_MINI:10Y1! ), #microfutures
The Federal Reserve last cut interest rates in December 2024. Since then, it has kept the rates unchanged in its January, March, April and June FOMC meetings. While the official Fed Funds rate stays at 4.25-4.50% in the past seven months, we have seen diverging trends in the interest rate market:
• 2-Year Yield has trended down from 4.25% to around 3.85%;
• 10-Year Yield mostly moved sideways, currently at 4.42%;
• 30-Year Yield rose from 4.60% to top 5.00% in May, then pulled back to 4.89%.
The futures market expects the Fed to cut rates once or twice in the remaining four FOMC meetings in 2025, according to CME Fed Watch Tool.
• As of July 20th, there is a 95.3% chance that the Fed will keep rates unchanged in its July 30th meeting;
• The odd of lowering 25 bps is approximately 60% for September 17th;
• By the last 2025 meeting on December 10th, futures market sees just 6.4% chance that the Fed keeps the rates at current level 4.25-4.50%, while the odds of 1 cut to 4.00-4.25% are 29.2%, and the odds of 2 cuts to 3.75-4.00% are 64.3%.
The Fed’s Challenges
The Fed tries to fulfil its dual mandate established by the Congress: (1) to support maximum employment and (2) to maintain price stability. Its official targets are to keep the unemployment rate below 4%, as measured by the BLS nonfarm payroll data, and to keep the inflation rate at 2%, as measured by the PCE price index. When we face an outlook of rising prices and slowing employment, the Fed will have a hard time meeting both policy goals.
Firstly, as the Trump Administration raises tariffs for all trading partners on all imports, it’s a matter of time before the inflation rate picks up again. Even if many countries may reach trade agreements with the U.S., they will still get a bigger tax bill.
• According to the Bureau of Economic Analysis (BEA), the total US imports of goods and services was $4.1 trillion for 2024.
• Imports account for 14% of the US GDP in 2024, which is $29.2 trillion (BEA data).
• Simple math suggests that a universal 10% tariff hike could contribute to 1.4% in price increases, assuming all tariffs are passed through to the retail prices.
The most recent inflation data is the June CPI at 2.7% (BLS data). The tariff hike could easily push inflation to twice the Fed policy target. Therefore, cutting rates will be a very difficult decision if inflation rebounds.
Secondly, US employment growth has slowed down significantly in 2025. On July 3rd, the BLS reported total nonfarm payroll increased by 147,000 in June, and the unemployment rate changed little at 4.1 percent. Current employment growth is less than half the level in December 2024, which saw the data above 300,000.
There are weaknesses in the payroll data. All private sectors combined accounted for about half of the employment gain, or 74,000. Government jobs, while at a much smaller base, accounted for the other half.
Tariffs raise the cost of input, while business borrowing costs remain high at current rate level. To support growth and maximum employment, cutting rates make sense.
Finally, the Fed is under tremendous pressure from the Administration. President Trump openly and repeatedly calls for a 300bp cut.
In an ideal world, the Fed wants to make monetary policy decisions free of political interference. It may not be the case. Let’s look at the Fed rate decisions during the first Trump presidential term. The current Fed Chair was appointed to the role by President Trump in February 2018.
• The Fed raised interest rates four times in 2018, for a total of 100 basis points, with the Fed Funds rate increased from 1.25-1.50% to 2.25-2.50%.
• Under pressure from the White House, the Fed cut rates three times in 2019 for a total of 75 basis points, with the Fed Funds rate ending at 1.50-1.75%.
• In 2020, in response to the Pandemic, the Fed cut rates by 150 points, all the way to a zero-rate environment (0%-0.25%).
In my opinion, the Fed will cut rates this year, similar to 2019. Once the Fed Chair retires in May 2026, his replacement, who will be nominated by President Trump, will no doubt follow his guidelines and bring the Fed Funds rate all the way down to 1%-2% level.
While there is uncertainty in the timing and pace, we are likely to embark on the path to low interest-rate environment.
Shorting Micro 10-Year Yield Futures
A trader sharing a bearish view on interest rates could explore shorting the CBOT Micro 10-Year Yield Futures ($10Y).
Last Friday, the August 10Y contract (10YQ5) was settled at 4.425. Each contract has a notional value of 1,000 index points, or a market value of $4,425. To buy or sell 1 contract, a trader is required to post an initial margin of $300. The margining requirement reflects a built-in leverage of 14.7-to-1.
Let’s use a hypothetical trade to illustrate how to use a short futures position to take advantage of a potential Fed rate cut.
Hypothetical Trade:
• Short 1 10YQ5 at 4.425, and set a stop loss at 4.60
• Trader pays $300 for initial margin
Scenario 1: Fed keeps rates unchanged on July 30th, 10Y moves sideways
• If Futures price changes little after the July FOMC, the trader could close the position
• He could short the September contract 10YU5, with an eye open for the September 17th FOMC rate decision
• This is a futures rollover strategy.
Scenario 2: Fed cuts 25 bps on July 30th, 10YU5 falls 250 points to 4.175
• Short position gains: $250 (= (4.425-4.175) x 1000)
• The hypothetical return will be 83% (= 250 / 300)
Happy Trading.
Disclaimers
*Trade ideas cited above are for illustration only, as an integral part of a case study to demonstrate the fundamental concepts in risk management under the market scenarios being discussed. They shall not be construed as investment recommendations or advice. Nor are they used to promote any specific products, or services.
CME Real-time Market Data help identify trading set-ups and express my market views. If you have futures in your trading portfolio, you can check out on CME Group data plans available that suit your trading needs www.tradingview.com
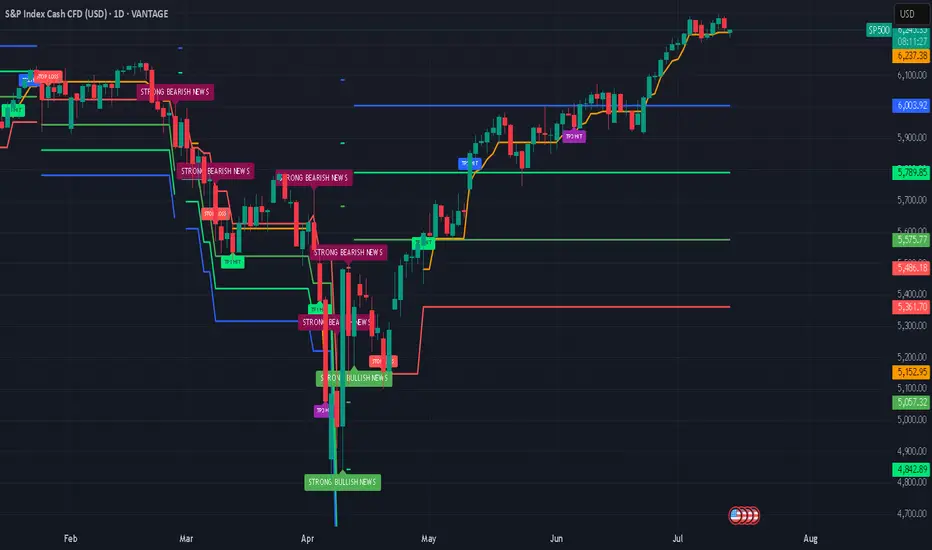
S&P 500: Defying Tariff Headwinds, Breaking RecordsThe S&P 500 has staged a remarkable rally in 2025, shattering all-time highs and capturing global attention. This surge has unfolded despite the negative economic overhang of renewed tariff threats and ongoing trade tensions, raising critical questions for investors: How did the market overcome such headwinds, and what lies ahead for both the short and long term?
The Rally Against the Odds
Tariff Turbulence: Earlier this year, President Trump announced sweeping new tariffs, sparking fears of supply chain disruptions and higher costs for American companies. Historically, such moves have triggered volatility and corrections.
Market Resilience: Despite these concerns, the S&P 500 not only recovered losses from the spring but surged to new record highs, with the index climbing over 23% since April’s lows. Major tech companies, especially those leading in AI and innovation, have been at the forefront of this advance.
Investor Sentiment: The rally has been fueled by optimism around potential Federal Reserve rate cuts, robust corporate earnings, and expectations of long-term economic growth—even as the immediate impact of tariffs remains uncertain.
Short-Term Correction: A Healthy Pause?
While the long-term outlook remains bullish, several indicators suggest the market may be due for a short-term correction:
Narrow Market Breadth: The current rally has been driven by a handful of mega-cap stocks, leaving the median S&P 500 stock well below its own 52-week high. Historically, such narrow leadership often precedes periods of consolidation or pullbacks.
Valuation Concerns: Stock valuations are at elevated levels, and some analysts warn that earnings growth could slow as companies adapt to higher input costs and shifting trade policies.
Correction Forecasts: Some strategists predict the S&P 500 could correct to around 5,250 by the third quarter of 2025, citing factors like slowing consumer spending and persistent policy uncertainty.
Long-Term Outlook: Higher Highs Ahead
Despite the potential for near-term volatility, the long-term trajectory for the S&P 500 remains positive:
Fed Policy Tailwinds: Anticipated rate cuts and lower bond yields are expected to provide further support for equities, encouraging risk-taking and higher valuations.
Corporate Adaptation: Companies are actively offsetting tariff impacts through cost savings, supply chain adjustments, and strategic pricing.
Growth Sectors: Innovation in technology, productivity gains, and deregulation are setting the stage for sustained profit growth, especially in sectors like AI, robotics, and defense.
Key Takeaways for Investors
Stay Disciplined: While a short-term correction is possible, history shows that markets often rebound strongly after periods of volatility.
Diversify Exposure: With market gains concentrated in a few names, diversification and active stock selection are more important than ever.
Focus on Fundamentals: Long-term investors should look beyond headlines and focus on companies with resilient earnings and adaptive business models.
The S&P 500’s ability to break records in the face of tariff headwinds is a testament to the underlying strength and adaptability of the U.S. economy. While short-term bumps are likely, the path ahead still points toward new highs for those with patience and perspective.
This article is for informational purposes only and does not constitute investment advice. Always consult with a financial advisor before making investment decisions.
#spx500 #stockmarket #analysis #economy #us #nasdaq #fed #bonds #rates #trading
HOW IS CRYPTO SHAPING UP?Trump and tariffs have a firm grip on the economic world as of late, so where does that leave the crypto market?
TOTAL has a clear structure since the beginning of the bull market in 2023, in the last 3 days TOTAL has wicked into the bullish trendline support but sits within a bearish trend channel. This level also coincides with the bullish orderblock that started the leg up post US election so a very strong level of support here.
Do I think this is the end and the bottom is in? The chart would make a very good case for it however I believe that the Geo-politics outweigh Technical Analysis currently, at least in the short term. Everyone is watching for the latest news release/Trump announcement and all the time that is going on the market is very reactionary with less passive orders and more reactionary news based market orders. That taken into account in the short term this is a game of musical chairs with massive volatility swings and liquidations left right and center, a traders dream.
I'm very interested in how the FED will react to this, once we start getting emergency or early interest rate cuts that for me is when BTC will take the next step up and will flip to an investor/buy and hold environment, whether that's from here, lower or higher I'm not sure but but BTC needs a risk-on environment to thrive and Trump is doing his best to force J Powells hand.

potential NASDAQ bearish reversal in the makingThe Nasdaq appears to be showing signs of a bearish reversal as technical and macroeconomic factors align against further upside. After a strong rally, the index is encountering key resistance, prompting concerns among traders about the sustainability of the recent gains.
A pinbar candlestick pattern has emerged, signaling potential downside as buyers fail to sustain momentum. Historically, such formations indicate a rejection of higher prices, often leading to further declines. Additionally, selling pressure on rallies suggests that market participants are taking profits rather than betting on continued strength.
From a momentum perspective, the Moving Average Convergence Divergence (MACD) indicator is beginning to roll over, hinting at a potential shift in trend. If this bearish momentum continues, the Nasdaq could face increased selling pressure in the coming sessions.
Beyond technicals, fundamental factors are adding to the uncertainty. The announcement of new tariffs under former President Donald Trump’s trade policies is weighing on market sentiment. Moreover, while Federal Reserve rate cuts are traditionally viewed as bullish, historical data suggests that in some cases, they coincide with economic slowdowns, leading to weaker market conditions.
Looking at key downside levels, support can be found at 18,400, where buyers might attempt to stabilize the market. A break below this level could accelerate losses toward 16,500, a critical zone where stronger buying interest may emerge.
Traders should closely monitor price action and market reactions at these levels. Confirmation of bearish signals and continued weakness in bullish sentiment could pave the way for a more extended correction. Caution is advised, with risk management strategies essential for navigating the potential downturn.

Yield Curve Inversion Watch Chart - Fed Has To Cut!If you’re worried about a recession, you should be watching the Yield Curve Inverting.
Historically, an inversion signals a recession, but with a lag.
We can see this on the chart whenever the yield curve hits 0%
This shows the 2Y yield higher than the 10Y which is a signal that the market expects slow economic growth.
To counter-act the inversion, the Fed cuts the EFFR, although they are always late.
One would think that the Fed would learn from history, and get ahead of the curve this time around.
Only time will tell.
I’m cautiously optimistic as Treasury Secretary Bessent has stated that he has a weekly meeting with Fed Chair Powell.

Nightly $SPX / $SPY Predictions for 12.19.2024🔮
⏰8:30am
Final GDP q/q
Unemployment Claims
#trading #stock #stockmarket #today #daytrading #swingtrading #charting #investing

BTC DECEMBER FOMC Going into FOMC the consensus is we'll see a 25bps cut from the FED (95% chance), this would take interest rates from 4.75% to 4.5%. Because the expectation of a cut is so certain, we can assume that the markets have priced this in so baring any craziness in the form of a different result we should see market sentiment remain the same, bullish.
A FED pause,(although unlikely according to data) would be very bearish in the the short term in terms of volatility. I would expect to see price revisit the $98-99K mark where the 4H 200EMA would roughly be. In a bullmarket the 4H 200EMA can be used as a great support level often bouncing off of it.
For a 25bps cut which is the expected outcome, we have two paths IMO. The bullish path is consolidation under the ATH then a break above, retest and off we go towards $110,000. The bearish path is a loss of this key S/R level after a consolidation above support and break under with a confirmed retest of new resistance. I know it's typical "could go up, could go down", however it's the context that matters here.
Alts have taken a back seat for the last week or so, BTC.D at a key level and a rejection off this level would mean alts can play catch-up while as BTC consolidates. We very rarely see BTC drop and altcoins pump so this is the most likely outcome to me baring no upsets in FOMC.

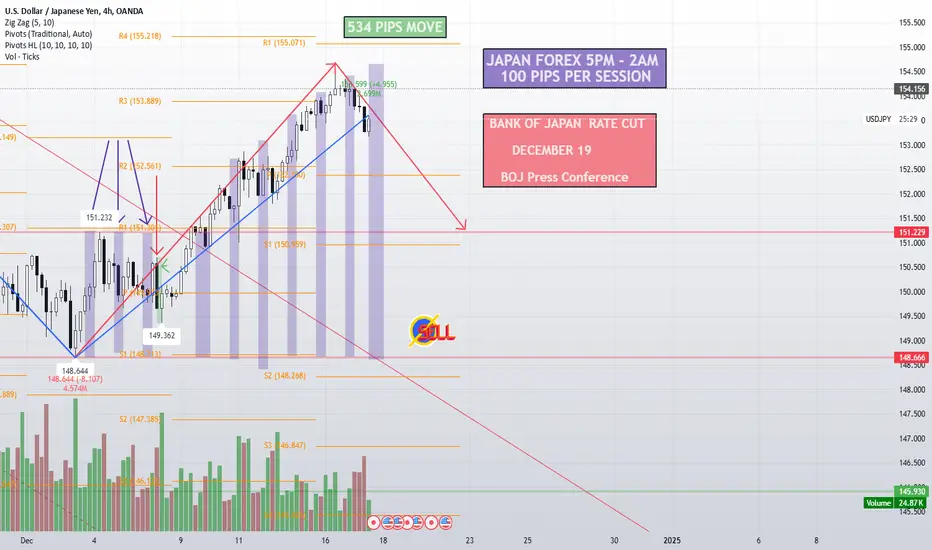
BOJ RATE BRINGS USDJPY TO 145 LONG TERM The Bank of Japan's (BoJ) upcoming interest rate decision could be a pivotal moment for the USD/JPY currency pair, potentially driving it down to the 145 level. Here's why:
Narrowing Interest Rate Differential: If the BoJ decides to raise interest rates or signals an intent to do so in the near future, this would narrow the interest rate differential with the U.S. The U.S. has been maintaining higher interest rates compared to Japan's negative or near-zero rates. A reduction in this gap would make holding Japanese Yen (JPY) relatively more attractive, thus strengthening the JPY against the USD.
Market Expectations and Sentiment: Markets often react to expectations before they react to actual news. If there's a growing consensus or speculation that the BoJ might tighten policy, traders might preemptively adjust their portfolios, leading to a stronger JPY. Recent posts on X have hinted at expectations of BoJ rate hikes, which could fuel this sentiment.
Technical Analysis Indicators: From a technical standpoint, if the BoJ surprises with hawkish comments or actions, this could trigger a sell-off in USD/JPY. The pair has been hovering around key resistance levels, and a policy shift might push it below significant support levels, potentially aiming for 145. Technical analyses often look for signs of a break below current supports, which could be catalyzed by a BoJ decision.
Global Economic Conditions: The global economic landscape, including U.S. economic data like employment figures, inflation rates, and Fed policy, will also play a role. If U.S. data suggests a softening economy or if the Fed signals rate cuts, this would weaken the USD against other currencies, including the JPY. Conversely, a dovish BoJ might not lead to as significant a drop, but the current market sentiment seems to be banking on at least some tightening from Japan.
Psychological Levels and Market Dynamics: The 145 mark could act as a psychological level for traders, where large volumes of trading might occur due to this round figure. If the BoJ's actions or statements align with market expectations of a policy shift, this could accelerate the move towards this level, especially if there's already momentum in that direction.
10-year Treasury Yield Surging ahead last FOMC in 2024After a politically charged November, bond markets have shifted their gaze back to economic fundamentals, setting the stage for a crucial Federal Reserve meeting on December 17. Recent data—including a robust jobs report and rising inflation—have reignited debates over long-term yields and the Fed’s future rate trajectory.
With the Fed’s dot plot and 2025 outlook in focus, the bond yield rallies ahead of the meeting reflects heightened anticipation of pivotal policy signals. This piece unpacks the dynamics driving Treasury yields and explores a potential trade setup deploying CME Yield futures to navigate the unfolding market environment.
MARKETS ARE FOCUSSING ON ECONOMIC DATA AGAIN
In November, U.S. Treasury yields were more influenced by political factors than by economic data. The 10-year Treasury yield remained largely unchanged after the 13/Nov CPI report, which showed headline CPI rising to 2.6% year-over-year in October, up from 2.4% in September. While the higher inflation suggested potential risks to bond yields—given that prolonged inflation could lead the Federal Reserve to slow its pace of rate cuts—Treasury yields were mostly unaffected by the data.
Instead, yields declined sharply when markets opened on November 25, following President Trump’s announcement of Scott Bessent as his pick for U.S. Treasury Secretary. Bessent, a fund manager, is anticipated to prioritize tax cuts and fiscal caution. The announcement drove the 10-year Treasury yield nearly 30 basis points lower over the next week, reaching its lowest level in over a month.
In the past two weeks, however, market focus appears to have shifted back to economic data. The non-farm payrolls report for November, released on December 6, exceeded expectations with 227,000 jobs added. Additionally, October’s dismal figure of 12,000 jobs was revised upward to 36,000, providing further support to the positive sentiment.
The improved jobs report soothed investor concerns, signalling that the state of the US economy may not be as bad as previously perceived. The jobs report eventually drove a 5-basis point recovery over the following week.
The latest CPI report for November also reaffirmed the trend that investors were focussing attention on economic data as 10Y yields surged after the report, rising nearly 19 basis points from the 09/Dec low.
10Y-2Y spreads have also surged by 8 basis points since 09/Dec. Investors can monitor the yield spreads using CME’s Treasury watch tool .
Source: CME TreasuryWatch
The tool can also be used to monitor the yield curve. Over the past month, the decline in Treasury yields has been concentrated in shorter-term tenors (2Y, 3Y, and 5Y), while the 30Y yield has remained largely unchanged. In contrast, the increase in yields over the past week has been more uniform across all tenors.
Source: CME TreasuryWatch
The November report showed inflation rising even further to 2.7%, although in-line with expectations, it suggests that inflation may be more persistent than previously perceived. This has led to expectations of a higher inflation premium for long-term treasuries which may have contributed to the rally in 10Y treasury yields.
FED DOT PLOT REMAINS THE HIGHLIGHT NEXT WEEK
Markets are almost certain of a 25-basis-point rate cut at the FOMC meeting on 17/Dec, with FedWatch indicating a 97% probability of this outcome as of 16/Dec. However, the primary focus will likely be on the Fed's guidance for the rate trajectory in the coming year. Alongside the rate decision, the Fed is expected to release its dot plot and summary of economic projections at the December meeting.
The December meeting is crucial as participants closely monitor the outlook for 2025. At last year’s December meeting, the Fed projected significant rate cuts in 2024, which triggered a substantial equity rally and a decline in bond yields.
Source: CME FedWatch
Per CME FedWatch, market participants expect an additional 50 basis points of rate cuts in 2025. However, the Fed's September dot plot indicated expectations for 100 basis points of cuts in 2025. If the December dot plot reaffirms the projection of 100 basis points, bond yields could decline sharply.
Source: Federal Reserve
BOND YIELDS HAVE RALLIED HEADING INTO THE MEETING IN THE PAST
The 10-year Treasury yields have rallied ahead of three of the last four FOMC meetings, with the increases notably concentrated in the three days leading up to the meetings. Given the recent trajectory of 10-year yields, a similar pattern may be likely this time.
The 10Y-2Y spread has shown a similar trend, increasing ahead of the last three FOMC meetings. However, following the November meeting, the 10Y-2Y spread declined. This suggests it may be prudent to position ahead of the meeting to mitigate potential post-meeting volatility.
Hypothetical Trade Setup
Market participants are nearly certain of a rate cut at the upcoming FOMC meeting, but the summary of economic projections is likely to carry greater significance. Currently, market expectations for rate cuts in 2025 are more conservative than the Fed's previous dot plot. If the Fed reaffirms expectations for more aggressive rate cuts next year, bond yields could sharply reverse their two-week rally.
While the 10-year yield outlook remains uncertain and subject to risk, the 10Y-2Y spread has a more optimistic trajectory. The spread stands to benefit from expectations of further rate cuts and its ongoing normalization trend. Additionally, historical trends suggest that positioning before the FOMC meeting may be advantageous, as the spread corrected after the last meeting.
Investors can express a view on the steepening of the 10Y-2Y yield spread using CME yield futures.
CME Yield Futures are quoted directly in yield with a 1 basis point (“bps”) change representing USD 10 in one lot of Yield Future contract. This simplifies spread calculations with a 1 bps change in spread representing profit & loss of USD 10. The individual margin requirements for 2Y and 10Y Yield futures are USD 330 and USD 320, respectively, at the time of writing. However, with CME’s 50% margin offset for the spread, the required margin drops to USD 325 as of 16/Dec, making this trade even more compelling.
The below hypothetical trade setup provides a reward to risk ratio of 1.94x:
Entry: 13.5 basis points
Target: 30 basis points
Stop Loss: 5 basis points
Profit at Target: USD 165 (16.5 basis points x USD 10)
Loss at Stop: USD 85 (8.5 basis points x USD 10)
Reward to Risk: 1.94x
MARKET DATA
CME Real-time Market Data helps identify trading set-ups and express market views better. If you have futures in your trading portfolio, you can check out on CME Group data plans available that suit your trading needs tradingview.com/cme .
DISCLAIMER
This case study is for educational purposes only and does not constitute investment recommendations or advice. Nor are they used to promote any specific products, or services.
Trading or investment ideas cited here are for illustration only, as an integral part of a case study to demonstrate the fundamental concepts in risk management or trading under the market scenarios being discussed. Please read the FULL DISCLAIMER the link to which is provided in our profile description.

Target Reached on GMETV Followers, TV has taken down and removed quite a few of my posts/videos due to my QR tag being embedded in them. I was then subsequently suspended for a few days. So, I wanted to come back and just update you on a few of those posts that were removed. GME was one of them. GME reached the W-pattern target and has entered a large liquidity block. I have decided to sell here a few days ago for some nice profit. My signal has not flashed red yet, but I wanted to capture those nice gainz while I had them.
I implemented my new indicator into my trading process in September of this year. Since that time we have not had a single loss recorded on our stock tracker! ZERO! None. All wins. Currently, we are in floating profit on all stock trades and killing it! Congrats to those who are following me in these trades.
Our average time in each stock trade is around 17 days. This is exactly where I want to be in order to give you all the time to enter the trades and exit as I post my signals.
To tell you the truth, we are doing much better than I imagined and are even beating our rate of profit on the crypto tracker! We have 12 exits for 12 wins, and the current trades will all exit in profit, equalling a 100% win rate over the last two months.
I knew I had stumbled across something remarkable when I accidentally found my indicator combo while studying the charts. I am super excited about what the future holds for all of us!
Today, I have raised the stops on all of my stock entries. I feel we may be starting to get a bit over-heated. I want to capture those profits while I have them.
Best,
Stew

XAUUSD - Gold after the FOMC?Gold is located between EMA200 and EMA50 in the 4H timeframe. Gold reached its analysis target of the previous day. In case of upward correction due to today's economic data, we can see supply zone and sell within that zone with appropriate risk reward.
The downward correction of gold has led to the visibility of the demand zone and it is possible to look for buying positions. It should be noted that both buying and selling positions will be short-term.
The Federal Reserve reduced its interest rate by 0.25%, aligning with market expectations, bringing the total rate down from 5% to 4.75%. In the Federal Open Market Committee (FOMC) statement, a line mentioning increased confidence in inflation returning to target was removed, initially prompting markets to react hawkishly. However, Fed Chair Jerome Powell quickly downplayed this change, stating that it held no special significance.
In his remarks, Powell assessed the U.S. economic outlook as positive and indicated that the Fed would continue with its contractionary monetary policies. He noted that inflationary pressures are easing and that the inflation rate is gradually nearing the 2% target. Powell emphasized the importance of reducing the risk of an economic recession and thus stressed that the Fed’s approach would remain cautious to ensure economic growth and labor market stability, with interest rates managed in a controlled manner.
During the press conference following the Fed meeting, a reporter asked Powell if he would resign if asked by Donald Trump. Powell replied simply and firmly: “No.”
Meanwhile, according to The Wall Street Journal, sources close to Trump have stated that there is still no organized plan to end the war in Ukraine, nor is there any clear idea on how to convince Vladimir Putin and Volodymyr Zelensky to agree to negotiate. One idea under discussion involves Ukraine agreeing not to join NATO for the next 20 years. In exchange, the United States would continue providing extensive military aid to Ukraine as part of a strategy to deter Russia from further aggression.

BTCUSDT.P Support prevents the price from falling
Hello, intraday traders! Hope all is well with you.
BTC on the 30-minute chart looks like it’s trying to push the price up after support held for most of the day. Tonight, we have a SEC decision about rate cuts, which will definitely impact the price. All moving averages are pointing upward, and volume is steady.
This is not financial advice—stay safe!

XAUUSD - gold waiting for the Federal Reserve meeting!Gold is below the EMA200 and EMA50 in the 4H timeframe. In case of an upward correction by the FOMC today, we can see a supply zone and sell within that zone with a suitable risk reward.
Donald Trump’s victory in the Tuesday presidential election could alter the economic outlook of the United States and influence the Federal Reserve’s policies in the coming months. Concerns about how much pressure Trump might exert on the U.S. central bank in his second term have resurfaced.
In his campaign, Trump has pledged to impose stricter tariffs on America’s trading partners, deport millions of unauthorized immigrants, and extend the tax cuts approved in 2017. If these policies are implemented, they could exert upward pressure on prices, wages, and budget deficits, creating significant challenges for the Federal Reserve.
Under these circumstances, the Federal Reserve will face increased obstacles in achieving its 2% inflation target while maintaining employment levels. Furthermore, if Trump continues his pattern of public criticism of Jerome Powell, the Fed chair, the U.S. central bank may find itself under political scrutiny.
The Federal Reserve officials have decided to lower interest rates by 25 basis points today, following a half-point reduction in September. The September forecasts indicate another quarter-point cut for December and a full one-percentage-point cut planned for 2025.
Following the rate announcement, Powell is likely to address questions in a press conference about the impact of the election on Fed policies. During Trump’s first term, he faced repeated criticism from him, and recently, Trump has criticized Powell for delays in policy decisions.

XAUUSD - Will Trump cause gold to fall?If gold reaches the bottom of the descending channel, which is also in response to the demand zone, we can look for gold buying positions.
Donald Trump won in Wisconsin and got 10 electoral votes, and Trump's total electoral votes reached 277 electoral votes. In this way, Donald Trump became the 47th president of the United States.
The rise in long-term interest rates and the broad sell-off across the Treasury yield curve reflect public expectations for an inflationary mix of domestic (fiscal and immigration) and foreign (tariffs) policies from Trump.
Also, we see movements in short-term US dollar swap rates related to the hawkish revision of Fed interest rate expectations. In line with forecasts and public expectation, markets still expect the Federal Open Market Committee (FOMC) to cut interest rates by 25 basis points to 4.75% tomorrow.

$TOTAL Crypto Market Cap Trying to Breakout - Retail IS ComingOnly thing we’re waiting for is the Crypto Total Market Cap to breakout.
Golden Cross on the horizon.
That’s why we’ve seen lack of volume in breakouts for CRYPTOCAP:BTC and Alts.
Means money is just switching from coin to coin, primarily from Tether in circulation, hence why CRYPTOCAP:USDT.D is going down.
CRYPTOCAP:TOTAL breakout will be fueled by retail, which should slowly come in the next couple weeks leading into another round of rate cuts on the 14th, followed by Donald J. Trump being declared the President of the United States the very next day 🇺🇸❤️
YOU'RE NOT BULLISH ENOUGH 🎯

Event-Driven Strategy using Bitcoin Weekly FuturesCME: Bitcoin Weekly Futures ( MIL:BFF )
On Thursday, October 10th, The Bureau of Labor Statistics (BLS) reported that the Consumer Price Index for All Urban Consumers (CPI-U) increased 0.2% on a seasonally adjusted basis, the same increase as in August and July. Over the last 12 months, the all-items index increased 2.4% before seasonal adjustment.
However, the headline CPI came in ahead of the 0.1% monthly gain and 2.3% year-over-year rate expected by analysts polled by Dow Jones. As a result, both the US equity markets and cryptocurrencies slipped on Thursday.
While the year-over-year headline CPI is the lowest since February 2021, digging into the category data reveals sticky inflation. Noticeable data includes:
• Food: +2.3% YoY. However, Eggs jumped 39.6%, while “nonconcentrated juices + soft drinks” category was up 15.3%.
• Motor vehicle insurance: +16.3% YoY
• Video discs + other media: +11.6% YoY
• Admission to sporting events: +10.3% YoY
• Health insurance: +7.5% YoY
High prices affect day-to-day life and contradict the notion of low inflation. The fact is that prices have gone up a lot in the past few years. Even though they rise more slowly now, the absolute price levels remain high. Examples from my personal experiences:
• The $9 price tag for 1-1/2 dozen eggs caused me to reduce purchase to 1-dozon for $5. I still remember the good old days of 99-cent per dozen large eggs.
• I watched a WNBC match featuring Indianapolis Fever and Catlin Clark in the summer. A seat close by the basketball court costs $200. Adding up hotel stay, fuel cost and a $50 T-shirt, this felt like a vacation budget.
• A recent doctor’s visit required copayment of $100. Six months ago, the same clinic charged $75. This is a 33.3% increase.
Event to Watch: The Next Fed Rate Decision
Retrospectively, it appears that the Federal Reserve acted a bit too aggressively with the supersized 50-bp rate cut in September. With the sticky inflation data, the Fed’s next move on November 7th is uncertain.
According to CME Group’s FedWatch Tool, as of October 11th, the futures market expects the Fed to cut 25 basis points at the next FOMC meeting, with an 88.4% probability. Gone are the odds of another supersized cut. Meanwhile, the probability of a no-cut increases to 11.6%.
www.cmegroup.com
Driven by the lowered expectation on Fed rate cuts, on Thursday, the Dow Jones Industrial Average closed down 0.14% to 42,454, and the S&P 500 slipped 0.21% to settle at 5,780. Meanwhile, the Nasdaq composite shaved up 10 points (-0.05%) and closed at 18,282.
The cryptocurrency market has a more pronounced reaction. Bitcoin gave up the psychologically important $60K level, lost $1,442 (or -2.36%) and settled at $59,564. Meanwhile, ETHER gave up $57.2 (or -2.38%) and closed at $2,356.
However, market sentiments are still very bullish. By Friday, strong Q3 earnings reported by JPMorgan and Well Fargo helped push the stock market up again, with the S&P 500 breaking 5,800 and making its 45th all-time high in 2024.
In my opinion, Bitcoin futures would be a good instrument for event-driven trades on the Fed rate decisions, given its higher volatility.
Introducing Bitcoin Friday Futures
Bitcoin Friday futures ( MIL:BFF ) are weekly, USD-settled contracts that offer a more precise way to gain bitcoin exposure and manage risk relating to such exposure. Each contract represents 1/50 of a bitcoin, ensuring capital efficiency and accessibility. The contract size of BFF is 1/5 of that of Micro Bitcoin Futures ( NYSE:MBC ), which is 1/10 of a Bitcoin.
These shorter-dated contracts expire and settle to the CME CF Bitcoin Reference Rate New York Variant (BRRNY) every Friday at 4:00 p.m. New York time and may track the spot price of bitcoin more closely.
Futures contracts traditionally expire on a monthly or quarterly basis, such as BTC and MBT, whereas BFF will settle weekly every Friday. Because of this shorter duration, BFF will have a shorter cost of carry resulting in a price that may more closely track bitcoin’s spot price.
Bitcoin futures price = bitcoin spot price + financing costs to carry the position to expiration
Two consecutive Fridays will be listed at any time. A new BFF contract will be listed every Thursday at 6:00 p.m. New York time such that market participants will be able to trade the nearest Friday plus the next two Fridays giving traders the choice to hold or not hold exposure over the weekend depending on their preference.
Trade Setup using BFF for the FOMC Event
The Federal Open Market Committee will release its next rate decision at 2:00 PM Eastern Time on Thursday, November 7th.
The BFF contract expiring Friday, November 8th will begin trading at 6:00 PM Eastern Time on Thursday, October 24th.
A trade could be set up on or after October 24th, and closed by November 7th or 8th, after the market reacts to the Fed decision and before contract expiration.
While the market overwhelmingly expects the Fed to cut 25 bps, new data could change the expectations dramatically in the next four weeks. The most important data points are:
• BLS Nonfarmed Payroll and Unemployment, November 1st
• US Presidential Election, November 5th
Separately, the next BLS CPI release will be on November 13th, after the BFF November 8th contract. We could use the BFF November 15th contract to trade on that event.
As an educational writeup, I do not offer a personal view on the future direction of BFF prices. With basic information provided here, traders could apply their own view to set up a trade on BFF.
Generally, if the Fed cuts rates in December, stocks and cryptocurrencies could get a lifting as lower rates reduce the cost of capital. Meanwhile, if the Fed pauses and decides on no-cuts, the uncertainty on interest rate trajectory could cause risk capital to fall.
Happy Trading.
Disclaimers
*Trade ideas cited above are for illustration only, as an integral part of a case study to demonstrate the fundamental concepts in risk management under the market scenarios being discussed. They shall not be construed as investment recommendations or advice. Nor are they used to promote any specific products, or services.
CME Real-time Market Data help identify trading set-ups and express my market views. If you have futures in your trading portfolio, you can check out on CME Group data plans available that suit your trading needs www.tradingview.com

CNH: Chinese Currency Could Return to the 6.3-6.9 LevelCME: USD/Offshore RMB Futures ( CME:CNH1! )
Last week, I discussed how China’s huge stimulus package, coupled with the Fed’s supersized rate cut, could improve global energy demand and lift crude oil higher.
As soon as the stimulus was announced, China’s stock market staged a huge rally. The Shanghai Stock Exchange (SSE) index moved from below 2,800 on September 24th to close at 3,336.5 on September 30th, up 19% in a week. One-month return for the SSE and notable Chinese stocks are listed here:
• SSE: +17.5%
• Yonghui Supermarkets: +59.9%
• JD: +51.3%
• BABA: +32.5%
• BIDU: +25.5%
China's stock market is closed on October 1st-7th for observation of the National Day holiday. Would the China rally continue when the market resumes trading on Tuesday?
Goldman Sachs just released a research note, saying: Unless China does QE now, the current market rally will crash and burn, and the economy will be a crater. If China does do QE, oil will soar, and gold and bitcoin will be orders of magnitude higher.
While this is presented as two alternative paths, there is only one way to go, in all practical purpose. After going all out last month with unprecedented fiscal stimulus, the Chinese government could not afford to see the stock market and the housing market to tank again. It really needs to finish the job by injecting fiscal stimulus into the economy. Now that the market sensation has already turned positive, government spending would trigger consumer spending as well as investment from the private sector. Such a multiplier effect could lift the Chinese economy higher.
Everything looks bright, with one small problem: China-listed stocks are off-limited to most foreign investors due to financial regulations and the foreign currency control regime.
China’s currency could strengthen as its economy recovers
I hold the view that the China’s currency could appreciate as its economy improves. Outside of China, investors could invest in USD/RMB futures to hitch the economic hike.
To start the discussion, let’s first make some clarification to the confusing terms in the FX market. The USD/RMB exchange rate is quoted as the number of RMB per dollar. The current USD/RMB rate is 7.09, meaning each dollar could exchange for 7.09 RMB.
When the RMB appreciates against the dollar, the price quote would get lower, not higher. For example, the rate 6.50 means you now need 6.50 RMB to get one USD dollar. In RMB terms, this is 0.59 Yuan less than the current USD/RMB rate 7.09. In this scenario, the RMB gains value relative to the dollar.
While the RMB appreciation equates to the dollar depreciation, in charts, the lines representing USD/RMB and the dollar index should move in the same direction.
• For dollar index, the line moving up means dollar gaining value.
• For the USD/RMB, the line moving up means the dollar appreciating against the RMB.
• These two things usually occur at the same time.
In 2023, as China’s economy did not rebound after the end of the pandemic closedown, the RMB depreciated more than 10% against the dollar, sending the rate from 6.69 to 7.37.
In 2024, the two lines diverged due to different economic forces.
• Dollar index moves down with the market expectation of the Fed cutting rates, reducing the interest earned from holding dollar asset.
• The USD/RMB quote moves up because of the slowdown in China’s economy.
In my opinion, the two lines will converge again, both moving down in Q4. Dollar index will get lower as the Fed continues rate cuts. The USD/RMB quote will also go lower, as improvement in China’s economy would strengthen the country’s currency.
For someone with a bullish view of RMB, he could establish a short position in CME USD/Offshore RMB Futures ( NYSE:CNH ). Remember, shorting means the expectation of the quote to go lower, which actually means RMB appreciating against the dollar.
The contract has a notional value of $100,000. At Friday closing price of 7.061, each December contract (CNHZ4) is worth RMB 706,100. CME Group requires an initial margin of RMB 14,000 for each CNH contract, long or short, at the time of writing.
Hypothetically, if CNH bounced back to 6.70, its previous high in January 2023, the quote difference of 361 pips (=7061-6700) would produce a gain of RMB 36,100 (=0.361x100,000) for a short position.
The risk of shorting the CNH is that the Chinese government did not follow through with a fiscal stimulus, and the market rally is short lived.
Happy Trading.
Disclaimers
*Trade ideas cited above are for illustration only, as an integral part of a case study to demonstrate the fundamental concepts in risk management under the market scenarios being discussed. They shall not be construed as investment recommendations or advice. Nor are they used to promote any specific products, or services.
CME Real-time Market Data help identify trading set-ups and express my market views. If you have futures in your trading portfolio, you can check out on CME Group data plans available that suit your trading needs www.tradingview.com

Interest Rate Strategies: Trade Smarter with Fed Rate DecisionsInterest Rate Strategies: Trade Smarter with Fed Rate Decisions
Trading interest rates may seem straightforward at first: buy when cuts end and sell when they fall. However, this approach often defies expectations, as determining when rate cuts truly end isn't as simple as pointing to a rate pause following a cut. While today’s Federal Reserve rate decisions are made during scheduled (and unscheduled emergency) Federal Open Market Committee (FOMC) meetings, this wasn’t always the case. Before the 1990s, the Fed often made changes outside of meetings. The shift to exclusively deciding rates during FOMC meetings was implemented to provide greater transparency and predictability for markets.
Topics Covered:
How Are Interest Rates Traded?
Three Interest Rate Trading Strategies.
Key Insights from Backtesting Interest Rate Trading Strategies.
Interest Rate Trading Indicator (Backtest For Yourself).
█ How Are Interest Rates Traded?
This strategy focuses on trading around Federal Reserve interest rate decisions, including hikes (increases), cuts (decreases), and pauses. These decisions are believed by many to have both short- and long-term effects on the market.
Key Strategy Concepts Backtested:
Buy on Rate Pauses or Increases: Go long (buy) when the Fed pauses or raises interest rates, typically signaling market stability or optimism.
Sell on Rate Decreases: Go short (sell) or close longs when the Fed cuts rates, often indicating economic concerns or slowing growth.
Buy on Specific Rate Decreases: Enter trades when the Fed implements specific rate cuts, such as 50 basis points (bps) which represents 0.5%, and analyze market reactions over different time horizons.
█ Strategy: Long during Pauses and Increases, Short during Decreases
This section examines the effectiveness of going long on rate pauses or increases and shorting during decreases. This strategy performed well between 2001 and 2009, but underperformed after 2009 and before 2001 compared to holding positions. The main challenge is the unpredictability of future rate changes. If you could foresee rate trends over two years, decision-making would be easier, but that’s rarely the case, making this strategy less reliable in certain periods.
2001-2009
Trade Result: 67.02%
Holding Result: -31.19%
2019-2021
Trade Result: 19.28%
Holding Result: 25.22%
1971-Present
Trade Result: 444.13%
Holding Result: 5694.12%
█ Strategy: Long 50bps Rate Cuts
This section evaluates trading around 50 basis point (bps) rate cuts, which is a 0.5% decrease. Large cuts usually respond to economic stress, and market reactions can vary. While these cuts signal aggressive economic stimulation by the Fed, short-term responses are often unpredictable. The strategy tends to perform better over longer timeframes, as markets absorb the effects.
1971-Present
Trade Duration: 10 trading days — Average Return: -0.19%
Trade Duration: 50 trading days — Average Return: 2.41%
Trade Duration: 100 trading days — Average Return: 2.46%
Trade Duration: 250 trading days — Average Return: 11.4%
2001-Present
Trade Duration: 10 trading days — Average Return: -2.12%
Trade Duration: 50 trading days — Average Return: -1.84%
Trade Duration: 100 trading days — Average Return: -3.72%
Trade Duration: 250 trading days — Average Return: 1.72%
2009-Present
Trade Duration: 10 trading days — Average Return: -15.79%
Trade Duration: 50 trading days — Average Return: -6.11%
Trade Duration: 100 trading days — Average Return: 7.07%
Trade Duration: 250 trading days — Average Return: 29.92%
█ Strategy: Long Any Rate Cuts
This section reviews the performance of buying after any rate cut, not just large ones. Rate cuts usually signal economic easing and often improve market conditions in the long run. However, the size of the cut and its context greatly influence how the market reacts over different timeframes.
1971-Present
Trade Duration: 10 trading days — Average Return: 0.33%
Trade Duration: 50 trading days — Average Return: 2.65%
Trade Duration: 100 trading days — Average Return: 4.38%
Trade Duration: 250 trading days — Average Return: 8.4%
2001-Present
Trade Duration: 10 trading days — Average Return: -1.12%
Trade Duration: 50 trading days — Average Return: -0.69%
Trade Duration: 100 trading days — Average Return: -1.59%
Trade Duration: 250 trading days — Average Return: 0.22%
2009-Present
Trade Duration: 10 trading days — Average Return: -3.38%
Trade Duration: 50 trading days — Average Return: 3.26%
Trade Duration: 100 trading days — Average Return: 12.55%
Trade Duration: 250 trading days — Average Return: 12.54%
█ Key Insights from Backtesting Interest Rate Trading Strategies
The first assumption I wanted to test was whether you should sell when rate cuts begin and buy when they end. The results were inconclusive, mainly due to the difficulty of predicting when rate cuts will stop. A rate pause might suggest cuts are over, but that’s often not the case, as shown below.
One key finding is that the best time to be fully invested is when rates fall below 1.25% or 1.00%, as this has historically led to stronger market performance. But this can be subject to change.
█ Interest Rate Trading Indicator (Backtest For Yourself)
Indicator Used For Backtesting (select chart below to open):
The 'Interest Rate Trading (Manually Added Rate Decisions) ' indicator analyzes U.S. interest rate decisions to determine trade entries and exits based on user-defined criteria, such as rate increases, decreases, pauses, aggressive changes, and more. It visually marks key decision dates, including both rate changes and pauses, offering valuable insights for trading based on interest rate trends. Historical time periods are highlighted for additional context. The indicator also allows users to compare the performance of an interest rate trading strategy versus a holding strategy.

$BTC Going For It! $65k Next UpJust as expected Bitcoin is being rejected from the 200MA.
Bulls still appear to be in control, so we should test the .618 Fib ~$65k.
The real line in the sand is breaking through the trendline ~$68k.
IF we close above that, the bulla will be in full swing!
I'm still keeping 10% cash on the sidelines regardless for one last generational buy opp, although those days are looking numbered.
There's still a lot of macro conditions that are concerning, hence the Fed 50 bps rate cut.

Lower Rates Expected by 9/27/24Ahead of the Fed meeting Wednesday the market was pretty much 50/50 split on whether the fed funds rate would be cut by 25 or 50 basis points. After the 50bps announcement the counter intuitive move occurred, which was rates began rising, but this should have been a surprise. This was as straight forward "buy the rumor, sell the news" gets. Today however it appears the rates attempted to rally past 3.76% but failed.
3.76% happens to be the 50% fib level from the recent highs to lows and now we'll look to see the 10-yr break below 3.70 for a sustained move lower. Marking this as a "Long Investment Idea" since lower rates imply higher bond prices, don't be fooled by the rate chart.
