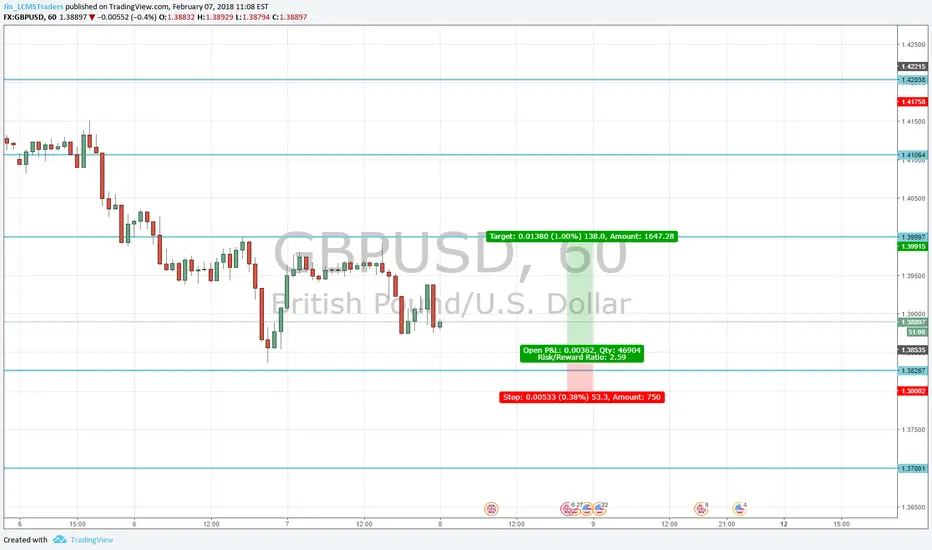
BoE rate decisionIn the evening, we await the BoE rate decision. Again, rates will likely remain unchanged, with little to no dissent in the decision. I’ll be focusing more on the Inflation Report, identifying signals on whether inflation would be sustainable at the 2% target, with a stronger GBPUSD > $1.35
Rates
RBNZ rate decision 2Early morning, we have RBNZ rate decision. While the decision to maintain rates is expected, a neutral statement is anticipated to accompany the decision. Looking for another quick jump in the NZDUSD, followed by a reversal throughout the day.

RBNZ rate decision 1Early morning, we have RBNZ rate decision. While the decision to maintain rates is expected, a neutral statement is anticipated to accompany the decision. Looking for another quick jump in the NZDUSD, followed by a reversal throughout the day.

RBA DecisionI’ll still be cautious towards trading on sustained USD strength, especially seeing today’s price retracement.
Take note of AUD retail and rate decision tomorrow. The AUDUSD came off the 0.8110 high, bouncing off 0.7900. While I do not expect any rate change, it’ll be important to pay attention to the RBA’s rate statement, and on their expectation and actions to deal with the appreciating AUD. This could give us a good hint on future movements of the AUDUSD.

Analysis: last 20 years of fundamentalsI've been studying the markets since 2006. I always loved to collect data and trying to find patterns, fluxes, correlation, decorrelation, shifts in models...
Well, with some of the data I found available at TV, this is a quick analysis for the last 20 years (almost).
1) Notice interest rates, price of gold and commodities are NOT CORRELATED at all, there is no correlation and is based on empirical data. So everytime you hear/read anybody repeating this FALLACY, respond accordingly. Actually, one could easily say that RATE HIKES use to cause rise in commodities as clearly visible in 1-2 and since 5.
Also notice that until 3rd mark, monetary base was rising constantly but at a reasonable pace.
2) Rates starting to be lowered in reaction to the increasing delinquency in the housing market. Commodities rise.
Monetary base, steady growth but contained.
3) Rates to lowest values in history, markets going down, risk OFF scenario, commodities tanking, later to rise on monetary base skyrocketing (QE1).
4) QE2 halted, commodities started ranging.
5) QE3 printing started, commodities and gold DECREASING. What happened? Where has all that money gone? Rate stood negative (adjusting by inflation)
6) After rumors, the new price fix magically started a new trend for gold, commodities and apparently forced FED to start increasing rates to avoid inflation to rise (egg vs chicken, who's first?).
Apparently Shanghai Gold Exchange new benchmark denominated in yuan made it harder to manipulate gold and commodities prices overall. USA is now limited in abusive money printing and some variables start to adjust and normalize.
Questions:
Which data do you think brings some answers to question No 5 about where might have all that money gone to during the shift?
What could happen to stock and bonds markets once rates rise resulting in an inverted yield curve?
Where is gold price more likely to head after these variables adjust?
Could we be entering a new high commodity prices cycle? How much could it last?
What would happen to inflation?
What about the world's benchmark currency (USD)?


10 Year Treasury rates to break resistance or one more dip firstThe 10 year appears to want to either break above the resistance or take on more small trip down to the e wave on this a,b,c,d,e triangle. If it hits the lower triangle boundary and then bounces, then probability is greater that it will then break the upper resistance. So if you are looking to lock a rate, or float watch both triangle boundaries to see what happens. If it breaks lower boundary, then rates could drop so you can float if the rate drifts down into the lower boundary as long as it does not break the upper boundary first.
Not intended as investment advice. This is an opinion only. Make of it what you will after doing your own analysis first.

Interest Rates Look Bullish: TBF is the ETF to BuyOn December 20th I posted an idea for a long position in AMEX:TBF based on the likelihood of the asset breaking out of its long-term downtrend and short-term wedge pattern. Here is the link to the original idea:
Today this breakout is taking place and I am initiating a long position in TBF. Given the technical backdrop and the fundamental/economic drivers, I believe this represents a solid opportunity for alpha generation.
Initial Target Price: $25.00
Stop Loss: $21.49

gbpusd setuplets see if this double top hold at 1.33790 if so we can expect a fall to 1.33354 minimum to possibly 1.32950
today is interest rates so market will be extremely volatile so anything can happen


AUDUSD buy trade succesful, next: rate decisionHi guy's, in this week's video I mentioned the continuation higher in AUDUSD to fulfill at least the minimum requirements. This has been done and our original buy's have been succesful. Next the rate decision is on the agenda.
In my video I also explained the difference between a continuation and an extension. The daily time frame does not show one unique wave to be over. This means; 'IF price moves lower as a result of the rate decision it is an extension lower on daily time frame and not a continuation'.
Safe trades!

30 Year, 2 Year Spread Making New LowsThe spread between the 30 year US treasury bond and the 2 year bill has made new lows as the yield curve in the US continues to flatten. Anticipate a pullback at some point, but the curve will likely continue to flatten as investors price in a rate hike despite dovish comments from Bullard at the Fed.
This pullback will be confirmed by a green triangle on the Kovach Reversal Indicator. If you're interested in using this indicator, check out quantguy.net.

USD EOY Rate Rumours - "Buy the Rumour"We expect USD to strengthen till end of this year. Instructions on map. This bull will not last for too long, catch it while you can! Our limited target on chart. Once our target hit we are looking for shorting it (Q1 '18).
Stay safe.
Ps: Will add to #Gold longs soon ;)


NZDUSD Ready to RunThe NZDUSD has held the previous structure area of 0.72-0.722. Also, the retest of a broken down trendline from 9/2016. A bullish engulfing candlestick was formed on 8/16/17 confirming bullish momentum, then with a broken counter trendline, 8/21 ema crossover and then recently a 4 hour bullish engulfing pattern. Price is likely to break out from here reaching the previous highs of 0.756 and then eventually 0.77. I am long at 0.73250 with a stop at 0.72980. If we reach our first target we will be getting roughly 9 to 1 risk/reward.

CZK is closed to price area where CNB started intervation 2013This is interesting how CNB by intervention did job. The price is back but rates was rised today by CNB after long time.
It means CNB gave curency back to market. Is the question if they will keep price 26 or not.

Is this it I am waiting for long time? I think YESSo big focus on this market right now. There are some reasons why Euro goes higher actually, but this is not forever. I see this like strong political thing. The fact is ECB will end QE by the time and rising rates may earlier. Meanwhile Trump will fight for his reforms. I am really curious what will hapend. Does Mario Draghi know more?

SELL EURAUD into NZD Rate DecisionOverall, I think we're seeing a strong move in metals, but waiting for NZD/AUD to follow. Also, the USDOLLAR is selling off strongly confirming this. From a technical standpoint we're at a major trendline, a major resistance area of 1.42 and also we have a few small harmonic patterns that have completed or are completing pointing to down movement. Finally, the retail crowd is heavy long the AUD. I am short at 1.407 stop loss at 1.41250. Targets 1.388 then down to the 1.37 area and possibly further. At least offers a 3.5 to 1 RR.

SELL USDCHFUSDCHF broke the major area of 0.995 as well as the 200 ema. Also, seeing many break outs across the board of USD selling. The next area of support will be the fib areas of 0.964-0.967. Then onto around 0.95. Selling at 0.993 and a stop loss above 1.002. This trade offers at east 3.5 to 1.

INTERMARKET | US05Y vs GC1!As real rates rise, the probability of gold having topped increases significantly


Reversals are always stronger than continuations 5 week uptrend broken when RBNZ announced they would keep interest rate the same.
This was followed by bad news and the RBNZ officials saying they want a weaker kiwi.
Could drop more so keep eyes open !
- Happy Trading !

EURUSD: 1.0666 should be resistanceWe can aim to rejoin the long term decline in the Euro here, and for the next 5 days, shorting gradually each day until we have a full position. Risk a rally to 1.0979 and aim for targets below $1. The 'Time at mode' signal in the 2-month timeframe points to a massive decline, so, be patient.
Risk 1-3% between all positions, if the stop is hit at 1.0979.
Good luck,
Ivan Labrie.
