"Something will break!" and something did break and is breaking!Traders,
In light of the recent Silvergate and Silicon Valley Bank crashes and the Fed following this up with a guarantee to depositors, its spells inflation on. This gives us a big clue to how the market will respond and continues to support my thesis of a blow-off top in the next few months. Let's take a look as to how we should handle this information.
Stew
Rates

An incredible interest rate repricing - what comes next?We've seen the fallout from higher for longer and a deeply inverted yield curve - with the failing of SVB Financial and Signature Bank in the US.
The market has punished financials feeling we could see far more conservatives lending and tighter regulations - interest rate hikes have come out of the markets, resulting in some of the biggest moves in US Treasury yields in living memory. FX volatility has increased but is not extreme and the USD has been offered - but have the moves gone too far?
With US CPI in play, we look at the cross asset setups and assess the flows and trades front of mind.

USD/JPY - I Tried before Fed MeetingOANDA:USDJPY
Tried for a scalp to the short side ahead of Fed Meeting, didn't work out, stopped put at +1pip
Now I can wait in line and buy some fancy coffee.
Trade management is key.
Trade smart
Trade well

So... Recession Confirmed?
With oil breaking bullish support, it's safe to say that demand has been cratering around the world. As Jeff Snider has discussed for months now, if the supply constraints on oil aren't driving oil higher, then there must be a serious demand problem. Overheated economy? I think not.
Add to that Gold up and Yields down and that means low growth + low inflation. Also not good.
So what's the trade?
Well, I think we might be at the start of what Alex Gurevich has called the mother of all bull markets in bonds. Some of these options on bonds could pay out 10x to 20x (i.e., eurodollar futures, SHY, TLT, etc).
Interesting times to live in.

Japanese have been selling bonds, have Yields peaked for now?One of the reasons US Treasuries, and other bonds, have been selling off is the dumping by Japanese investors.
All duration #YIELDS have done well but more so the shorter term. The Inverted Yield Curve has widened over the last few months but has been significantly lately.
However, today we see the 1 & 10Yr ($TNX) selling off but the 2 Yr is CRATERING! Interesting.
Also interesting is that volume has been waning for investment grade and high yield bonds. Liquidity could be an issue later on if this continues.

EUR/USD - The Powell "POP"OANDA:EURUSD
It's obvious on most assets today, the "Powell POP..." strikes again.
Trade well
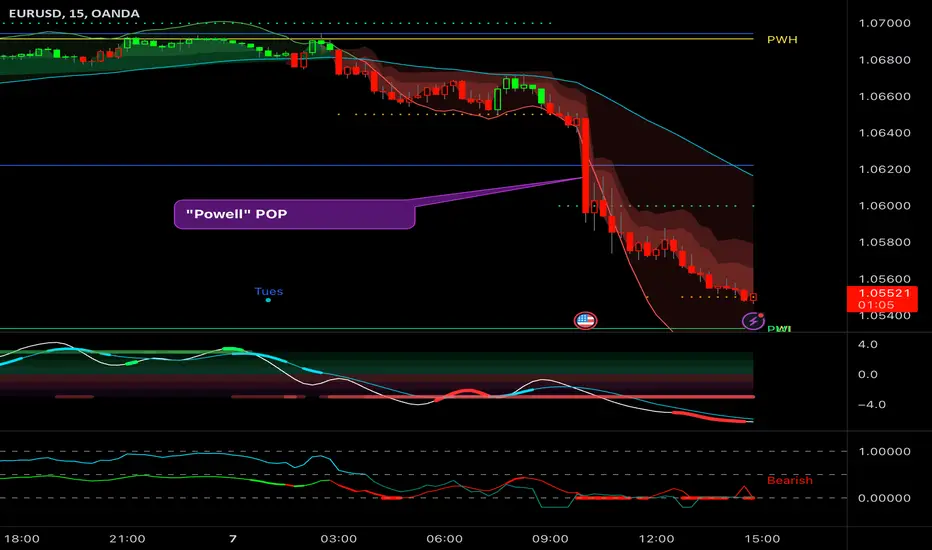
EURUSD to 1.14 (this week might give us new entry) Powell came out Hawkish today saying interest rates are ‘likely to be higher’ than previously anticipated
At the same time the CME FedWatch Tool is now being pricing a 0.50% hike as the most probable scenario (we will know in 14 days from today).
Such news would normally make one go Long on USD and that could be the case for a little while but we need to remember:
LET THE NUMBER DO THE TALKING (and the Trading):
We need to await for the data to come out as the data will dictate what the Feds do and how the Dollar and the euro (as well as the markets) will react.
Let's take a look together at what to expect and what to be aware of:
🎖3 Live Trading Sessions (Reports) we can't miss:
🎫Friday March 10th - NFP Employment data
Employment is good, Feds can hike easier.
My expectation : after such Huge previous reports I expect a lower new Jobs (NFP) number. I will analyze the numbers in detail closer to Friday but my 'hunch' is already becoming sentiment. I would be very surprised to see another explosive NFP number.
The last 10 months the results have been in the 'deep green' with the most recent one being over 500k
🎫Tuesday March 14th - CPI Inflation Report
The last inflation report came out spooky as it showed inflation didn't drop enough/much.
My concern was energy prices, as both Oil and Gas were attempting a rebound.
That energy prices rebound was incomplete and that, for me, is the number one factor to expect eased inflation.... which in return can be the best 'chill pill' for Powell and the Feds
🎫Wednesday March 22nd - FEDS Rate Hike
The big one. A 0.50% rate hike is in play, Powell comes out bullish in front of the Congress today but it's the data (Jobs and Inflation) that will be decisive.
If I am right about NFP and CPI I would expect a 0,25% rate hike.
My feeling is that the market and the aware part of the public (including myself) have priced in the scenario of 'Rate hikes close to 6%
Powell's statement was "surprisingly hawkish," said Michael Brown, a market analyst in London. With a 50-basis-point rate hike now in play, Brown said a strong monthly jobs report on Friday would likely lead to "calls for a 6% terminal rate," nearly a percentage point higher than Fed officials had projected as of December.
Democrats on the committee focused on the role high corporate profits may be playing in persistent inflation, with Senator Elizabeth Warren of Massachusetts charging that the Fed was "gambling with people's lives" through rate hikes that, by the central bank's most recent projections, would lead the unemployment rate to increase by more than a percentage point - a loss associated in the past with economic recessions.
In any case, the pressure is ON and this month will 'show'.
I am expecting some more dovish days towards the second half of March, the same way things turned Hawkish after last month's data.
Not going to focus on Eurozone as Europe is a 'Big, Slow ship' that follows at it's own pace and European Central Bank officials have warned that they expect to raise interest rates to record highs after eurozone inflation for February was higher than forecast, even as economists predict a rapid easing in price pressures from the summer....
in other words, the US hikes could be coming to an end whereas the European's have a long road ahead.
CONCLUSION:
Not a perfect time to jump on EURUSD longs but the time to increase them is approaching. Perhaps this or next week i can see myself getting on new EURUSD Long positions.
My analysis shows 1.09 and 1.14 as key targets for this year, with the scenario of 1.036 being the 'worst case scenario' and a level I would love to see and Long.
One Love,
The FXPROFESSOR
PS. The next 15 days will be HUGE and we must be focused and on alert to grab those opportunities. Check my previous ideas and I hope this one also goes as well.

So far so good on the BTC Cup and Handle!Traders,
In this weekly update, I cover the DXY, VIX, US500, US10Y, US02Y, inverted yield and its significance, Eurodollar, Credit Suisse, unemployment, and the Bitcoin. I'll cover a few anomalies that I am seeing in our current market and explain what they might indicate for future price action.
Finally, we will cover that Bitcoin Cup and Handle pattern that I have been projecting for the past few weeks: what happens if it plays out and what happens if it fails.
Stew

Interest rates - Bond yields... Are they really going higher?Recently the market's expectation for the Fed Funds Rate peaking around 5% and then coming down at the end of Q4 2023 changed, with the market now seeing rates going to 5.5%. Many investors/analysts are discussing bond yields heading to 6% and staying higher for longer. However, is that going to happen? What is sentiment telling us right now? What is data indicating? If rates keep going up, what does this mean for other risk assets?
Sentiment right now seems to be quite bullish on yields (bearish on bonds). We are probably near a short-term top for bond yields, and I think this Fed hike may be the last one. The reason is that in Q3-Q4, we started seeing an actual economic deceleration, and inflation dropped significantly. In January, we had some weird data that might have to do with seasonality and adjustments on how inflation is calculated. The critical thing to note here is that rising interest rates act with long and variable lags and that the drop in inflation since July 2022 was caused by factors irrelevant to interest rate hikes.
So let's take things from the beginning... Since Covid hit, we have seen tectonic shifts in markets. Many things changed in the global economy, which was already in bad shape. It's unlikely that inflation will be contained for a long time, given that we are at the end of the debt cycle, the end of globalization, we are in a war cycle, we are at war against the climate, and the labor market is changing rapidly. Therefore, bonds will likely substantially underperform inflation in the next decade. In 2020 and 2021, fiscal policy was heavily used over monetary policy, and we still feel the effects of those policies and the aftereffects of Covid.
US monetary policy started shifting in March 2022, when the Fed began hiking rates and Quantitative tightening in July. Hence the changes in monetary policy couldn't have affected markets, as it takes more than 12 months for changes like this to have any effect. Of course, we also had the Russian invasion, which caused a commodity spike, and we had Europe and the US spending a lot on Ukraine and war equipment broadly. Then the relationship between US and China started worsening, while China was under lockdown and only started reopening in December - January.
The global economy is in terrible shape and will get into a steep recession eventually. Some data make it look strong at times, but it isn't. I think the Fed is looking and acting in the worst possible way, and it's trapped. At the moment, markets are afloat mainly because of human ingenuity, past fiscal and monetary stimulus, and the actions of Central banks like the BoJ, HKMA, and PBoC, as well as the BoE and ECB having some form of QE going on, while the Fed & US treasury is increasing market liquidity by draining the TGA, creating T-bills and bank reserves. It's unclear what will happen when all the interest rate hikes start affecting the economy, but Central banks and Governments will resume supporting markets and the economy. There are several tricks they can implement before they start cutting rates or continuing QE, or doing Yield Curve Control, but ultimately they will get to that point.
Now finally, let's get to the charts!
TLT / UB look like they are bottoming here. Swept the lows but closed slightly above them. Double top and significant gaps are higher, so that's where I think it's headed. I don't want to say that we will go massively lower, but for now, I treat this as a range, and I don't want to let my view that inflation will come down affect me. My target is the range highs and nothing more.
SHY looks like it capitulated and filled a double gap (partially) to the downside. That double gap occurred near the bottom, but now we have a massive double gap open to the upside, telling me it could go higher. Both that and TLT tell me yields down (bonds up)!
Short-term yields have been increasing, with US 2y getting near 5%. Maybe that's the psychological level everyone thinks will break easily, but it doesn't. The majority is eyeing 6%. Perhaps we do a slight break above 5% on the 2y, then fall quickly below it. The average bond yield (random average) is at 4.5%, it also made a new high, but this could be a trap. I am not seeing much strength here. The 10y, which I used as the base chart for today, reaches a critical level where the major correction to the downside began and has found some resistance there.
Finally, I wanted to discuss a few currencies and some overall observations. EURUSD and GBP are at support but looking weak. I can see how they could have one last dip and then higher, but I don't want to see them go much lower from here.
USDJPY and USDCNH are trading higher, with USDJPY being 10% lower from where it peaked. The interest rate differential was the same as now or lower, so something is happening here. Maybe rates are peaking? Maybe the interventions from CBs and Govs are working? Stocks are also much higher than back then, and they don't look like they will go down. Both pairs seem to be back in an uptrend which seems close to peaking. Based on how their charts look, I don't think the USD will keep strengthening, which is telling me that something big has shifted in markets, which is bullish risk assets, and potentially bearish on bonds yields.

AUDUSD retests 4H support after CPI dropHi, traders and TradingView community. Today we saw the AUDUSD retreat after Australian CPI data came in at 7.4, well below the 8.1% that had been expected. Unexpected data almost always has more impact on the market than expected, as it has shock effect.
7.4 is still a very firm number for inflation, and you might think, why is that a good thing? The drop is good, and it shows the RBA’s policy is working, and it also starts to put some doubt on the current rates outlook. But we’re wondering just how good it is. Yes, this could have an impact on the current rates policy, but we still feel that rates will have to continue higher to cut this figure back further.
The AUDUSD continues to fight back after testing .6700. Price at this point remains in its 4H consolidation pattern. Could the market be thinking it’s a good drop, but work still has to be done?
Will we see a retest of .6700 in tonight’s LON session? Buyers have .6752 resistance to beat, and sellers have .6700 to break. These are the 4H levels we are watching on the AUDUSD, and if one of them can be beaten, we will look to see if a new leg can develop.
What are your thoughts? Good trading.

Looking ahead into March 2023 (DXY)In February, we saw the US Dollar Index (DXY) reject the 100.85 price area to climb strongly to the upside due to several key events
1) Federal Reserve hiked rates to 4.75%.
Although the initial reaction was a big drop to test the low of 100.85, the comments accompanying the rate decision indicated that further rate increases could be expected as inflation has eased but remains elevated.
2) Surprising Non-Farm Payroll (NFP)
A massive surprise to the market with a print of 517K (Forecast: 193K) this signaled that the US economy was still performing strongly, despite the ongoing interest rate increases. The DXY shot up to test the 103.75 price level over the next couple of days following the NFP release.
3) Elevated Consumer Price Index (CPI)
Markets were widely anticipating that US inflation growth should have slowed down from 6.5% to 6.2%. However, the CPI data was released at 6.4%, which indicated a slight slowdown (just not as much as anticipated). This played to the previous narrative from the FOMC that while inflation was easing, it was still elevated. With an increased likelihood that the FOMC would continue with its interest rate hikes, the DXY climbed steadily to the upside, breaking the 103.75 level to climb steadily up to the 105.50 resistance level.
Now as we head into March and the DXY is retracing from the 105.50 price level, where could prices head to?
In the lead up to the major news events, the DXY could continue to retrace lower to retest the 104 price level and support area.
1) Will we see a repeat surprise on the NFP?
It is probably unlikely that we'll get a massive surprise again for the NFP this month. However, any positive data release could see the DXY renew its climb to the upside.
2) Focus is on the CPI
As indicated above, February's CPI was released at 6.4% which was higher than expected. A similar release this month would pretty much cement the Federal Reserve's decision regarding a rate hike, bringing further upside to the DXY.
3) Federal Funds Rate
In the recently released meeting minutes, it was highlighted that while all members supported a 25bps rate hike, some would have supported a decision to raise rates by 50bps.
This shows a level of hawkishness within the FOMC, which could be crucial in the decision this month. Employment and CPI data would be the deciding factor between a 25 or 50bps rate hike.
However, remember that the terminal rate is 5.25% and with rates at 4.75%, we are very close!!
We'll have to pay attention to comments regarding a shift in the terminal rates and increased speculation about a pivot to come from the FOMC.
Based on the points discussed above, I am anticipating overall further upside for the DXY, but
Price could first retest the 103.75 to 104 support area.
If the support level holds, this could be a good base for price to rebound and trade back toward the 105.50 resistance area.
Beyond that, the next resistance level is at 107.
Alternatively, if the price breaks strongly below 104, then the next support level at 102.60 would come into play.

1Yr broke recent highs - Long term this could be dangerousShort rates flying (up to 1Yr #yield) Already broke previous highs
Compare to 2 (slightly lower than previous highs) & 10 $TNX (chart tells story)
#Market trading = #inflation higher vs #Fed expectation of 2%
Markets not expecting recession or lower inflation
NO soft landing - party on
But that'll mean eventual HAWKISH FED
Dilemma
#stocks or #economy, only 1

Long TBT ProShares UltraShort 20+ Yr TreasuryThe narrative from earlier this yr that slowing growth would cause the Fed to pivot sooner rather than later is slowly being undone as market participants realize that inflation is sticky and likely to result in rates higher for longer from the Fed. As a play on higher rates I like TBT the ProShares UltraShort 20+ Yr Treasury ETF. It has recently broken its downward sloping trend line and looks poised to take off here.

Market bottom September 2024Putting on the same chart the S&P and fed rate the last three market bottoms happened a year and a half after the fed funds rate peaks. (589 days avg.) That would put the next one in September 2024

DXY GAME ON!! SPIKE COMING FOR THE DOLLAR?Last week's surprising jobs report sticky inflation, and persistent and frothy financial conditions may force the Federal Reserve members into a more hawkish position, forcing them to keep the heat on interest rates and the money supply.
Many market participants were looking for a pause in rate hikes as soon as next month and possibly a pivot to lowering rates shortly after. This new data is going against what the Fed was trying to accomplish in this rate hike cycle, which is
to keep inflation within mandated guidelines, and to tame loose financial conditions, dashing the hopes for a pivot in policy anytime soon and pushing that pivot out for far longer than some were expecting. This will put upward pressure on bond yields and a dollar so heavily shorted causing the pivot crowd to close out some of their short positions as the Fed puts the screws to the money supply and inflation. This classic cup and handle setup illustrates the effect the Fed Policy may have on the dollar.

The yield curve has to un-invert eventually… right? (Part 2)This week, we thought it will be interesting to review the trade from last week given the reaction post-FOMC, as well as discuss an alternative way to set up this trade.
Firstly, let’s review the post-FOMC/employment data reaction.
- Nonfarm Payrolls surprised to the upside, as over half a million jobs were added way above the estimates of a sub 200K number.
- Unemployment rate continues to fall further, reaching a 53-year low of 3.4%
A clear re-pricing has occurred since last Friday’s better-than-expected jobs data and Wednesday’s Federal Reserve meeting. With markets now expecting 1 more rate hike in May, bringing the peak rate up from the 475 -500 bps range to the 500-525 bps range.
Keeping this in mind, we go back to our analysis last week to understand this situation and historical precedence.
While the time for a pause in rate hike seems to be pushed back, in the grand scheme of things, we think that this has only kept the window of opportunity for this trade open for longer and at a more attractive entry point now.
Without repeating ourselves too much, we encourage readers to take a look at our idea last week which explores the historical correlation between the peaking of yield curve inversion and the pause in Fed rate hikes.
Link to our last week’s idea:
This week, let’s tap into a different instrument. Here, we aim to take a short position on the 2Y-10Y yield differential by creating a portfolio of Treasury futures to express this view.
To do so, we would have to first select the 2 instruments, the 2-Yr Treasury futures is a straightforward choice for the short end. But for the 10-Yr leg, we have a choice of the '10-Yr Treasury Note Futures' vs the 'Ultra 10-Yr Treasury Note Futures'. Digging into the contract specification, the 'Ultra 10-Yr Treasury Note Futures' provide a better proxy for the true 10-year duration exposure as the delivery requirements are for Treasuries with maturities between 9year 5 months and 10 years. In comparison, the underlying of '10-Yr Treasury Note Futures' has a maturity between 6 year 6 months and 10 years.
With contract selection out of the way, the next step is to calculate the Dollar Neutral spread. This requires us to identify the DV01 of the front and back legs of the spread and try to match them. This is to ensure that the entire position remains as close to dollar neutral as possible, so we can get a 'purer' exposure to the yield difference between the front and back legs, and parallel moves are negated. CME publishes articles on this topic to explain the setting up of a DV01 spread clearer than we can explain. You can find them attached in the reference section below.
You can handily find the DV01 of the Cheapest To Deliver (CTD) securities on CME’s website.
In this case, we are looking at the 2Yr and Ultra 10Yr Treasury Futures to set up the trade. With the DV01 of the 2Yr at 34.04 and the DV01 of the Ultra 10Yr at 96.26.
The spread ratio can be calculated as 96.26/34.04 = 2.83. Rounding this to the nearest whole number, we would need 3 lots of2-Yr Treasury Future and 1 lot of Ultra 10-Yr Treasury Future, to keep the DV01 equal (neutral) for both legs of this portfolio.
Given our view of the 2Yr-10Yr yield spread turning lower, we want to short the yield spread. Yield and prices move inversely, hence, to short the yield spread, we long the Treasury Futures spread as it is quoted in price. We can long 3 ZTH3 Futures (2Y Treasury Future) and short 1 TNH3 futures (Ultra 10Y Treasury Future) to complete 1 set of the spread. However, since the 2-Yr Treasury Futures has a notional value of 200,000 while the Ultra 10Y Treasury Futures a notional of $100,000, the price ratio will be 6:1 when the position/leg ratio in the spread trade is 3:1. As such the current level would provide us with an entry point of roughly 494 with a minimal move in Ultra 10yrs representing 15.625 USD and that in 2Y representing 7.8125 USD.
While slightly more complex in setting up, this trade allows us another alternative to express the same view on the yield curve spread differential. Being able to execute the trade via different instruments allows you to pick the most liquid markets to trade or take advantage of mispricing in the markets.
The charts above were generated using CME’s Real-Time data available on TradingView. Inspirante Trading Solutions is subscribed to both TradingView Premium and CME Real-time Market Data which allows us to identify trading set-ups in real-time and express our market opinions. If you have futures in your trading portfolio, you can check out on CME Group data plans available that suit your trading needs www.tradingview.com
Disclaimer:
The contents in this Idea are intended for information purpose only and do not constitute investment recommendation or advice. Nor are they used to promote any specific products or services. They serve as an integral part of a case study to demonstrate fundamental concepts in risk management under given market scenarios. A full version of the disclaimer is available in our profile description.
Reference
www.cmegroup.com
www.cmegroup.com
www.cmegroup.com
www.cmegroup.com

satoshi big analyze Bitcoin for 2 yearsyou can see big my analyze,too we can see $70000 for next year 24000
SAVE IT

Market Update - How Traders May Play the Feds Rate Hike?Traders,
The market expects 25 basis points tomorrow. What they are unsure of is how it will look in March. While the fed may indicate yet another rate hike in March, the dollar, vix, and treasuries are telling us else wise. Let's take a spin through our lead indicators today as well as Bitcoin.
Stew

The yield curve has to un-invert eventually… right?Those who have been reading our past 2 ideas will know we’ve been harping on and on about expected rate path and policy timelines. Why the recent obsession you ask? Because we think we’re on the cusp of major turning points.
So, for the third time, let’s look at the market’s expected policy rate path.
With FOMC coming up this week, we are expecting a 25bps hike followed by some commentary/guidance on the next cause of action. Based on CME’s Fedwatch tool, markets are expecting a last hike of 25bps in the March FOMC before a pause in the hiking cycle. Now keep that in mind.
One interesting relationship we can try to observe is how the 2Yr-10Yr yield spread behaves in relation to where the Fed’s rate is. We note a few things here.
Firstly, the ‘peak’ point of the 2Yr-10Yr spread seems to happen right around the point when rate hikes are paused. With the Fed likely to pause as soon as March, we seem to be on the same path, setting up for a potential decline in the spread.
Secondly, the average of the past 3 inversions lasted for around 455 days, and if you count just the start of the inversion to the peak, we’re looking at an average of 215 Days. Based on historical averages, we are past the middle mark and have also likely peaked, with current inversion roughly 260 days deep.
Looking at the shorter end of the yield curve, we can apply the same analysis on the 3M-10Yr yield spread.
The ‘peak’ point of the 3M-10Yr yield spread is marked closer to the point when the Fed cuts, except in 2006, while the average number of days in inversion was 219 days and the average number of days to ‘peak’ inversion was 138 days. With the current inversion at 105 days for the 3M-10Yr Yield spread, we are likely halfway, but the peak is likely not yet in. (Although eerily close to when the Fed is likely to announce its last hike, March FOMC, 51 days away).
Comparing the 2 yield curve spreads, we think a stronger case can be made for the 2Yr-10Yr spread having peaked and likely to un-invert soon.
Handily, CME has the Micro Treasury Yield Futures, quoted in yield terms, which allows us to express this view in a straightforward manner allaying the complications with DV01 calculation. We create the short yield spread position by taking a short position in the Micro 2-Yr Yield Futures and a long position in the Micro 10-Yr Yield Futures, at an entry-level of 0.623, with 1 basis point move equal to 10 USD.
The charts above were generated using CME’s Real-Time data available on TradingView. Inspirante Trading Solutions is subscribed to both TradingView Premium and CME Real-time Market Data which allows us to identify trading set-ups in real-time and express our market opinions. If you have futures in your trading portfolio, you can check out on CME Group data plans available that suit your trading needs www.tradingview.com
Disclaimer:
The contents in this Idea are intended for information purpose only and do not constitute investment recommendation or advice. Nor are they used to promote any specific products or services. They serve as an integral part of a case study to demonstrate fundamental concepts in risk management under given market scenarios. A full version of the disclaimer is available in our profile description.
Reference:
www.cmegroup.com
www.cmegroup.com

VIX long, but how long?VIX price movement is clearly narrowing from a charting technical view, but within the economic fundamentals we have the FED raising rates at an extremely fast pace into a slowdown. Their publicly stated inflation projection was clearly wrong, I highly doubt they will squash inflation with much accuracy given these blunt force tools. For this reason the VIX could go well beyond the 35-40 range if the FED over raised rates. Since Powell was guessing on inflation after injecting more money into the system than ever before(no data to support obviously), it’s fair to assume there is no data to support the current pace and magnitude of raises in this slowing environment. If the current pace is perfect(again no data it would be almost lucky) then the VIX could fall from 35. My base case is the VIX goes over 40 and the FED cuts rates to fix their second mess later this year.

Powell's Power!As of recently we have been in a small bull run. Bulls have been pumping on bad news, being dumb and relentlessly rallying. This is normal for bulls though so what can we expect? Bulls gonna do what bulls gonna do! We are at a strong resistance/supply level however, the bulls have been very violent and are out for blood as they aim to plow through this resistance/supply zone. In a few days we get the new interest rate numbers and if the FED decides to pause the rate hike then the bulls will go crazy and pump spy even higher. A rate hike will most likely drag spy down a bit and put us into lower 400s or higher 390s but, lately bulls have been pumping on bad numbers so we cannot accurately determine their next move. The bulls are at the end of a tunnel and they see the light so they will not stop at any costs, join the rally or get stomped shorting. I'm not a bull or a bear but the trend is your friend, that is if you can spot it.

When downside volatility becomes an advantage.It’s been a while since we looked at the Russell 2000. For the uninitiated, the Russell 2000 index is a small-cap stock market index that is made up of the smallest 2000 stocks in the Russell 3000 Index.
The small-cap nature means a few things, volatility tends to be higher for one. And capturing this downside volatility using the Russell 2000 as compared with the S&P 500 has almost always proven more fruitful.
When to take this trade you may ask? The recession bellwether indicator of the 2Y – 10Y yield spread is a simple place to start. With the benefit of hindsight, shorting each of the indexes at the peak ‘inversion’ points proves to be a decently successful strategy. Especially so using the Russell 2000.
So the next question to ask is if we are near the peak point of inversion?
To answer this, we have to circle back to research from last week, where we discussed the expected rate path for the Federal Reserve (Fed).
In short, markets seem to be pricing in a Fed pause, followed by a pivot in the coming year. Looking back at the charts, this shift in stance (or pause) highlighted in the top chart generally marks the turning points for the 2y-10y yield curve inversion, highlighted in the bottom chart. Therefore, with markets expecting a pause as early as the first quarter, we suspect that the turning point for the yield curve inversion is just around the corner.
On price action, the 1900 level proves to be of significant resistance, with multiple attempts to break through being rejected. As prices creep towards this resistance level once again, we think this might just provide another attractive opportunity for trading.
Zooming out to a daily timeframe, the 0.382 Fibonacci levels marked by the previous high and low, also coincide close to the resistance levels on the shorter timeframe.
The proven downside volatility, along with the coming turning point in the yield curve inversion, keeps us bearish on the Russell 2000. Additionally, the price action points to significant resistance overhead, around the 1900 level. Setting our stop at 2035 level (one Average True Range away & close to the next resistance level) and take the profit level at 1690, with each 1-point increment in the Russell 2000 futures contract equal to 50$.
The charts above were generated using CME’s Real-Time data available on TradingView. Inspirante Trading Solutions is subscribed to both TradingView Premium and CME Real-time Market Data which allows us to identify trading set-ups in real-time and express our market opinions. If you have futures in your trading portfolio, you can check out on CME Group data plans available that suit your trading needs www.tradingview.com
Disclaimer:
The contents in this Idea are intended for information purpose only and do not constitute investment recommendation or advice. Nor are they used to promote any specific products or services. They serve as an integral part of a case study to demonstrate fundamental concepts in risk management under given market scenarios. A full version of the disclaimer is available in our profile description.

im forced to assume dumpsterfire in real estate still oncomparisons are telling us simply when more people are able to borrow money real estate does better. interest rate data from whale crew tells us as long as we climb this indication the risk gets worse for borrowers. as long as those go in the specified direction im looking at higher prices in this fund. all is normal as in everyone is doing fine, and still doesnt want to buy a home; snafu reit. housing market could recover i just want these metrics to go the opposite way before i call it a recovery.
