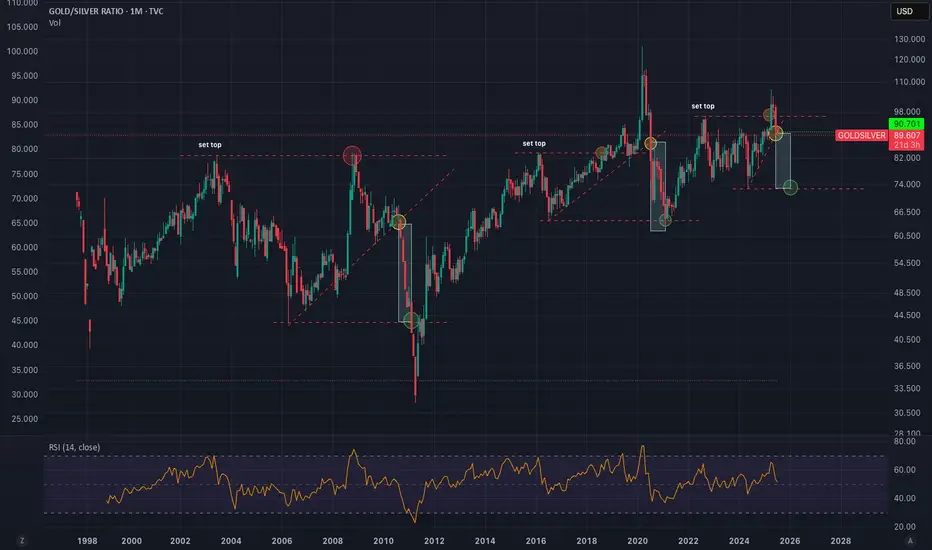
Gold/Silver Ratio to 72 Minimum - Imminent Silver BreakoutGoldSilver Ratio is following a clear pattern of behavior. We can expect a return to mean conservatively hitting 72 at a minimum. This puts silver at $46-58 if Gold doesn't move higher. I think we will see silver 5-10X over the next few years. Easy 25-50% in the short term (6-12 months).
Ratio
QQQ NOTICE TREND LINE SUPPORT I have now started to position for the transition in the markets I have moved out of all calls again for the 4 time in 4 days each of the trades made $$ . but today is day 39 TD of the rally . And I am looking for a TOP in day 40 TD I have now moved to 40 today then 75% MOC in spy and qqq 5550 555 560 QQQ puts 2026 time zone and 650 in spy . The trendline has held rather nice to help make some nice $$ and we if bullish should now be in early wave 3 of 5 of 5 of 5 .So why buy puts NOW simple answer is It could still be wave c up for wave B or wave D. and That today is day TD39 I have posted a possible Major top due on td 40 and The spiral hold up into june 6th to 9th .I know my risks and am willing to start taking the same stand and positions as I did 11/29 12/6 and feb 18th based on the wave structure and PUT /CALL model . I am willing to This is not for all traders . But I am turning down in NYSI and the NYMO is showing buying is running out but bullish call buying is nearing the two last TOPS . I have 25 % cash and will wait for two things One put call drops to 60 on 5 day or 10 day at 65 second daily RSI is no confirmation . 3rd the qqq reaches 531/534 knowing it could extend to 541/555 and similar in sp cash or the DJI prints a .786 this is a lot but it is part of the game plan best of trades WAVETIMER

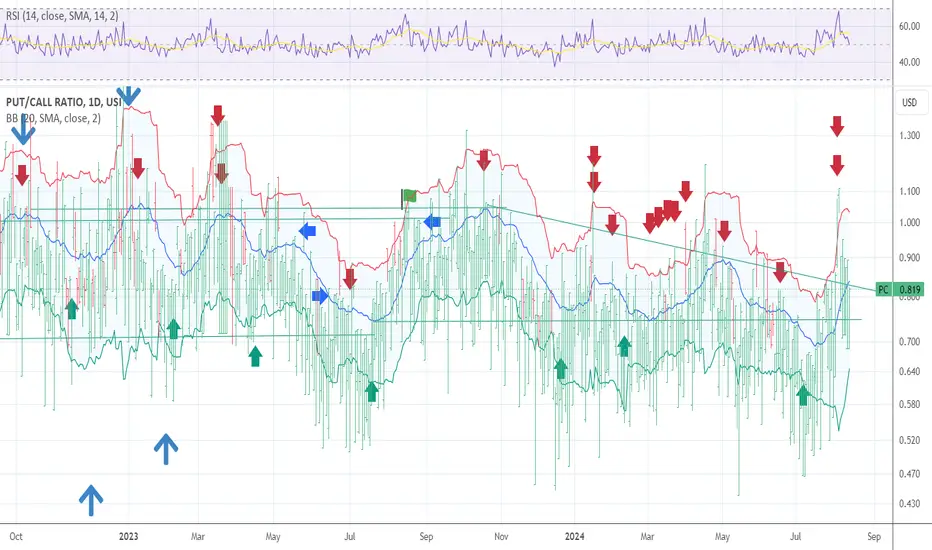
Extreme complacency is a major warning sign ! I have used the put call ratio to identify some very extreme readings in market sentiment.

PUT CALL MODEL SELL SIGNAL is Been given The chart is my own model Take notice of the green arrows and that trend line Notice anything ??? I do hope so . The trend is your friend till the End Time to hold my Beer ! best of trades WAVETIMER 85 % long puts waiting and hoping for a final POP .

PUT CALL SELL SIGNAL IS NOW IN PLACE I am 100% short The chart posted is the put/call model We popped thru the bb bands I have now moved to a 100 % puts in the money dec 26 on qqq and spy I will add if the qqq can print 494 or the Spy can print and new high The cycle top was due 5/12 is a minor n MAJOR Best of trades Wavetimer

Ratio Charts in TradingView and IAAbove you can see the Bitcoin to Ethereum ratio chart. Ratio analysis between two or more symbols is a critical method for comparing the strength and weakness of assets relative to each other. TradingView offers basic capabilities for this task, but with the help of artificial intelligence (AI) and custom scripts, much more advanced and creative analyses can be conducted.
Here are some practical ideas:
1. Creating Conditional Ratio Scripts
2. Comparing Relative Averages and Issuing Smart Signals
3. Calculating Composite Ratios of Multiple Assets
4. Smart Alerts Based on Price Pattern Breakouts
For more information, search Google for "How to Use Ratio Charts in TradingView: A Hidden Gem for Traders."

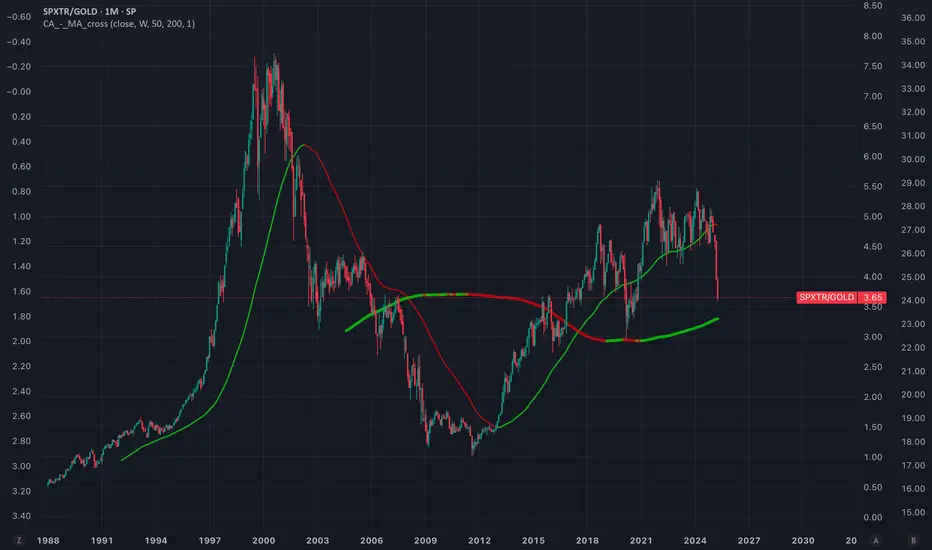
SPX/GOLD ratio near to key supportcrossing below moving average of 200 months could trigger a secular movement in favour of gold.
Potential global debt colapse and lack of confidence in USD + high valuation, mag-7 concentration and high growths expectations on AI are macro/fundamental facts that supports this idea.
Some say bitcoin is an un-correlated asset. What about XRP ???This chart clearly shows how XRP is uncorrelated to the price of the S&P !!
Some experts in crypto say that Bitcoin is an un-correlated asset. However, if bitcoin is, XRP is even more so.
The chart moreover shows how the price of XRP broke out of an 7 YEAR BEAR FLAG !!!
It broke down decisevely in november 2024.
At the present moment it is making a halt, drawing a bear flag (n° 2) as it did after it broke down of a very similar bear flag in March of 2017 (n° 1).
How do you think this will resolve ?
Any more questions ?
This is a very bearish chart - for the SPX !!!

Russell 2000 $IWM Trending UP versus Nasdaq $QQQ Here is a ratio chart of the Russell 2000 Index etf called AMEX:IWM and the Nasdaq Composite Index etf called $QQQ.
The NASDAQ:QQQ returns over the past 7+ years have been extraordinary while the AMEX:IWM has been stagnant at best and hasn't beaten inflation.
That ratio of performance has just turned in a way that suggests the AMEX:IWM will outperform the NASDAQ:QQQ for the next 11 weeks to the tune of 10%.
The ratio has already moved up last week by 4% of the 10%, so there is only another 6% to go for this signal. If there are any pullbacks of 1%-2%, those would be lower risk entries as the distance to the "stop" level at 0.45 vs 0.4704 last would be less. The target is 0.51 vs 0.4704 last.
So follow this ratio for the next 10 weeks and see if even more relative outperformance happens.
Over the next few years, it is possible for AMEX:IWM to do 50% better than $QQQ.
We would need lower oil prices and lower interest rates and some rational pricing in the big tech names that are over $10 trillion dollars now for 3 companies: NASDAQ:NVDA , NASDAQ:MSFT and $AAPL.

Silver/Gold Ratio signals Lower Interest Rates AheadWhen OANDA:XAGUSD (Silver) does well relative to OANDA:XAUUSD (Gold), it means the economy is strong and interest rates tend to rise when that happens. The opposite is also true. When Silver is weak relative to Gold, interest rates tend to fall.
See how it works historically? The 1997 drop in rates when the silver/gold ratio shot up is the rare exception
Why does it work? Silver is an economic metal used in industry and gold is a precious metal which used to be used for technology in the 1970's.
Well - it shows now that rates should be going down because the economy is flat, weak or recessionary. However you want to label it, the economy can afford lower interest rates.
This LONG TERM indicator has worked quite well and deserves to be on your list of indicators to track the likely path of interest rates. OF COURSE, the more important factor is WHO is at the head of the Fed.
Lower rates would make sense especially if the profligate Government spending machine slows down its aggressive spending. The global war on covid didn't help and the clear message that the market is telling us is that we needed to slow down the price hikes but we now have a US Gov't deeply in debt and struggling to be able to justify lower rates.
Here's to clarity on the future moves by the Fed, which if you were just looking at this indicator you would be cutting rates steadily for the foreseeable future.
Cheers,
Tim
11:47AM EST January 28, 2025

G&S ratio rising could be bearish on metals medium termThe G&S ratio is back above resistance (now support) and wants to break out of the bullish wedge in dark rose color.
If that happens, an inverse H&S formation could play out and shoot us up (blue line) to the extension of the rising resistance of the (yellow) bearish rising wedge. This would mean a last hurray spike of the ratio, to touch the apex a last time before falling again.
The final fall of the G&S ratio would then signal the risumption of the bull market and the further collapse in the G&S ratio would signifie a raging bull market for precious metale (both silver and gold - but especially silver).
The bull market in metals is unavoidable with the current macro sitauation. However its resumption could be delaid if this set up plays out.

Could XLM be about to M A S S I V E L Y outperform XRP ??1 I am bullish both XRP and XLM
2 Both currencies make out 65% of my entire portfolio.
3 I have 40% XRP and only 20% XLM
However, I guess XLM Stellar could massively outperform XRP in the future.
XRP just happened to break out from an important multi year resistance this pas week !
So I am wildly bullish on XRP.
However the ratio betwen XRP and XLM suggests that XLM will be the winner in the near term.
The OVER PERFORMANCE will be at least by a factor of 2.
However, chart (inverse Head and Shoulder) is suggesting that XLM will be more valueable than XRP in the long term.

SPX Ratio on Stock600Hello,
A little comparison between two markets, the SP500 and the Stock600.
I made a little ratio to see where the money is going!
The result is clear, the currency is going to the USA and not to old Europe.
Does Europe still have a future, with 27 countries!
Your opinion interests me.
Make your opinion, before placing an order.
► Thank you for boosting, commenting, subscribing!

BRK.B ratio to SPX daily.Hello community,
I had fun doing the ratio between Warren Buffett's stock and the SP500 via the SPX, since the beginning of the year.
The result on the graph, i.e. 5.11% in favor of Warren.
Grandpa Warren, still holds the road, despite his 94 years.
Experience and wisdom have struck again.
Bravo the artist.
Make your opinion, before placing an order.
► Thank you for boosting, commenting, subscribing!

TSLA eyes on $255: break could give a 13% POP minimumTesla is at a KEY resistance zone around $255.
Cluster of 3 fibs including key Golden Genesis.
Break should be a quick pop to next resistance.
=========================================

Gold is surging while Crude Oil is laggingHere is a ratio chart of Gold OANDA:XAUUSD and Crude Oil $USOIL.
Historically you can see it goes to extremes. Especially in 2020 when crude oil went to zero (and negative). I cut that spike out of the chart so hopefully it shows here.
When the Global Financial Crisis in 2008-2009 hit, crude oil hit $140 and gold was low which set up the bottom of this chart on the lower-left. Crude was expensive and gold was cheap.
The opposite happened during Covid when crude plunged and gold stayed relatively calm.
These are generational trades that can make traders rich but they take too long for the average small investor to stay focused and take advantage of these setups.
With Gold now at the upper end of the range of this ratio, it is time to start looking elsewhere to protect your wealth.
Can this ratio continue higher? Yes, of course.
I point it out as a starting point for your trading. If you are just getting long gold up here now, you need to understand where the historical range is for this ratio and decide if you want energy to keep you warm and let you travel or do you want a store of money. It is always a trade-off between the two. You can't live with only one of these commodities.
Cheers.
Tim
12:33PM EST, October 22, 2024

Is Silver About to Rewrite the Rules of the Global Financial GaIn a remarkable twist of market dynamics, silver – long overshadowed by its golden cousin – is positioning itself for what could be its most dramatic transformation in decades. Russia's unprecedented decision to add silver to its central bank reserves has sent shockwaves through the precious metals market, potentially signaling a fundamental shift in how central banks view this dual-purpose metal. This strategic move, combined with a staggering supply deficit of 663 million ounces projected through 2024, suggests we may be witnessing the early stages of a historic price realignment.
The numbers tell a compelling story: a 41% price surge year-to-date, pushing above $33.89 per ounce, with analysts projecting potential moves beyond $40 before year's end. Yet it's not just the price action that's turning heads. The convergence of industrial demand from emerging technologies, particularly in renewable energy and electronics, alongside traditional investment demand, has created a unique supply-demand imbalance. This structural deficit, coupled with major central banks' expected rate cuts in 2024, could catalyze a powerful upward price trajectory.
Perhaps most intriguing is the current gold-silver ratio of 81:1, sitting well above its historical average of 55:1. This disparity, viewed alongside Russia's groundbreaking policy shift, raises a provocative question: Are we witnessing the early signs of a new monetary paradigm where silver reclaims its historical role as a strategic reserve asset? For investors and market observers alike, the unfolding story of silver in 2024 may well represent one of the most compelling opportunities in the precious metals space – a narrative where industrial necessity meets monetary revolution.

ZS eyes on $ 175.xx: key resistance that could mark the "Bottom"ZS bounced from the major/critical support.
Now testing first seriou and proven resistance.
Break and Retest could mark+seal the bottom.
=========================================

UEC heads up at $6.66 (!) then $7.25: Uranium ready for a dip?Uranium has been on the uptick for a while.
Many are overbought and due for a pullback.
This is one example reaching key resistances.
$ 6.61 - 6.67 is the immediate resistance
$ 7.25 - 7.59 will be the breakout barrier.
$ 5.46 - 5.58 will be last uptrend support.
=======================================

Record levels of complacency means market topping outIn this post, I have shown the put-call ratio which is a reliable measure of sentiment in the market. When everyone is optimistic, that's typically when the market tops out.

Sentiment switch from panic to complacencyAfter the selloff in early August due to the Yen carry trade, panic levels exploded. However, over the past 3 weeks, the market is back to extreme complacency and that's not a good sign for the bulls.

PUT CALL BUY SIGNAL MAJOR SP 5760/5880 The chart posted is my 20 day put/call . We have now reach a .50 % of the drop in QQQ and we have broke above .618 and 50 % of the drop in the sp 500 cash . We are alos forming clean 5 waves up patterns based on this chart in the put /call alone I must view the correction as OVER I had saw a chance to drop into 8/12 but the structure has turned up . Once we break above todays high n on a closing basis I will look for the min of a .786 to re think . Wavetimer
Asymmetric Risk Reward: The Secret to Success in Trading?Be as bold as you want yet protect your capital with the asymmetric risk reward strategy — an approach adopted by some of the greatest market wizards out there. In this Idea, we distill the concept of asymmetric bets and teach you how to risk little and earn big. Spoiler: legendary traders George Soros, Ray Dalio and Paul Tudor Jones love this trick.
Every trade you open has only two possible outcomes: you either turn a profit or make a loss. Perhaps the greatest thing you can learn about these two outcomes is the balance between them. The fundamental difference between making money and losing money — the mighty risk-reward ratio .
The risk-reward ratio is your trade’s upside relative to the downside you baked in (or realized).
Let’s Break It Down 🤸♂️
Most traders believe that you have to take huge risks to be successful. But that’s not what the big guys in the industry do with the piles of cash they’ve got. Instead, they try to take the least amount of risk possible with the most upside. That’s what asymmetric risk-reward ratio means.
Think of it this way: you invest $1 only if you believe you can ultimately make $5. Now your risk-reward ratio is set at 1:5, or a hit ratio of 20%. Safe to say that you’ll likely be wrong lots of times. But step by step, you can risk another dollar for that $5 reward and build up a good track record or more wins than losses. That way you can be wrong four times out of five and still make money.
Let’s scale it up and pull these two further apart. Let’s say you want to chase a juicier profit with a small risk. You can pursue a risk-reward ratio of 1 to 15, meaning you risk $1 to make $15. The odds are very much in your favor — you can be wrong 14 times out of 15 and still break even.
What Does This Look Like in Practice? 🧐
Suddenly, the EUR/USD is looking attractive and you’re convinced that it’s about to skyrocket after some big news shakes it up. You’re ready to ramp up your long position. Now comes decision time — what’s a safe level of risk relative to a handsome reward?
You decide to use leverage of 1:100 and buy one lot (100,000 units) at the price of $1.10. That means your investment is worth €1,000 but in practice you are selling $100,000 (because of the leverage) to buy the equivalent in euro. In a trade of that size one pip, or the fourth figure after the decimal (0.0001), carries a value of €10 in either direction.
If the exchange rate moves from $1.1000 to $1.1100, that’s 100 pips of profit worth a total of €1,000. But if the trade turns against you, you stand to lose the same amount per pip. Now, let’s go to the practical side of things.
You choose to widen the gap between risk and reward and aim for profit that’s 15 times your potential loss. You set your stop loss at a level that, if taken out, won’t sink your account to the point of no return. Let’s say you run a €10,000 account and you’ve already jammed €1,000 into the trade.
A safe place to set your stop loss would be a potential drawdown of 2%, or €200. In pip terms, that’s equal to 20 pips. To get to that 1:15 ratio, your desired profit level should be 300 pips, aiming for a reward of €3,000.
If materialized, the €3,000 profit will bump your account by 30% (that’s your return on equity), while your return on investment will surge 200%. And if you take the loss, you’d lose 2% of your total balance.
It’s How the Big Guys in the Industry Do It
You’d be surprised to know that most of the Wall Street legends have made their fortunes riding asymmetric bets. Short-term currency speculator George Soros explains how he broke the Bank of England with a one-way bet that risked no more than 4% of his fund’s capital to make over $1 billion in profits.
Ray Dalio talks about it when he says that one of the most important things in investing is to balance your aggressiveness and defensiveness. “In trading you have to be defensive and aggressive at the same time. If you are not aggressive, you are not going to make money, and if you are not defensive, you are not going to keep money.”
Paul Tudor Jones, another highly successful trader, spotlights the skewed risk-reward ratio as his path to big profits. “5:1 (risk /reward),” he says in an interview with motivational speaker Tony Robbins,” five to one means I’m risking one dollar to make five. What five to one does is allow you to have a hit ratio of 20%. I can actually be a complete imbecile. I can be wrong 80% of the time, and I’m still not going to lose.”
What’s Your Risk-Reward Ratio? 🤑
Are you using the risk-reward ratio to get the most out of your trades? Do you cut the losses and let your profits run by using stop losses and take profits? Share your experience below and let’s spin up a nice discussion!
