RAYUSDT 1W AnalysisRAY ~ 1W Analysis
#RAY Buy back gradually from this support block with a short term target of at least 15%+ from here.
Ray

RAYDIUM is looking for support. Watchlist material. RAY is looking to find its bottom. RR is in favour of a long. Horizontal support is a clear invalidation of the bullish thesis. A break below confirms a lower low.
Full TA: Link in the BIO

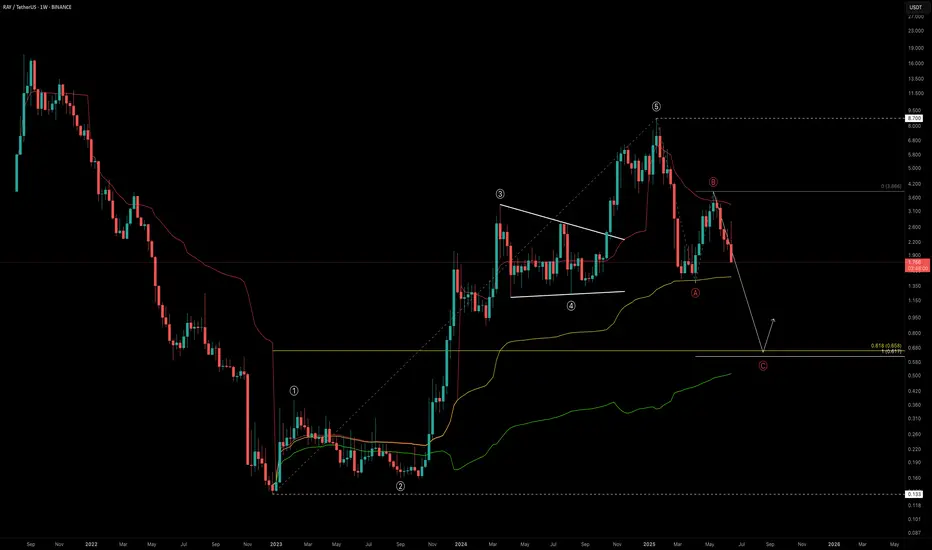
RAY Outlook: Is a -60% Drop the Reset We Need?RAY marked its bottom in December 2022 at just $0.133, entering a prolonged accumulation phase that lasted nearly a year. Then, in late 2023, it broke out into an explosive bull run, skyrocketing +6421% over 756 days and peaking at an impressive $8.70.
This run completed a full five-wave Elliott Wave structure. After topping out, RAY dropped -84% down to $1.388 — likely marking the Wave A correction. A strong relief rally followed into the $4 region before facing rejection at the yearly VWAP, possibly completing Wave B. Now, all signs point toward us being in the final Wave C of the larger corrective structure.
So, where could Wave C bottom out?
🔍 Fibonacci Confluence Zones (Log Scale)
Let’s assess the key levels with log-scaled Fibonacci tools:
🔹 Fib Retracement (from $0.133 low to $8.7 high):
The 0.618 fib retracement lies at $0.658
🔹 Trend-Based Fib Extension (Wave A → B projection for Wave C):
1.0 TBFE sits at $0.617
✅ These two levels align nearly perfectly, giving us a strong confluence zone between $0.62 and $0.66
Additional Confluences
Anchored VWAP Bands:
The 0.618 VWAP band multiplier also aligns with this $0.6 zone
Liquidity Perspective:
This level would wipe out long positions built over the past 550 days — clearing and potentially resetting the market
🚨 Fair Value Trend Model (FV Trend Model):
According to my Fair Value Trend Model indicator, the fair value for RAY currently sits around $0.78 — right in line with the broader confluence zone. This model uses log-log regression to estimate Bitcoin’s and other assets’ fair-value over time.
👉 Feel free to use the indicator
Just head over to my profile, click on the “Scripts” tab, and you can add the Fair Value Trend Model to your charts to experiment with it yourself.
Together, these technical elements form a compelling high-probability zone for long setups around $0.6–$0.8.
💡 Educational Insight — Why 0.618 is a Critical Fib Level
In Elliott Wave theory and harmonic trading, the 0.618 retracement is known as the "Golden Ratio" — often serving as a magnet for price during corrections. When paired with a 1.0 trend-based fib extension, it can mark exhaustion zones where Wave C concludes.
🔭 Summary: What’s Next for RAY?
Potential bottom zone: $0.61–$0.78
Watch for reversal signals like bullish candlestick patterns, volume spikes, or divergences
A drop to this zone would represent a -60% drawdown from current levels
Remember: High-probability setups don’t come every day — patience is your edge
Set alerts. Stay prepared.
_________________________________
💬 If you found this helpful, drop a like and comment!
Want breakdowns of other charts? Leave your requests below.
RAY (Raydium) – Long Swing Trade Setup from Major SupportRAY is trading at a major support zone between $2.85 – $3.25, which historically has acted as a base for significant upward moves. With strong support beneath and favorable upside targets, this presents a solid long swing opportunity with clear invalidation.
🔹 Entry Zone:
$2.85 – $3.25 (key support and previous accumulation range)
🎯 Take Profit Targets:
🥇 $4.23 (previous resistance and psychological level)
🥈 $5.00 (key breakout level and round number target)
🛑 Stop Loss:
$2.84 (tight invalidation just below support zone)

Breaks Out of Red Resistance Zone 🚨 NASDAQ:RAY
Breaks Out of Red Resistance Zone 🚨
NASDAQ:RAY
has successfully broken out of the red resistance zone, which was part of a symmetrical pattern. This breakout could signal a strong bullish move.
📈 Technical Overview:
Pattern: Symmetrical
Breakout Level: Red resistance zone.
🎯 Potential Targets: To be determined upon further price action.

Solana | BULLISH ON SOL | SOL Dominates Blockchain RevenueEven with a dip in activity particularly around memecoins, Solana has managed to hold its ground impressively when it comes to generating revenue.
While you might think fewer transactions would automatically mean less money coming in, Solana's performance shows otherwise. This ability points to the solid value being created by the different applications and uses on the network right now.
A big reason for this financial resilience is the continued strength of dApps on Solana. These apps have been really effective at bringing in fees and adding value to the network. It seems that while the hype around certain speculative tokens has died down significantly, the core utility and economic activity within Solana's dApps are still going strong. This shift towards more fundamental uses for generating revenue is a really positive sign for how the network can keep growing in the long run.
Looking ahead the future for SOL is bright imo as more projects are linking Artificial Intelligence with Solana, taking advantage of its speed and low costs to build new things. Plus, the introduction of Solana ETFs in Canada is a big step.
Other Solana-based alts including Official Trump (TRUMP), Jupiter (JUP), Raydium (RAY), and Bonk (BONK), have followed SOL with good price increases.
It seems like the focus is shifting towards building more lasting and useful applications. With ongoing support for developers and increasing interest from the traditional financial world, Solana seems well-positioned to handle market ups and downs and keep finding new ways to create value in the future. I'll definitely be watching to accumulate for the long-term.
______________________________
BINANCE:SOLUSDT

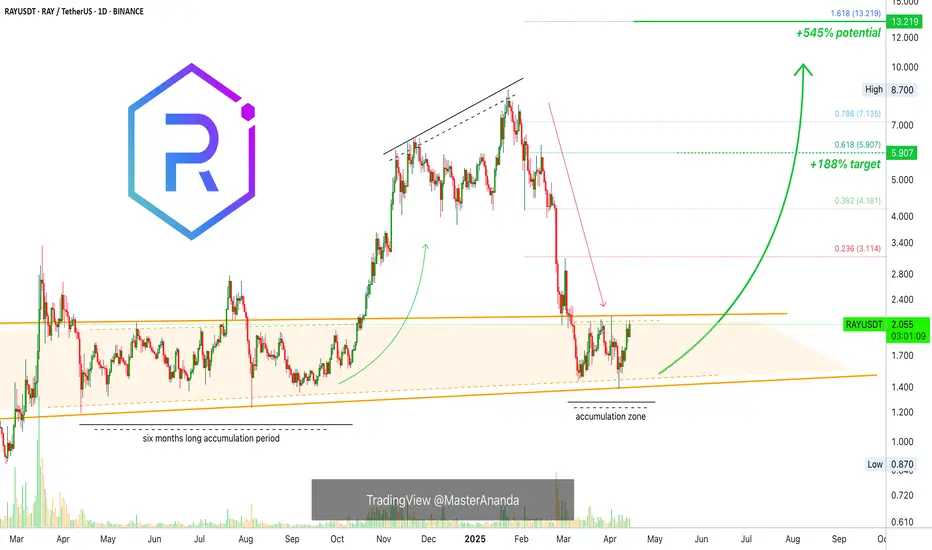
Raydium Medium Sized +545% Wave Mapped (Trading Strategy)This is one of those pairs that grew in astonishing ways since late 2023. Raydium managed to grow by 5,372% from October 2023 through January 2025. Simply amazing. I was very surprised when I found this pair as it moved beyond all expectations.
The last advance was preceded by a six months long consolidation phase. The whales used this period to accumulate. When one phase is long, the next one is short. This means that RAYUSDT can start to grow soon. This is based on the law of alternation.
Needless to say, the chart is full of higher lows and the action continues to be strong. I am tempted to open some LONGs.
This is a solid trade setup. It has low risk vs a high potential for reward.
This one can turnout into something good but please keep in mind that we have a little over two weeks before the market becomes full time bullish. Right now it is still early for the upcoming bullish wave. The reason I am all in now is because my group likes to enter early. Some other people prefer waiting and confirmation. We like early because it allows for maximum profits potential. The risk is higher but also the reward.
If you are uncertain or have doubts, you can always wait. The thing about Crypto is that when it moves it does so strongly, by the time we have confirmation the market is always several levels up. It can make a huge difference.
How you approach the market depends on your trading style, your risk tolerance, your capital, your goals. If you want to get in and get out, it is wise to wait until the action is hot. If you want relaxation, peace of mind and easy profits, it is better to buy and hold. If you have lots of time and energy to invest in this game, you can use all the different methods at the same time; a stack for long-term, a stack for passive hold, a stack for short-term and another portion of your capital for leveraged trades. It is also smart to leave some funds behind because good opportunities come out of nowhere. If we have funds available just because, we might end up with something that does better than our best choice.
It is a big game. It can be entertaining and profitable. There is lots to learn as well. You cannot hide here, if your ego is too strong, you will see the results in your funds. If you cheat yourself, if you lie to yourself, you will know it because your money will be gone. If you are honest with yourself and accept your mistakes, the market will give you as much as you can take.
Namaste.
Breaking: Raydium ($RAY) Reclaims $2 PivotRaydium's ( NASDAQ:RAY ) which is an automated market maker (AMM) and liquidity provider built on the Solana blockchain for the Serum decentralized exchange (DEX)'s native token has reclaimed the $2 pivot albeit the crypto market is in a general market correction.
The asset surge 6%, and is gearing up for a breakout to the $3 resistant as a breakout above the $2.3 region would cement the grounds for a bullish continuation move to the $3 point.
Unlike any other AMMs, Raydium provides on-chain liquidity to a central limit orderbook meaning that funds deposited into Raydium are converted into limit orders which sit on Serum’s orderbooks.
With the RSI at 60, Raydium is poised for the breakout move as momentum builds up.
However, should NASDAQ:RAY fail to pull up the stunt, a consolidation move to the $1.8 support point will be vehemently tested.
Raydium Price Live Data
The live Raydium price today is $1.99 USD with a 24-hour trading volume of $98,068,751 USD. Raydium is up 1.71% in the last 24 hours, with a live market cap of $578,910,409 USD. It has a circulating supply of 290,814,662 RAY coins and a max. supply of 555,000,000 RAY coins.

RAYUSDT 1WRAY ~ 1W Analysis
#RAY Buy gradually from here if you still have a Conviction on this coin with a short -term target of at least 20%+.

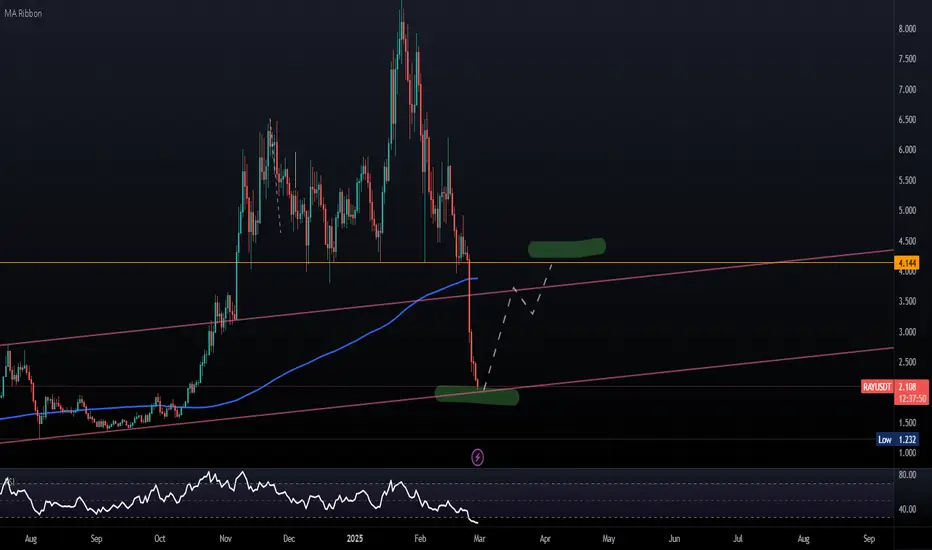
Raydium RAY price analysisNot so long ago, we published an idea on #OM and wrote that MM holds the price well
And here's what happens when MM lets the price go "free floating" and stops pushing it up on the example of #RAY
If OKX:RAYUSDT fails to consolidate above $4 in the near future, there may be another wave down, and the price of #Raydium may drop to around $1.5
_____________________
Did you like our analysis? Leave a comment, like, and follow to get more

Breaking: Raydium ($RAY) Surge 15% TodayRaydium an automated market maker (AMM) and liquidity provider built on the Solana blockchain for the Serum decentralized exchange (DEX) saw its native token NASDAQ:RAY surge 15% today amidst general market volatility.
The asset while trading at the $6- $8 axis just a month ago lost almost 80% of total value plummeting from a high of $8 to almost $1.5 causing panic selling behaviour. But momentum is brewing up.
A move above the 61.8% Fibonacci retracement point could catalyse a bullish move for NASDAQ:RAY with a move to the 1-month high resistant. Similarly, with the RSI at 60, NASDAQ:RAY might experience a temporary cool-off a move that might lead to a consolidatory move to the 1-month low that is not too far from the current market price.
Raydium Price Live Data
The live Raydium price today is $1.86 USD with a 24-hour trading volume of $260,230,671 USD. Raydium is up 15.98% in the last 24 hours, with a live market cap of $541,218,025 USD. It has a circulating supply of 290,847,971 RAY coins and a max. supply of 555,000,000 RAY coins.

New day, new DOUBLED stock $RAY $0.87 to $2.14Doesn't matter what the market is doing!
Our stocks still double! 💯
It's time to adjust your trading strategy to get ahead
Trading NASDAQ:NVDA NASDAQ:TSLA competing with wall street sharks for 10% 20% over weeks or months is not it!
It's much easier taking money from retail shortsellers as they get squeezed into vertical +100% +200% moves

RAY - Long Scenario - $4RAY has pulled back to its long-term ascending support line. The expectation is for a retest of the previously lost support at $4.
Best, Hard Forky
Is RAYUSDT About to Break Out? Key Levels to Watch Now!Yello, Paradisers! Is RAYUSDT gearing up for a massive breakout? The chart is showing a proper triple zigzag within a descending channel, which significantly increases the probability of an upcoming bullish move.
💎If RAYUSDT bounces from the current level, it could form a W-pattern, but for a high-probability setup, we need to see a breakout and a confirmed candle close above the key resistance. This move would also break the descending channel, signaling a stronger bullish push.
💎On the other hand, if the price retraces further or consolidates, a bounce may still occur, but the setup would be lower probability, making it less favorable to trade in this zone.
💎However, if RAYUSDT breaks down and closes below the support zone, the entire bullish setup will be invalidated. In that case, it would be wiser to wait for better price action before looking for new opportunities.
🎖 Patience and discipline are key, Paradisers. If this breakout happens, it will be a strong opportunity—but if invalidated, we wait for the market to present a better setup. Trade smart!
MyCryptoParadise
iFeel the success🌴

#RAY/USDT#RAY
The price is moving in a descending channel on the 1-hour frame and is expected to continue upwards
We have a trend to stabilize above the moving average 100 again
We have a descending trend on the RSI indicator that supports the rise by breaking it upwards
We have a support area at the lower limit of the channel at a price of 4.10
Entry price 4.46
First target 4.60
Second target 4.75
Third target 4.92

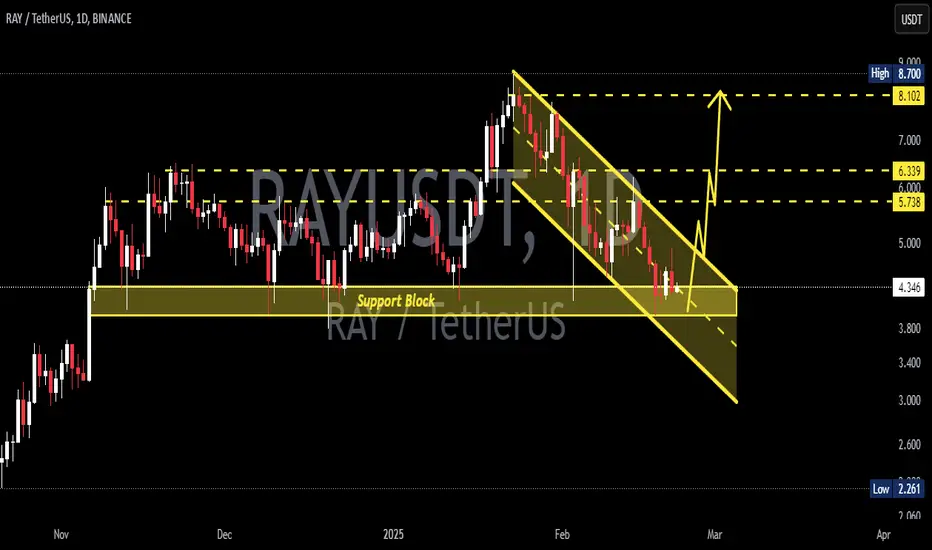
RAYUSDT 1DRAY ~ 1D Analysis
#RAY Buy from here or buy after successfully penetrating the resistant line of this pattern, with a minimum target of 15%+
#RAY/USDT#RAY
The price is moving in a descending channel on the 1-hour frame and is adhering to it well and is heading to break it upwards strongly and retest it
We have a bounce from the lower limit of the descending channel, this support is at a price of 4.80
We have a downtrend on the RSI indicator that is about to break and retest, which supports the rise
We have a trend to stabilize above the Moving Average 100
Entry price 5.05
First target 5.31
Second target 5.62
Third target 6.01

RAYUSDT 1DRAY ~ 1D Analysis
#RAY This is also one of the best coins, for now re -testing this support.Buy from here with a minimum target of 15%+


Ray review analysis: can we wait for the second wave of rise?hello friends
Due to the good price growth of this currency, it has been placed in a range, and with the breaking of that range, a double bottom pattern has been created on the ceiling of the range, which can be expected to move up to the specified limits.
We can enter into the transaction with capital and risk management.
*Trade safely with us*


Analysis and review of rayhello friends
This coin, which has grown well, is now a good opportunity to buy with its correction.
Now, buy step by step within the specified limits and move to the specified goals.
*Trade safely with us*
