Energy is Breaking OutCrude Oil, Gasoline, and energy stocks are breaking out. These are the charts and trends we are watching most closely to confirm this breakout.
Rb1

GASOLINE Buy the dip for the next 2 monthsGasoline (RB1!) has been supported by the 1D MA50 (blue trend-line) since January 2022 and after the most recent contact with the trend-line (April 07 2022), it has been on a strong rise.
This shouldn't surprise us as the 1D RSI has been printing the same pattern as the March - June 2021 period, when Gasoline formed a Channel Up supported by the 1D MA50. This suggests that every dip towards the Support should be bought until at least the end of July.
--------------------------------------------------------------------------------------------------------
** Please support this idea with your likes and comments, it is the best way to keep it relevant and support me. **
--------------------------------------------------------------------------------------------------------

Oil vs Money SupplyPeople think oil just went to "record high prices". But this is a perspective that has been distorted by money supply growth. It's also targeted propaganda specifically to make you think and HOPE that it won't go any higher. If you account for money supply growth, you get a sideways chart. Not a coincidence.
Good luck and hedge your bets

Gas just got expensiveIn the chart is the M2 adjusted price of gasoline matched to the current price. It measures the portion of total dollars it would take to purchase a gallon of gasoline. Essentially it's a chart of dollar strength in gasoline terms.
Chart up = strong gas, weak dollar.
Chart down = weak gas, strong dollar.
The white trendline in the center is the longterm linear regression, the center of the logarithmic price distribution (but only back to 1986).
To calculate this symbol yourself:
RB1! price = 3.798
RB1! / WM2NS price = 0.0001758
3.798 / 0.0001758 = 21604
Now we simply enter RB1! /WM2NS*21604 to get our current price.
What the chart does not show is that over the years, public ownership of the dollar supply has gone down. As you pump unwarranted dollars into the economy, you get diminishing returns on real gdp growth and thus a reduction in productivity. No measurements are being made, dollars are only being thrown into the system. More doing, less thinking and measuring. Therefore, people have less overall dollars, relative to the total supply of dollars, to spend on gasoline as they did in previous decades. For example, around the 1970s, the FED could squeeze out about 70 cents in GDP per 1 dollar printed. (Actually they didn't squeeze anything, they just sat on their ass) Fast forward to 2022, these reckless and dogmatic pseudo-scientists are getting around 30 cents per dollar printed. If people are economically half as productive overall, PERHAPS everyday people will only be able to afford about HALF as much stuff and therefore half as much gasoline as when it was just as expensive in the past. Just something to think about, seeing as how regular citizens didn't get much of that money. Those who work the hardest are not worthy of the easy money printed by our glorious church of the FED.
Consider how gasoline peaked around 7$ multiple times, in '85, '90, '05, '06. Now imagine if society was half as productive back then, that's basically saying it's 14$ in today's terms if you account for money productivity AND money supply expansion.
Probably not the most settling idea.
Good luck and hedge your bets.

USDGAS LONGS 📉📉📉📉 Expecting bullish price action on this assset as price get out of the range, making higher lows and higher highs meaning that bulls are in power in this area. Price could retrace back into 4.0 as psychological area + discount market area fiboncai that sets perfect long opportunities.
What do you think ? Comment below..

Gasoline Price is breaking the Resistance zone at 2.50 ! Prices are soaring amid a spike in the price of oil, which is refined into gas for cars. The national average price of gas has been at a seven-year high in recent days. Technically price is breaking the next key zone and going up. Price has touched this key zone multiple times since 2011:
04-Oct-2011, 23-Nov-2011, 19-Dec-2011, 29-Jun-2012, 07-Nov-2013, 15-Sep-2014.

Motion Lotion Futures Appear Suspiciously Soggy ⛽🏎️📉Put away those Oklahoma Credit Cards,
Gasoline Prices appears set to soften.
Rallies post 13th August have Bear Market characteristics.
Subtle though market is also making lower highs.
*Short ideas are SELL ideas only, don't support outright short selling.*
Peek the detailed breakdown notes
in the high def chart links below :
NYMEX:RB1!
AMEX:UGA

RB Gasoline FuturesGasoline futures at resistance.
We are not registered or licensed in any jurisdiction whatsoever to provide investing advice or anything of an advisory or consultancy nature.
and are therefore are unqualified to give investment recommendations.
Always do your own research and consult with a licensed investment professional before investing.
This communication is never to be used as the basis of making investment decisions, and it is for entertainment purposes only.


RB1 is giving signal and strong momentum to buyAdvice from me. Don't put stop loss and take profit. Use alert

GASOLINE IS ON A DOWN TREND WHICH IS YOUR FRIEND FOR NOW Please share with me your point of view,
Regards.

Natural Gas (NATGASUSD): Catching a Pullback
Natural gas is approaching a rising trend line on a daily.
on 1H the price has formed a double top with a lower high breaking and closing below 1.62 minor support.
now the price may go lower.
target levels:
1.576
1.550


Long $SGG Sugar ETF at 33.50 or 10.30 #Sugar Futures Spot PriceSugar and Brazil Relationship:
Since Brazil has been the leading producer of sugarcane in the world, the value of the Brazilian Real plays a significant role in the price of sugar futures. Weakness in the Brazilian Real against the US Dollar encourages Brazil's sugar producers to boost exports. The logic is that a lower Brazilian Real incentivizes Brazilian farmers to produce more sugar to export sell for US Dollars. However, it's likely that the Brazil Real will appreciate against U.S Dollar over the next couple months based on technical analysis and possible economic intervention from the Brazilian Government.
- U.S. Dollar/Brazil Real pairing or BRB index showing many downside trend change signals here such as bearish RSI divergence since early March on Daily chart. Weekly chart showing RSI and MACD curling down from record highs with Momentum also curling down but after a double test of highs
Growing Ethanol Demand:
In July 2019, India announced they will work with Brazil on ethanol production. Using more cane in India to produce ethanol, instead of sugar, could reduce the global supply of the sweetener. 32M sugarcane could be used to produce ethanol and electricity instead of sugar in the next year. The joint venture, named BP Bunge Bioenergia, will manage 11 cane processing plants in Brazil with capacity to crush 32 million tonnes of cane per year
- Higher crude oil/gasoline prices benefit ethanol prices and may prompt Brazil's sugar mills to divert more cane crushing toward ethanol production rather than sugar production.
- India and many other countries are boosting ethanol output for sanitisers on coronavirus pandemic
Supply Curbs:
In July 2019, India, the second largest producer of sugarcane, announced they will create a buffer stock of 4 million MT of sugar for 1-year starting Aug 1 in an attempt to limit supply and support domestic sugar prices. Also, further supply disruptions are expected in India due to Coronavirus Lockdown.
- The Indian Sugar Mills Association (ISMA) reported Wednesday that sugar production in India dropped sharply by -22% y/y to 23.27 MMT during Oct-Mar
- Sugar production in Thailand, the third largest producer of sugarcane, is expected to fall 28% to a nine-year low of 10.5 million tonnes in the current crop season as drought curtails cane supplies
India Sugar Subsidies:
In August 2019, Brazil, Australia and Guatemala have complained again to the WTO to set up dispute panels to rule on India’s sugar subsidies.
- A change in WTO trade dispute status to Panel Composed on October 28th supports the global price of sugar. This news catalyst increases the possibility of removal of India sugar subsidies. If removed, India sugar stockpiles could fall thus decreasing global supply. Now in April 2020, we can assume the dispute must be in the further into review process
Real-Time CashFlo Twitter Post:
twitter.com

LONG UGA @ $8.50#Gasoline $RB_F RBOB futures bottom close here at $.54 as gasoline crack spread (difference between spot price of crude oil & gasoline) looks to be bouncing from lows.. Hourly chart showing capitulation volume & bullish RSI divergence suggesting downtrend weakening $UGA $USO $VLO - Twitter Post @CashFlo @ 10:53AM CST
twitter.com
There it is.. #Gasoline $RB_F RBOB futures likely long-term bottom here @ $.46 with massive capitulation volume & hammer candle rally back over $.50 or $UGA $8.80.. Expect gasoline futures upside rally to backtest 10dayEMA @ $.80 spot price or $14 $UGA stock price $USO $VLO - Twitter Post @CashFlo @ 1:27PM CST
Playing this upside move with UGA October 16th $16 calls @ 1.00
twitter.com


EIA Data Shows Cuts in Both Crude & Gasoline InventoriesHeadlines:
- EIA Data Shows Cuts in Both Crude & Gasoline Inventories
- Gasoline Futures Return to 0.85 Handle as Prices Fall -7%
- US Indexes Fall Along with Energy Sector Down -4%

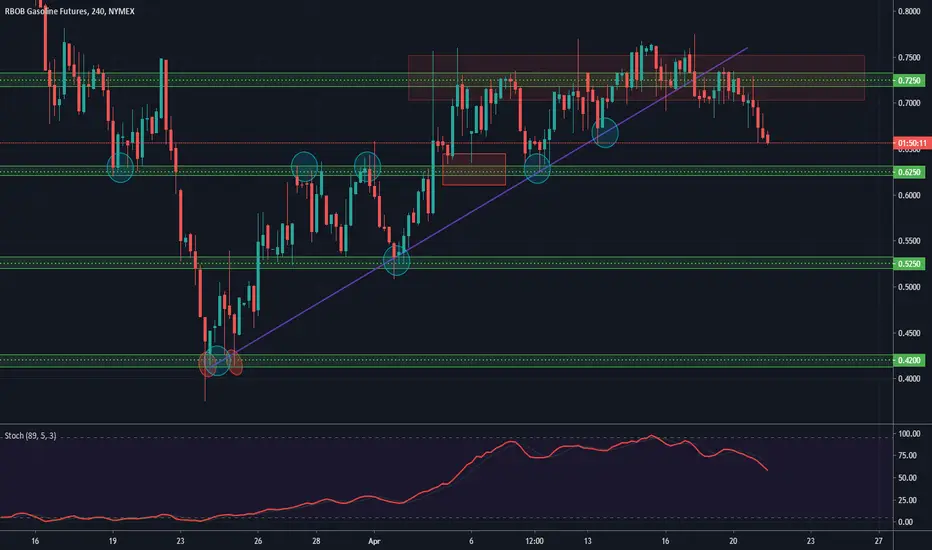
Gasoline Futures See 0.7250 Resistance Level as Prices Retrace- Gasoline has paired some gains heading into the new week with it falling down to the 0.6570 level as we near the London open.
- Much of the pressure in lower prices has been due to the ongoing demand issues we are seeing within the United States, however, we have seen prices in recent week pick up from lows around mid-0.40 level.
- As of this week, however, we have seen prices retrace lower after touching a key level of resistance around the 0.7250 level.
API Shows Gasoline Inventory Increase of 2.226 Million BarrelsAPI Release this week has shown a gain up for the week with Gasoline posting a build of 2.226 million barrels

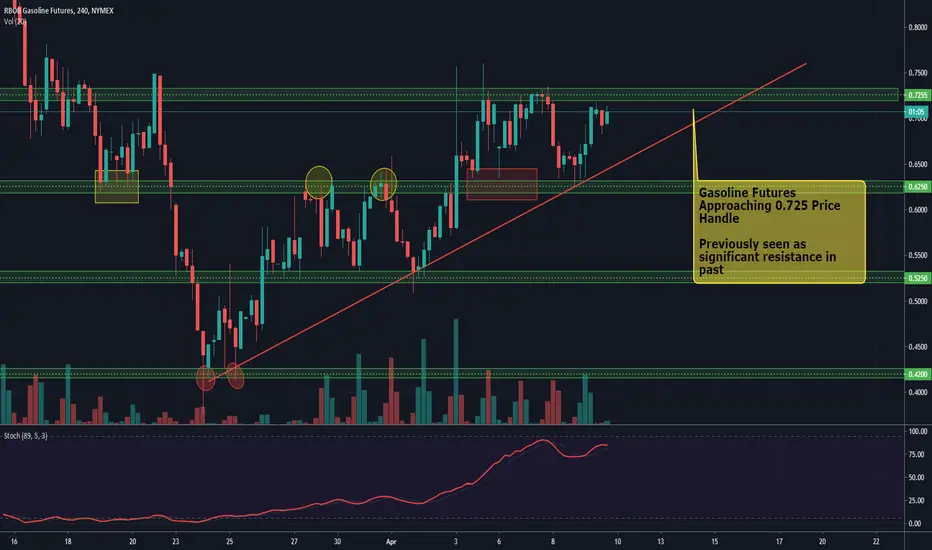
Gasoline Futures Approaching 0.725 Price Handle- Gasoline is now approaching the important 0.725 price handle once again
- This level has been seen in the past as a level of strong price resistance
Gasoline Bounces of 0.625 handle Seeing it Push Above 0.70 Level- Gasoline Bounces of 0.6250 handle
- OPEC+ Meetings scheduled for Thursday which could see volatility role into Gasoline markets
- Gasoline dropped to the beginning of the year due to falling demand within the US region

Gasoline Falls in Asia + Stock Futures Fall in Europe & USHeadlines:
• Crude Finishes Flat Whilst Gasoline Futures Drop -6% Within Asia
• CNOOC Announces the Postponement of its Canadian East Coast Project Due to Covid-19
• US Futures Fall as Virus Concerns Reappear Whilst Asia Starts the Quarter Off Lower
