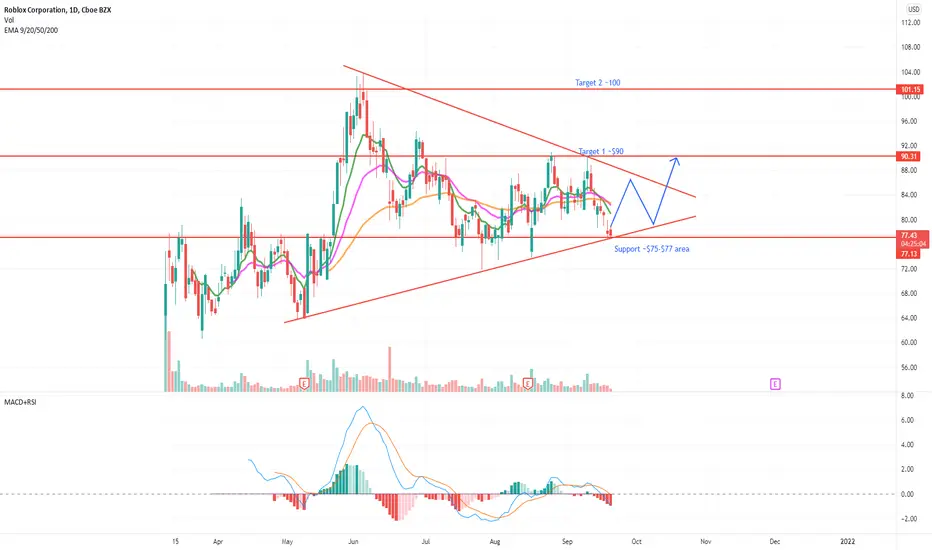
Long $RBLX CMP 77.28Long $RBLX CMP 77.28. Nice consolidation in symmetrical triangle. Sitting at nice support of $75-$77 area. Expecting breakout soon. Target 1 $90, Target 2 $100
RBLX
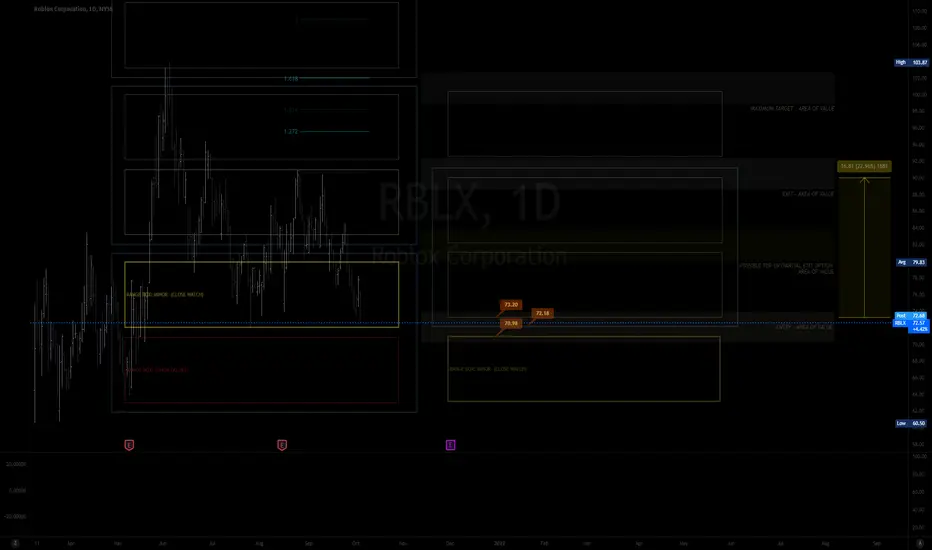
MY MINIMALIST ANALYSIS FOR $RBLX ROBLOX10.6.21 0509H PACIFIC
MY MINIMALIST ANALYSIS FOR $RBLX
ALERT: ENTRY
HOW TO USE MY CHART
Indicated are key support and resistance levels using small and large trading range boxes for ENTERING A SWING TRADE (Short - Long.)
It is designed for SWING TRADES at the BOTTOM. I do not SHORT, tho, you can use it.
LARGE BOXES are major pivots that will occur, while the small boxes are MINOR PIVOTS. These can be entries to a BUY/ SELL POSITION or an EXIT/TOP-UP AREAS.
You must watch out for Chart Patterns, Divergence, Candlestick Math, and your Fibs.
Further Analysis on price action is required on a 1HR-4HR chart when entering or closing a trade, depending on your risk appetite and trading style.
This CHART is best used without indicators. Price action, candlestick/bars, and FIBS alone will be sufficient as a major deciding factor for this CHART.
Disclaimer:
The findings/predictions of the following analysis are the sole opinions of the publisher of this idea and must not be taken as investment advice.
Thank You for your appreciation and support.
RBLX Montly entry ideaRBLX on the monthly with Fibs targets.
Stop loss should be based on what you can risk to loose and position size.

Roblox - RBLX - Need some more Robux?Roblox - RBLX - Need some more Robux? Get it from RBLX? Still trending upwards! Edutainment purposes Only!

RBLX Daily TimeframeSNIPER STRATEGY (new version)
It works ALMOST ON ANY CHART.
It produces Weak, Medium and Strong signals based on consisting elements.
NOT ALL TARGETS CAN BE ACHIEVED, let's make that clear.
TARGETS OR ENTRY PRICES ARE STRONG SUPPORT AND RESISTANCE LEVELS.
ENTRY PRICE BLACK COLOR
TARGETS GREEN COLOR
STOP LOSS RED COLOR
DO NOT USE THIS STROTEGY FOR LEVERAGED TRADING.
It will not give you the whole wave like any other strategy out there but it will give you a huge part of the wave.
The BEST TIMEFRAMES for this strategy are Daily, Weekly and Monthly however it can work on any timeframe.
Consider those points and you will have a huge advantage in the market.
There is a lot more about this strategy.
It can predict possible target and also give you almost exact buy or sell time on the spot.
I am developing it even more so stay tuned and start to follow me for more signals and forecasts.
START BELIEVING AND GOOD LUCK
HADIMOZAYAN

$RBLX STRONG SUPPORT Swing set up... The idea on this trade is to analyze how price plays around resistance to see if it respect or rejects off these supply zones.

Long $RBLX CMP $84.93Long $RBLX CMP $84.93. Nice consolidation in symentrical triangle. Keeping it on watch list for coming days.

Possible ZIG-ZAG correction on $RBLXLeading diagonal 1-5 (wave A)
Corrective B wave
Now: start of a new 1-5 wave C

$RBLX going 10% + pretty simple and straight forwardIm buying after $83.03 and will probably take profits around $90 this bullish idea only counts if it follows through up above that $83
MACD RSI looking good too sooooo... get ready for this smooth ride NYSE:RBLX

RBLX: Potential multibagger!A big company with lots of potential! Fundamentally, I think it has captured lots of upside. As it continue to grow, might even be bought out by big corporations like Microsoft.
Anyway, back to technical analysis.
Broke out of a down trendline back in the beginning of August, and an exhaustion gap right at the trendline! Market wasted no time in closing the gap within the same day.
Looking to enter at this retracement.
Entry = $85
Stop Loss = $82
TP1 = $90
Mainly to hold long term.
Disclaimer: I'm not giving any trading and investing advice. I'm just sharing my chart observations.
If you have any symbols that you'd like me to analyze, feel free to drop me a comment.

RBLX: Crucial point at $90Strong break of the flag on RBLX, yesterday price action was solid. A break of $90 and I think we could see a retest of previous highs around $94. $90 is crucial point to see if it could hold the trend or else rejection might happen. RBLX is one of Cathie's Wood favourite stock as well.

TrendyTrades: RBLX Inverse H&SInverse Head & Shoulders formation on RBLX popping out and retest a trend with a nice push up ahead.

$RBLXRoblox Corp stock has gained over 20.01% since Wednesday, March 10, 2021 when RBLX began trading.
The average rating from Wall Street analysts is a Buy.
In addition to the average rating from Wall Street analyst, RBLX stock has a mean target price of $87.60.
But in saying that, the stock has formed a falling wedge on the daily chart with a possible retest before continuing up..
Keep your eyes on this stock for a continuation..
- Factor Four

RBLX BreakoutFrom a purely charting perspective, this is a textbook setup for a breakout to the upside. One month full of consolidation, and now the chart is painting higher lows and clearing moving averages.
Aside from a heavy supply zone @ ~$86-87, a clear break and close above that level this week should send RBLX to $100+ in the ensuing weeks.

RBLX about to Go ParabolicBuy: $77 - $80
Stop Loss: $75
No fundamentals taken into consideration. I just know the start of a parabolic move when I see one

$RBLX GOING PARABOLIC?Watching this one either way this week! I expect Earnings volatility to be up!

$MSFT Resistance Break $300 PT In Reach?video breakdown and up date on $MSFT after a nice break of resistance and retest of linear deviation

Looking to play RBLX break and retestWaiting for RBLX to pull back and hold $83 range. If $83 holds $90+ will be the first quick target.

TrendyTrades: RBLX AnalysisHolding anchored VWAP, price at a good place here to go long. Two scenarios. If we drop, probably won't go further than 80.58 before bouncing.

$RBLX: Roblox has massive upside...$RBLX has come a long way down and found support at previous accumulation levels, we had a nice jump, as bulls expect earnings to go well. I'm bullish on the in game economy and the popularity of the game rising periodically. I do like the chart a lot here as well, and reward to risk is very good, so a buying opportunity on dips is in the cards. Keep an eye on it, if you are up for the year, you can risk buying before the earnings report, if not, wait to buy the next dip into support AFTER the earnings report is out of the way.
Best of luck,
Ivan Labrie.

RBLX ER MondayFalling Wedge breakout - Watch for a break above 28.25, the VWAP and resistance where the stock closed the past two trading days. Long above 86, and short below 82.

RBLX descending triangle above 78 for long. Target 90-95Descending triangle on a daily chart. Came back down to retest the 76-78 area.
Break above 78 could go to 90-95 level.
5% of the portfolio
Stop-loss 73

Gann Box - Drawn Over RBLX 8/5 [LONG]Pre-market analysis of the 1-Day Time frame for RBLX.
Gann Box drawn to predict future support & resistance areas.
