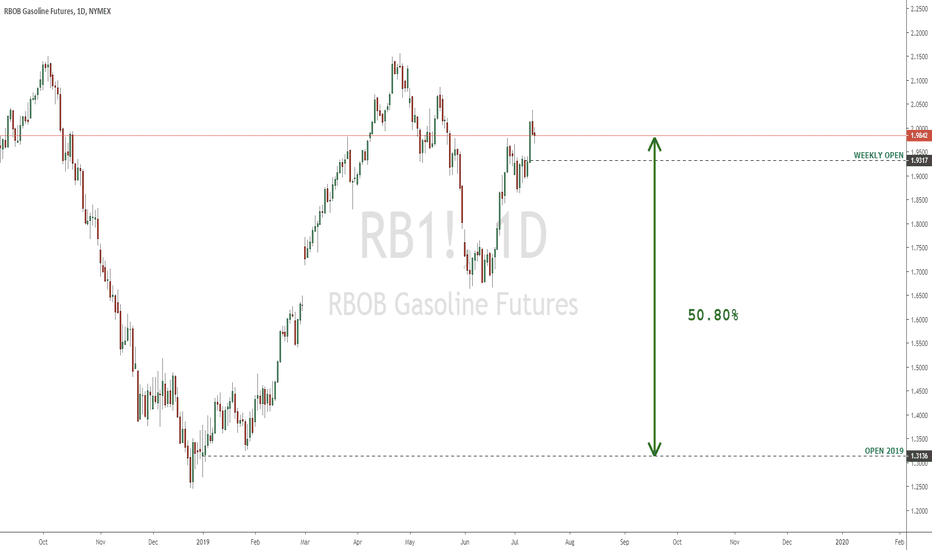
Rbob
Gasoline Continues Down -31% on Monday Close as Demand FallsHeadlines
• Further Oil & Gas Companies Announce Expenditure Cuts with TOTAL Set to Cut into the Year
• Gasoline Continues Its Plummet Down -31% on Monday Close
• UK Closes Non-Essential Business as Countries Go into Quarantine to Slow Spreads
Gasoline Down + Oil Extends Losses in Asia With Crude DownHeadlines:
• Crude Extends its Losses in Asia With NYMEX Crude Down -3.16% + RBOB Gasoline Down -3.29%
• UN Secretary General Calls for Immediate Ceasefire After 33 Turkish Soldiers Killed in Idlib
• Asian Equities Feel Full Force of Sell Pressure with Nikkei225 Down -4.60%
RBOB Gasoline Futures (Jan 2020) - Rectangle in formationNYMEX:RBF2020
Clear rectangle on the January Futures of the RBOB Gasoline.
A breakout could lead to an interesting trend to ride.
When trading commodities and futures contracts you should always take into account the specifications of each contract to calculate exactly how many contracts to buy or sell short on the basis of your risk management and position sizing.
www.cmegroup.com
HOF2020-RBF2020, Buy HeatingOil Jan20 & Sell RBOB Gasoline Jan20HOF2020-RBF2020
Our trade on this spread between Heating Oil Futures F20 and RBOB Gasoline Futures F20 has started.
In 87% of the times this spread is profitable in the seasonal window.
Our job is to find the best time both statistically and technically.
Short on RBOBShorting RBOB ( Gasoline ) at 2.15.
TECHNICAL
This is largely based on a technical situation:
Two (2) fib levels confluence
88.8% ( MAY ’18 -> DEC ‘18 )
1.27% ( MAR ’19 -> APR ‘19 )
One ( 1 ) notable Fib “Time” Level ( 1.382% FEB ’16 -> MAY ’18 ( Bullish Retrenchment ) )
Previous Structure
Mid ’18, Aug ’17 & Jun ‘15
RSI Divergence
RSI ( Daily Chart ) topped out in MAR; a further push up would be x2 divergence
100 Day MA
I haven’t fully quantified this part albeit it will likely end up ~20% above the 100 day moving average; it has certainly exceeded that ( NOV -> DEC ’18 ) albeit 20% was the top in MAY ‘18
Round #
It’s a round #
FUNDAMENTAL
There are a lot of fundamental factors affecting why this might not be a good trade. The US is looking to end waivers on Iran, Venezuela ( it’s happening ), Saudi Aramco is looking to IPO soon, etc.
On the other hand, Trump has been pretty quiet on oil prices ( BTW – I know this trade is RBOB ) & seasonality ( I haven’t done my own research yet ) suggests it’s coming to a consolidation stage ( link ).
IN SHORT
Stop Loss: ( 2.2587 )
TP: ( 0.618 from 24 DEC ‘18 however far it pushes into it )


