RCL Call Options..In bound premiums Based on trend analysis and daily candle close a see a some short term buyer taking control of current trend. Be weary.
RCL

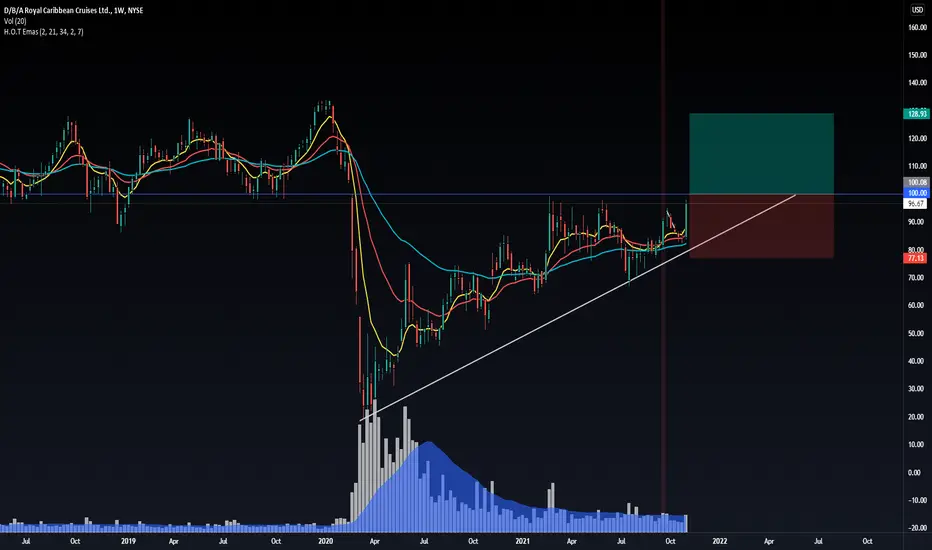
RCL Uptrend EstablishedUptrend in green has been established and is now a support for the second leg of the currently forming double bottom
Other areas in yellow boxes are similar double bottoms
Very bullish

US Stock In Play: $NCLH$NCLH - Consumer Cyclical | Travel
strongest among the 3 major cruise liners ($CCL & $RCL) as RS flatten since mid jun & 1st in bullish MA crossover (20dv50d)
higher lows tightening within its ascending triangle. currently near the apex of it
pivot coincides VWAP at $14.35

Regional Container Lines: Price Action and Areas of Interest It looks to me as if RCL is a corrective move to the downside.
RCL is interesting as price action brings the actively traded value of the stock down to 37 Baht, some 30 Baht away from it's all-time high. Despite convincingly bearish PA since August of 21' RCL has posted great profits, with higher revenue and somehow, a higher profit margin every quarter.
Their assets have grown significantly without trapping themselves in debt, while their cash and cash equivalents have grown almost 500% since 2015. The company could pay off all their 5.7 Billion of debt with just their cash. This is great, considering the tumultuous times we are in! They also have the cash to acquire more PPE (Which they have done).
In the short-term I think there is potential to find support at this level and potential for volume to move price to the upside.
4HR View: I'm using the 4HR view because the E of an ABCDE does not need to touch the upper trendline and I'm not entirely sure how high we go before the E is completed. It is also possible that we can have a "throw-over" of the upper trendline, in that case we can expect price to move lower than illustrated here.
As said in the beginning of this post, I think it is probable that we have PA moving to the downside. As an interested buyer I have outlined potential levels of interest. They're outline in the chart. This is my perspective from the 3D Chart.

RCL in a long term downward trendLooking at the past two years of charts for RCL (one of my favorite stocks, also a cruise line member, nice little perk if you own 100 shares on each trip).
So charting this out taking out the noise of March 2020 we are in a downward channel, but it is not a very steep downward channel which is comforting.
Looking for buying opportunities at the bottom of the channel and then waiting to see price action at the top of the channel. Very careful on the buys right now given the pressure on the entire market at the moment, and also the amount of debt that the leisure travel industry has on it at the moment.

Royal Caribbean Cruises (NYSE: $RCL) Looking Toward New Highs!👀Royal Caribbean Cruises Ltd. operates as a cruise company worldwide. The company operates cruises under the Royal Caribbean International, Celebrity Cruises, Azamara, and Silversea Cruises brands, which comprise a range of itineraries that call on approximately 1,000 destinations. As of February 25, 2022, it operated 61 ships. The company was founded in 1968 and is headquartered in Miami, Florida.

Royal Caribbean Cruise (RCL) Spike at 50%Today at the open MANY stocks in the S&P 500 did early trading spikes before recovering their trading range. NYSE:RCL happened to do this at a 50% Retracement Level Support.

Short $RCL CMP $79.21Short $RCL CMP $79.21. Heavily affected by Covid news. Recent lockdown news in EU dragging the price down. Stock price is below 200 SMA . $75 area may act as support but heavy selling may take further down to $65 area in near future.

RCL - Second chance for those who did not have timeWe are going on a cruise at an interesting price. A double top is drawn on a monthly timeframe. I think it's easy to get to 53.
Purple - limit orders.
Green - take profits.

RCL getting squeezed RCL has a massive weekly ascending triangle,
Price is squeezing below 100.00 psychological level.
Watching it above it for a beginning a a good run towards 130
RCL | About to make Grand Supercycle Wave 2: TP 107.50 SL 40.00RCL | Thailand SET Index | Transportation Sector | Possible Wave 2 of Grand Supercycle - TP 107.50 Stop Loss Conservatively 40.00 (EMA200)
First Buy: 44.00
Second Buy: golden cross EMA10
Third Buy: cross up EMA20 or breakout downtrend channel of trade
Key indicators:
> Truly aggressive Banker Share Volume turned green and Smart.
> BBD signal about to cross up 0.
> Smart Money and Bottom
> All-time high BDI index

RCL Rising?We just hopped on a RCL cruise ship and the premise that the tide will rise at least 5% to hit our target.

Cruise ships sinking..!I would like to review my post on August 15:
Tough week ahead for cruise ships!
You judge the accuracy
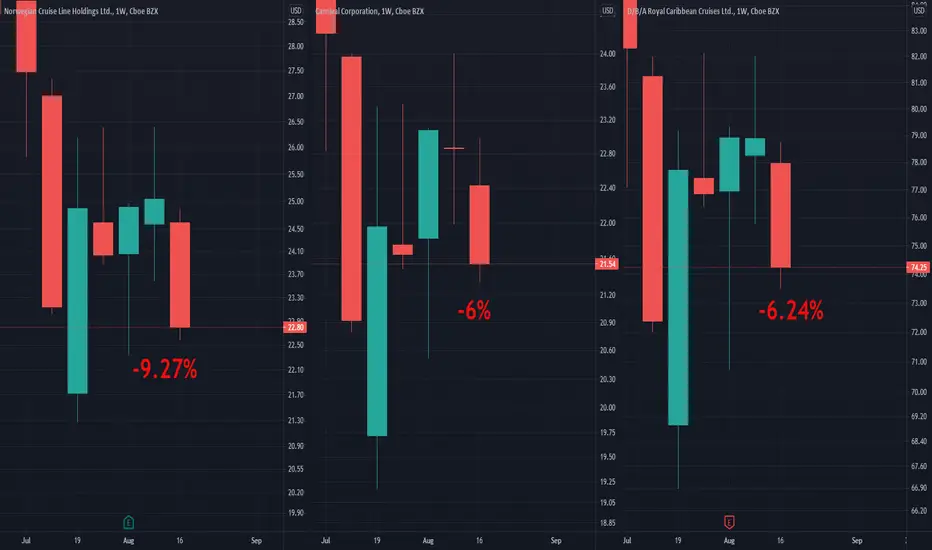
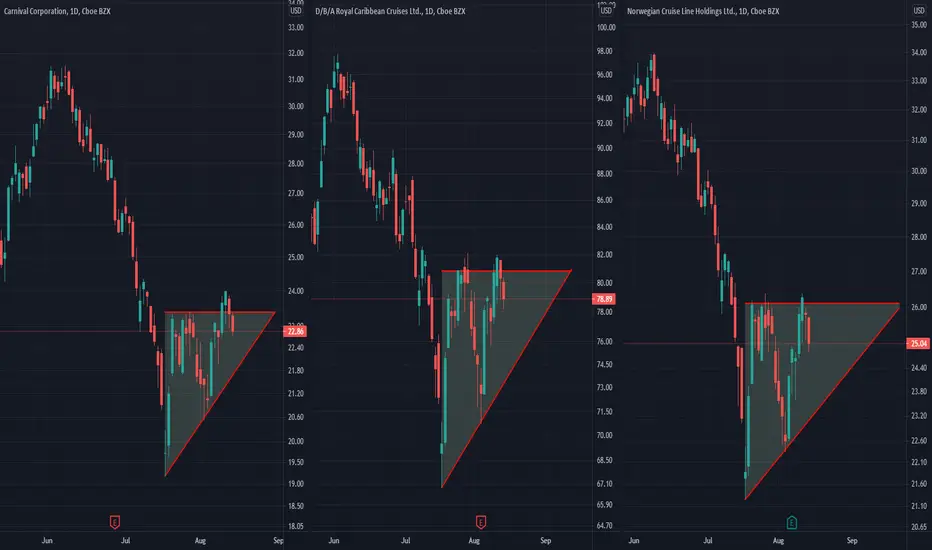
Tough week ahead for cruise ships!Notice: these charts belong to 3 different companies..!
Another example to challenge The Random Walk Theory..!
I am curious to know what would Malkiel do if he had access to Tadingview in 1973 ???
More than two dozen cases of Covid-19 have been detected among crew and passengers aboard a Carnival cruise ship, according to the Belize Tourism Board.
One passenger and 26 crew members tested positive prior to calling on the port in Belize City, a news release from the tourism board said. All 27 infected individuals are vaccinated and most are asymptomatic, according to the release.
Reference:
www.cnn.com


RLC long at supportTook a long position at $10 looking for a breakout of trendline and continuation over $20

Bull Flag Breakout for Royal CaribbeanPrice target is $111 based on height of flagpole. Downside risk if it breaks back into the flag and then under the 50 day MA at ~$86. Possible open gap target much further to the downside if it really starts to go south, but this looks bullish for now.

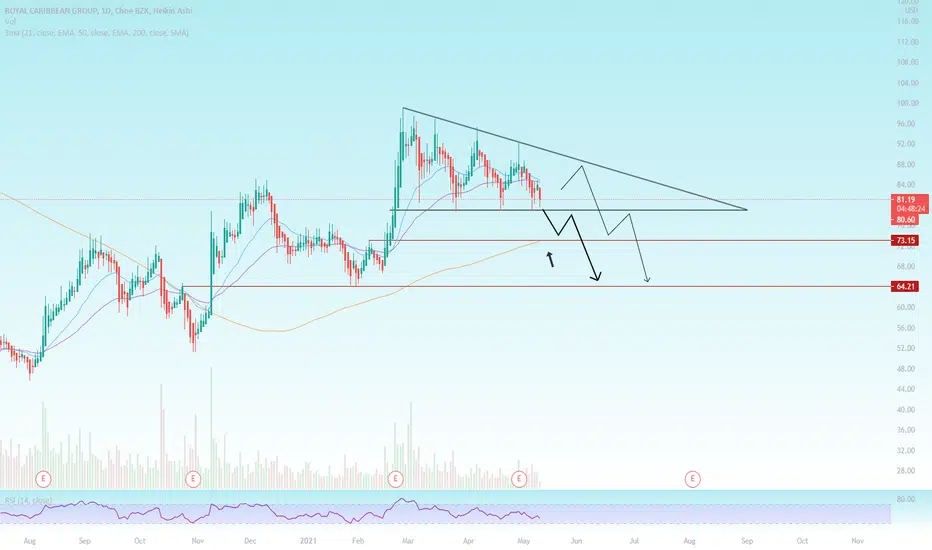
RCL Short to 65...Although in the long term I am bullish on cruise lines, especially with covid restrictions being lifted, as of now this market is not kind to much of the recovery stocks
This is textbook put play, we have a descending triangle formed on the daily and its just barely being held by this ~79 support level
I will be playing 6/18 75p on a confirmed break of 78.50
PT1: (200sma) 73.15
PT2: 64.21
Happy trading!
RCL 1D BULL FLAGBull Flags are a Range that is a repeatable trading chart pattern.
Bull Flags are a descending range chart patterns that will have a directional bias (Long) depending on the previous incoming trend.
Each chart pattern will have defining trendlines of the support/resistance levels creating the pattern.
What ever time frame you are trading this chart pattern, wait for a candle close outside of the trendline in the direction of the breakout candle. (Our time frame preference is the Daily chart).
Add volume indicator - Volume is the amount of $ that went into a particular candle or in Forex the # of trades that took place.
Add ATR indicator - Volatility is the amount of price movement that occurred. Use the ATR to measure the price movement.
When you see descending Volume bars and descending ATR line (which indicates volatility) this shows
a dis-interest in traders to invest in this pair creating consolidation which creates the chart pattern.
Trade Management after there is a breakout candle close.
1 - Position size (compare volume bar to volume ma line).
a - Breakout candle must be 100% of volume average for a full position size.
b - If 75% of volume average then ½ position size. (To find 75% of Volume
look at the charts volume settings – divide smaller # into larger # = 75%+)
If not 75% then stand aside from the trade.
2 – If candle breaks out of a trendline, 15m before the close of the day prepare your buy/sell order.
Enter two trades. 1st trade will have a SL & TP. It will close automatically when the 1st TP is hit. 2nd
trade only has a SL and will be allowed to run. When 1st TP is hit move the SL to breakeven. Look
at ATR and prepare SL at 1.5 of ATR. Prepare 1st trade TP at 1 of ATR.
3 - SL for both trades will be 1.5 x ATR.
4 - 1st trade TP will be 1 x ATR.
5 - No TP on 2nd trade – letting profit run and adjusting SL to follow price.
6 - When 1st TP hit – move 2nd trade SL to breakeven.
7 - Adjust the 2nd trade SL to follow price.
*8 – After Breakout candle – if price closes back into chart pattern close trade don't wait for SL to be hit.
*9 - When breakout candle is more than 1 ATR from breakout candle open.
a - Enter 1st trade at candle close with ½ position size.
b - Enter 2nd trade with a pending limit order that is 1 ATR of breakout candle open.
c – Price should pullback to that pending limit order for 2nd trade.
d – If Price returns back into chart pattern close trade before SL is hit.

Time to SELL Cruise Lines? CCL, RCL, NCLHThe meme stocks ( NYSE:CCL , NYSE:RCL , NYSE:NCLH ) in Cruise Lines have finally recovered but are they now a SELL? These stocks are coming up to a key Ichimoku Cloud Resistance level that traders and investors should pay attention!


NCLH is primed... $38+ incomingSimilar to my post in $CCL... Giant Cup & Handle, Bull Flag, Inverse H&S, overall bullish momentum in economy stocks... cruises are the last to ride, but we can still catch it.
Has a chance to fill the gap to $48+ by summer. Entered in $23s.
